Change Detection
Change Detection calculates the difference between the current metric value and its value N minutes ago and aggregates it, triggering an alert when the result exceeds the threshold. Suitable for detecting sudden anomalies in business data, such as a sudden drop in order volume or a sudden spike in request volume.
Quick Start
Step 1: Enter the Creation Page
Enter Smart Alert → Alert Rules, click New Alert Rule, and select Change Detection type to enter the configuration page.
Step 2: Configure Detection Rules
- Select Effective Scope (resource domain, default empty, required)
- In Metric Selection, select the metric to monitor (such as request count), set the aggregation method (such as sum), and add a grouping dimension (such as service)
- Set Result Data: select "Last N minutes" and "Last M minutes" as the two time windows, and choose how to compare the metric between them (such as difference)
- Configure Trigger Conditions: fill in the number of consecutive times the result data must satisfy the condition, and fill in the thresholds for Critical / Error / Warning levels
- Configure Data Gap and Data Delay strategies as needed
- Configure Aggregation Rule as needed (such as aggregating by service)
Step 3: Fill in Alert Content and Save
- Fill in Alert Title (supports variables, such as
Service: ${service.customizedName} request volume changed abnormally) - Fill in Notification Content as needed (default template used if left blank)
- Select Notification Strategy
- Set Effective Time (All Time / Periodic Time / Custom Time)
- Click Save to complete creation
Feature Description
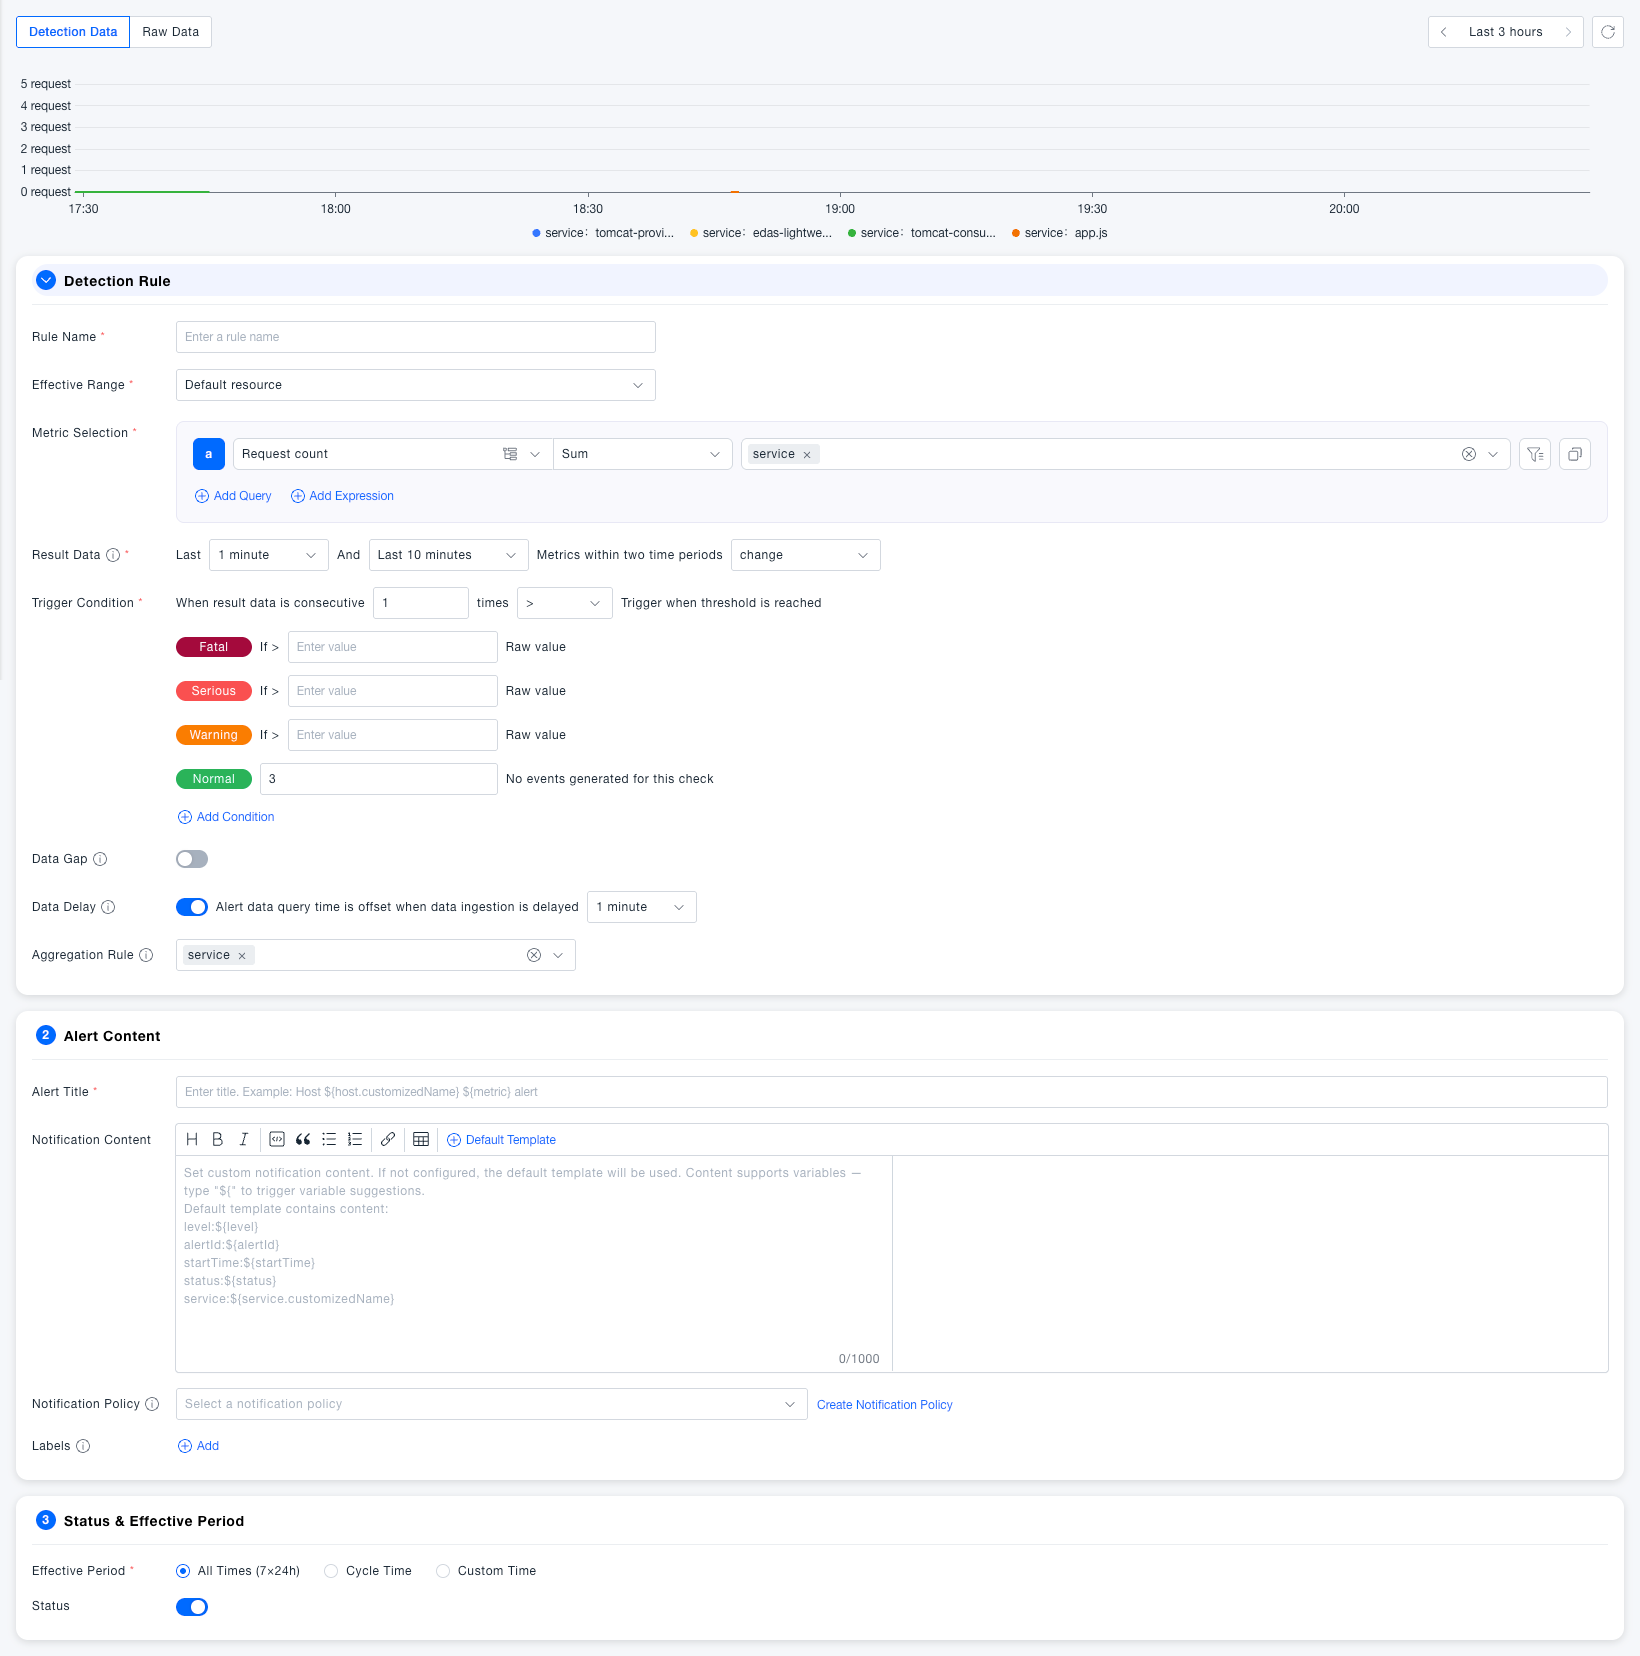
Detection Rules
Basic Configuration
| Field | Required | Description |
|---|---|---|
| Rule Name | Yes | The name of the alert rule, used for quick identification and search in the rule list |
| Effective Scope | Yes | Select the resource domain to which this rule belongs; the rule only applies to data within this resource domain |
| Metric Selection | Yes | Select the metric to monitor, set the aggregation method (such as sum), and optionally add a grouping dimension (such as service); supportsAdd Query and Add Expression |
Result Data
| Field | Required | Description |
|---|---|---|
| Time Window One | Yes | Set "Last N minutes" as the near-side time window, default 1 minute |
| Time Window Two | Yes | Set "Last M minutes" as the comparison time window, default 10 minutes |
| Comparison Method | Yes | Calculates thedifference in the metric between the two time windows, used to measure the magnitude of short-term change |
The larger the gap between the two time windows, the easier it is to capture sudden changes against a relatively stable baseline; windows that are too close together may amplify normal fluctuations and cause false alarms.
Trigger Conditions
| Field | Required | Description |
|---|---|---|
| Continuous Trigger Count | Yes | An alert only triggers once the result data satisfies the condition for N consecutive times, avoiding false alarms from transient jitter, default 1 time |
| Comparison Method | Yes | Supports operators such as>, >=, <, <=, = |
| Critical Threshold | No | An alert of Critical level triggers when the result data exceeds this threshold; checkRaw Value to additionally require the raw metric value to satisfy the condition before triggering |
| Error Threshold | No | An alert of Error level triggers when the result data exceeds this threshold; checkRaw Value to additionally require the raw metric value to satisfy the condition before triggering |
| Warning Threshold | No | An alert of Warning level triggers when the result data exceeds this threshold; checkRaw Value to additionally require the raw metric value to satisfy the condition before triggering |
| Normal Recovery Count | Yes | The status automatically returns to Normal after N consecutive detections with no alert events, default 3 times |
| Add Condition | No | Supports adding custom alert levels with their own thresholds |
Advanced Configuration
| Field | Required | Description |
|---|---|---|
| Data Gap | No | DefaultOff; when enabled, if no data is reported within the specified time, it still participates in threshold evaluation, preventing missed reports due to collection interruption |
| Data Delay | No | DefaultOn, offset 1 minute; when enabled, the query time window is shifted back overall to avoid misjudgment caused by data not yet being available |
| Aggregation Rule | No | When there are multiple time series under the grouping dimension, defines the aggregation granularity, e.g., aggregating by service so each service alerts independently |
Alert Content
| Field | Required | Description |
|---|---|---|
| Alert Title | Yes | The title of the alert event, supports variables such as${service.customizedName}; it is recommended to include the object and metric name for quick identification |
| Notification Content | No | The body of the alert notification, supports rich text editing and variable interpolation |
| Notification Strategy | No | Select the notification channel and recipient configuration after the alert is triggered; if none exists, clickCreate Notification Strategy to create one |
| Labels | No | Tag alert rules for easy filtering and classification management |
When notification content is left blank, the system uses the default template, which includes Alert Level ${level}, Alert ID ${alertId}, Alert Time ${startTime}, Alert Status ${status}, and Service ${service.customizedName}, which satisfies most scenarios.
Status & Effective Time
| Field | Required | Description |
|---|---|---|
| Effective Time | Yes | All Time (7×24 hours): Always effective; Periodic Time: Set by workday/weekend cycle; Custom Time: Specify specific time periods to be effective |
| Start/Stop Status | Yes | Controls whether the alert rule is running; after being closed, the rule pauses detection and does not generate alert events, defaultEnabled |
Common Scenarios
Scenario: Monitoring a sudden drop in order volume Select the order volume metric, set the difference between "last 1 minute" and "last 10 minutes," and set the Critical threshold to -50 (a drop of 50 or more orders), detecting abnormal traffic declines in time.
Scenario: Monitoring a sudden spike in request volume Select the request count metric, aggregate by service, set the difference between "last 1 minute" and "last 30 minutes," and trigger a Warning-level alert once it exceeds the set threshold, identifying traffic spikes or abnormal requests.
Notes
Setting the two comparison time windows unreasonably (e.g., too short or too close together) can easily amplify normal fluctuations and cause false alarms. It is recommended to choose an appropriate time span based on the historical fluctuation pattern of the business metric.