Alert List
The alert list aggregates all triggered alerts, supporting multi-dimensional filtering and viewing by level, status, rule type, etc. Click any alert to enter the details page to view detection data, status changes, notification records, and associated events.
Quick Start
Step 1: Enter the Alert List
In the navigation bar, enter Alert List. The top of the page summarizes the current number of alerts at each level (Critical / Major / Warning / Minor / Notice).
Step 2: Filter Target Alerts
Use the left filter panel to narrow the scope by Status, Rule Type, and Object Type; or use the top search box to precisely filter by alert name, level, Labels, entity attributes, etc.
Step 3: View Alert Details
Click any alert entry to enter the details page. Use the Detection Data, Status Changes, and Raw Data tabs to locate the source of the anomaly; use the bottom panel to understand rule configuration through Related Information, confirm whether notifications were delivered through Notification Records, and view specific events that triggered this alert through Event List.
Step 4: Handle Alerts
Click Close on the list or details page to manually close alerts; if you need to retain data, click Export to download alert information as a file.
Feature Description
Alert List Page
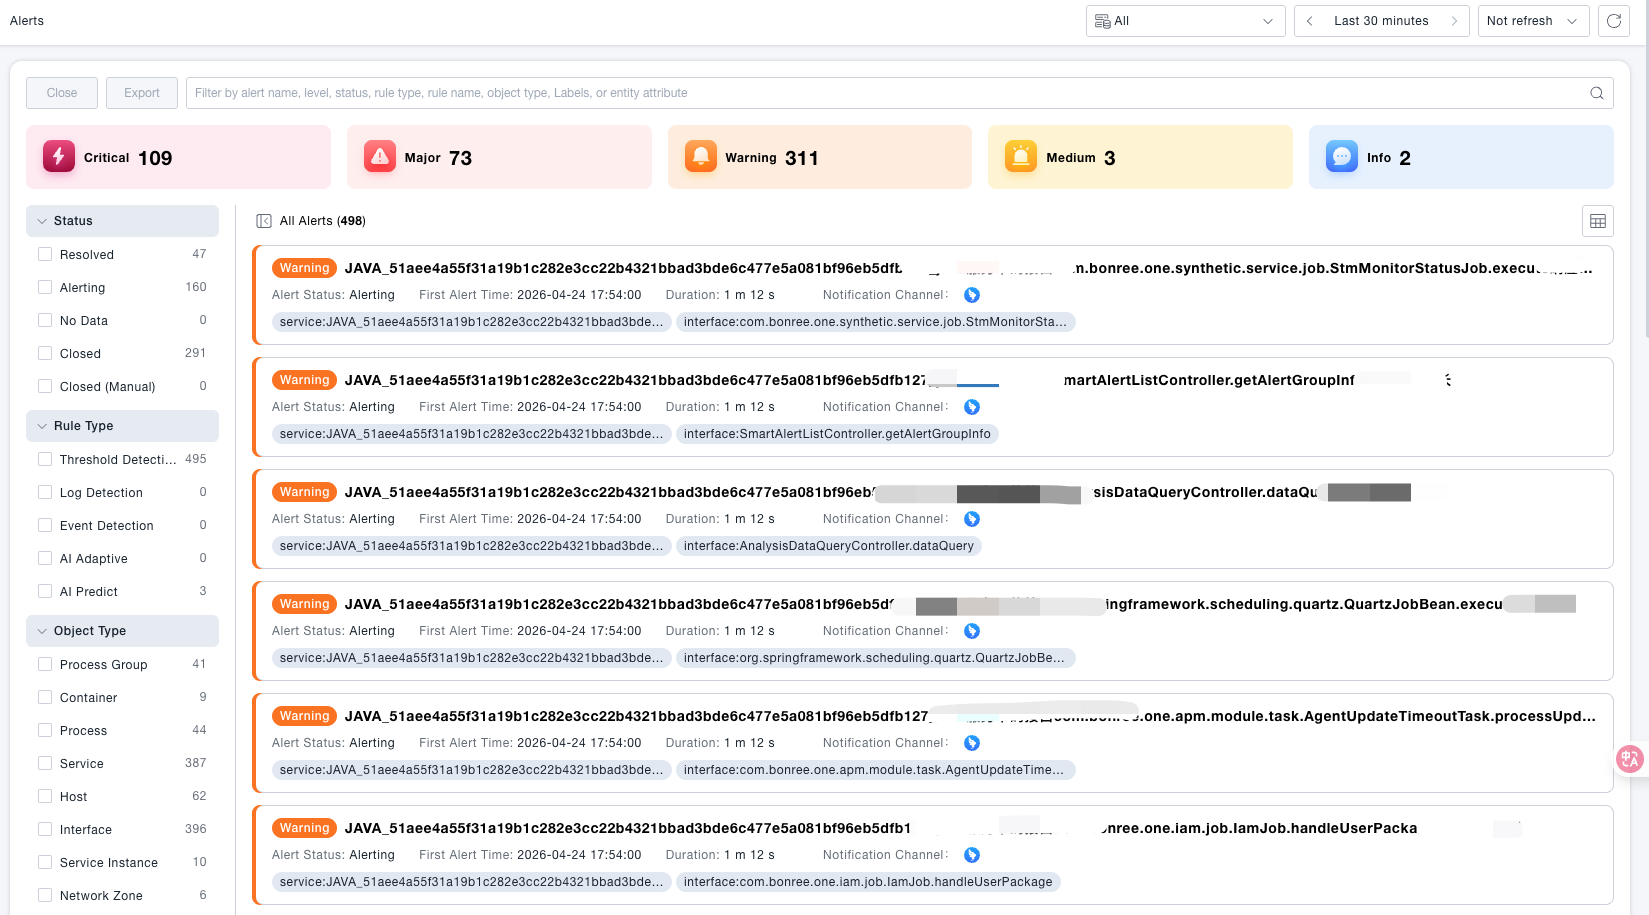
Level Summary Bar
The top of the page displays the total number of current alerts by level. Click any card to quickly filter alerts of the corresponding level. The following five levels are supported:
| Level | Meaning |
|---|---|
| Critical | Highest priority, requires immediate handling |
| Major | High priority, significant impact |
| Warning | Medium priority, requires attention |
| Minor | Low priority, can be tracked |
| Notice | Informational notification |
Filter Panel
The left panel supports multi-condition combination filtering. The grouping descriptions are as follows:
| Filter Dimension | Options | Description |
|---|---|---|
| Status | Recovered / Alerting / No Data / Closed / Closed (Manual) | Filter by current alert processing status |
| Rule Type | Threshold Detection / Log Detection / Event Detection / AI Adaptive / AI Forecast | Filter by the type of rule that generated the alert |
| Object Type | Terminal Application / Process / Database Call / Service / User Group / Host / Page / Service Instance, etc. | Filter by the type of monitored resource object |
List Operations
| Operation | Description |
|---|---|
| Close | Manually close selected alerts, status becomesClosed (Manual); suitable for alerts that have been confirmed processed or are false positives |
| Export | Export current filtering results as a file for archiving or offline analysis |
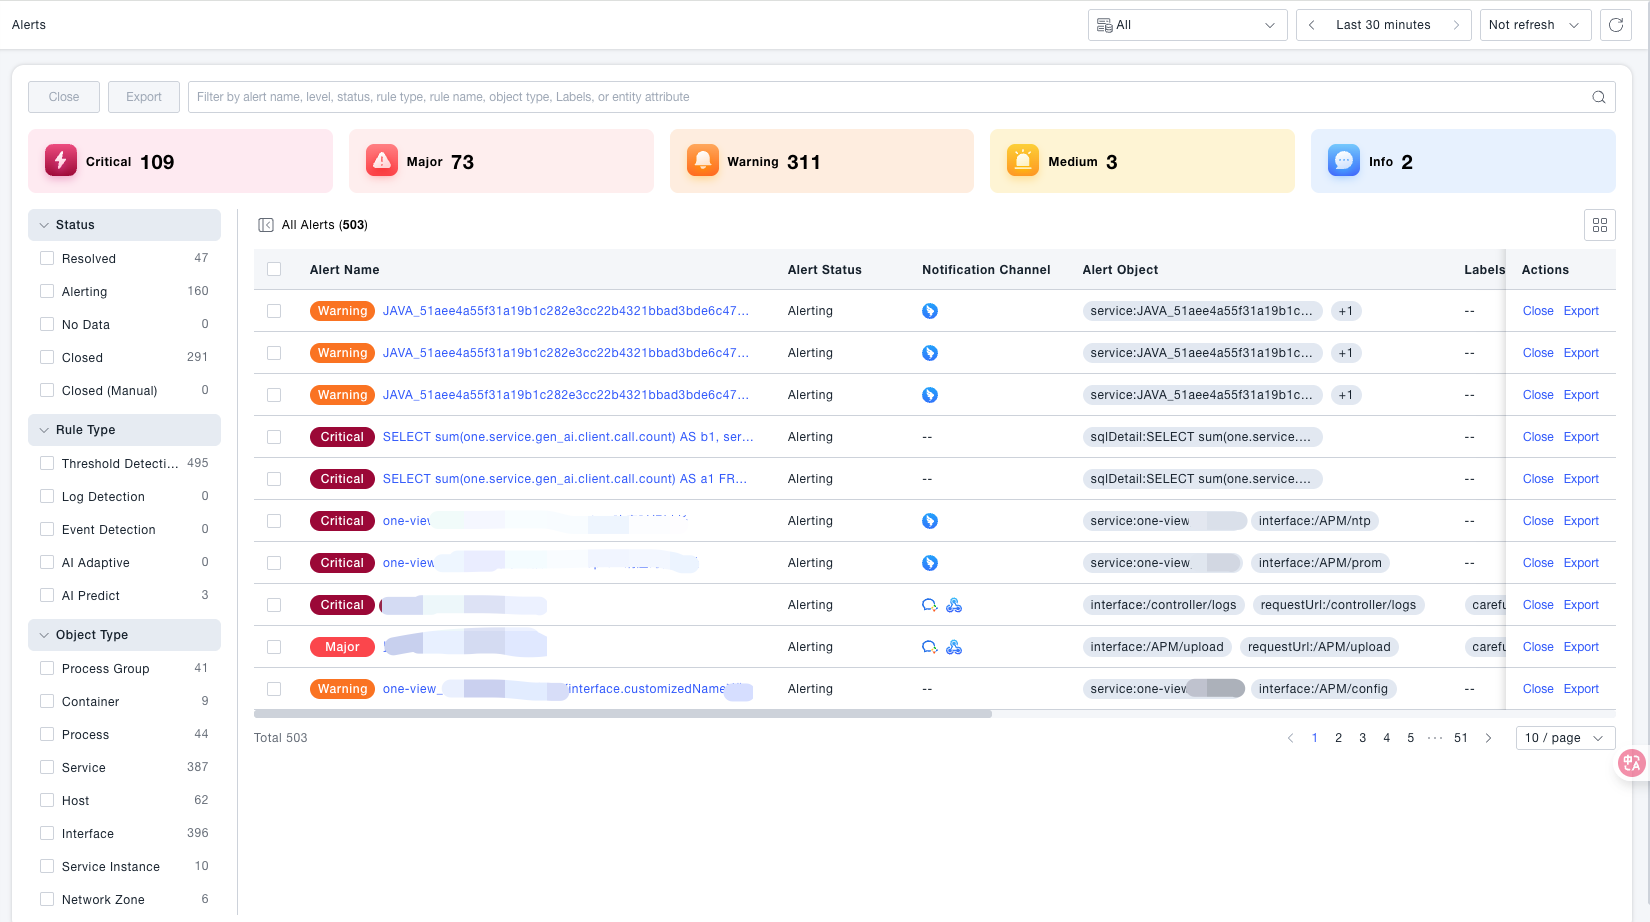
| Switch View | The top right corner supports switching betweenCard View and Table View. Table view shows more fields (alert rule, resource domain, alert time, etc.) |
| Time Range | The top right corner allows adjusting the time range for alert queries |
| Refresh Frequency | Supports setting automatic page refresh interval, default is no refresh |
Alert Details Page
Click an alert entry in the list to enter the details page. The top displays the alert name, current status (Alerting / Recovered), alert level, occurrence time, update time, and duration.
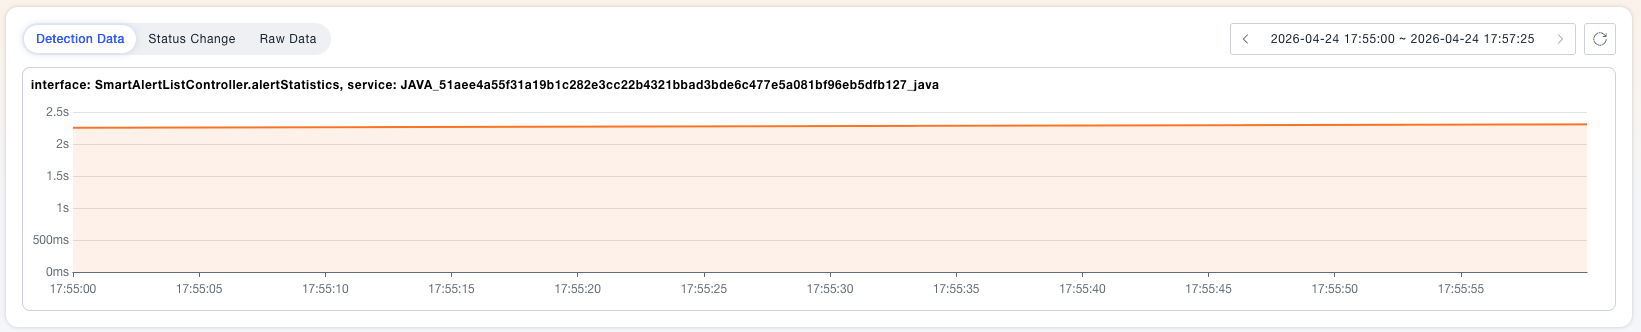
Detection Data Tab
Displays the indicator trends of each monitored object (split by grouping dimension) before and after the alert time in the form of line charts, helping to intuitively determine which object has an anomaly and the magnitude of the anomaly. Supports filtering specific objects through search conditions and adjusting the time range to view longer-term trends.
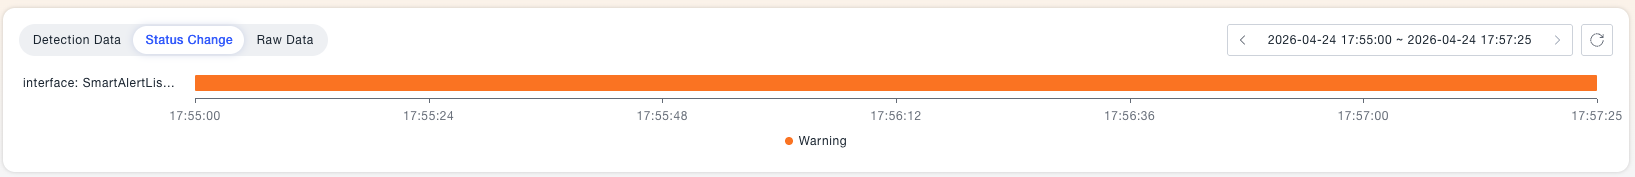
Status Changes Tab
Displays the status distribution of each object on the timeline in the form of a Gantt bar chart, which can quickly determine whether anomalies occurred simultaneously or sequentially, assisting in determining whether it is a systemic problem or an individual case.
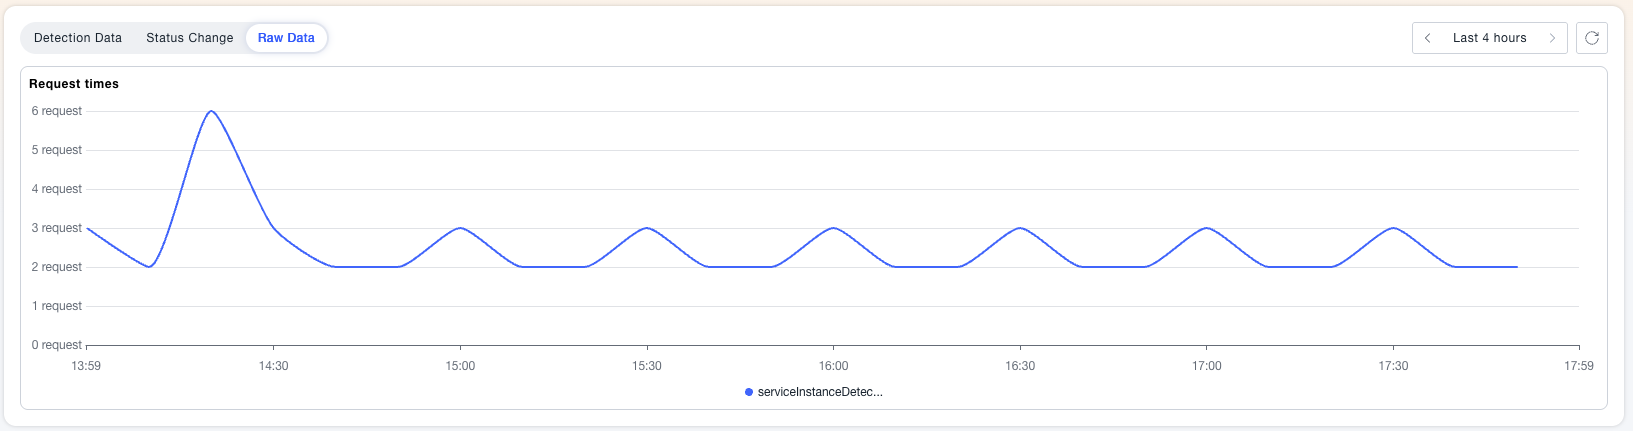
Raw Data Tab
Displays the raw indicator line charts that triggered the alert, with multiple timelines distinguished by host or grouping dimension. The difference from detection data is: this is the unaggregated raw collected value, suitable for use when suspecting that aggregated results have masked details.
Bottom Details Panel
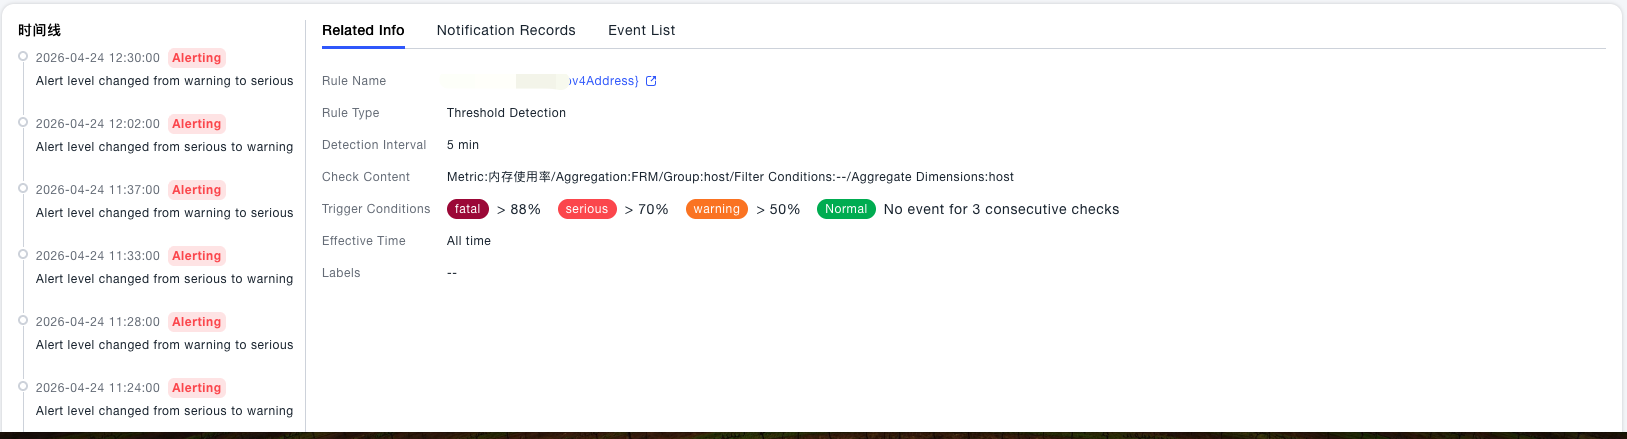
Related Information
Displays a summary of the rule configuration corresponding to this alert, including:
| Field | Description |
|---|---|
| Rule Name | Click to jump to the configuration page of the corresponding alert rule |
| Rule Type | Such as threshold detection, log detection, etc. |
| Detection Interval | Detection time window configured in the rule |
| Detection Content | Indicator name, aggregation method, grouping and filtering conditions |
| Trigger Conditions | Thresholds and recovery conditions for each level |
| Effective Time | Effective time period settings for the rule |
| Labels | Custom labels mounted on the rule |
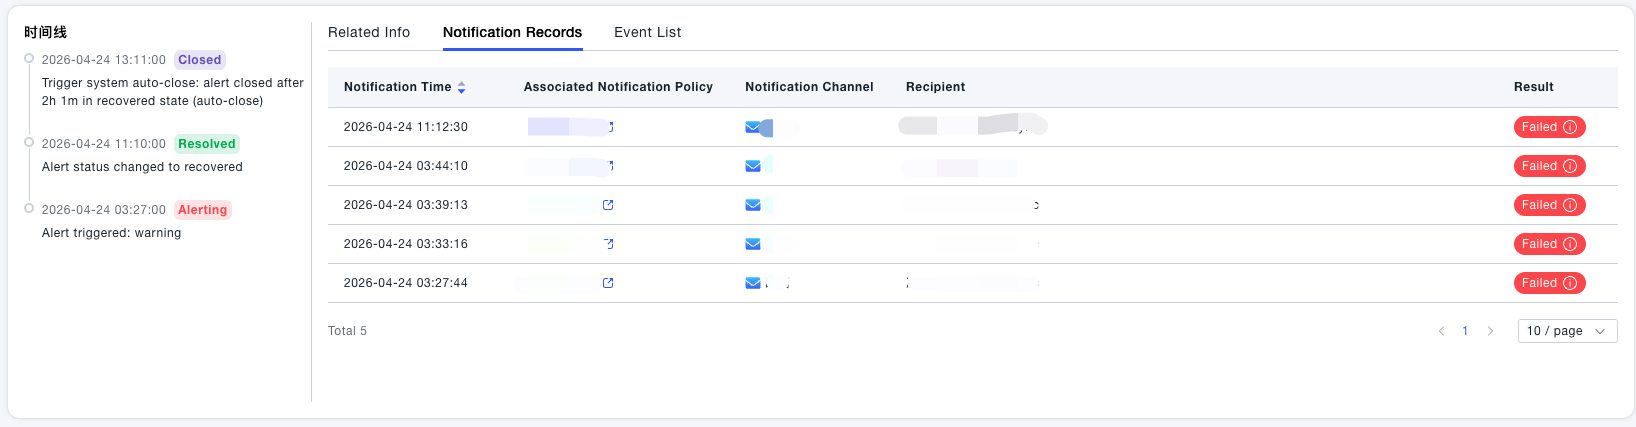
Notification Records
Lists all notification sending records after this alert is triggered, including notification time, associated notification strategy, notification method, notifier, and sending result. If the list is empty, it means the alert rule is not configured with a notification strategy or the notification has not been sent yet.
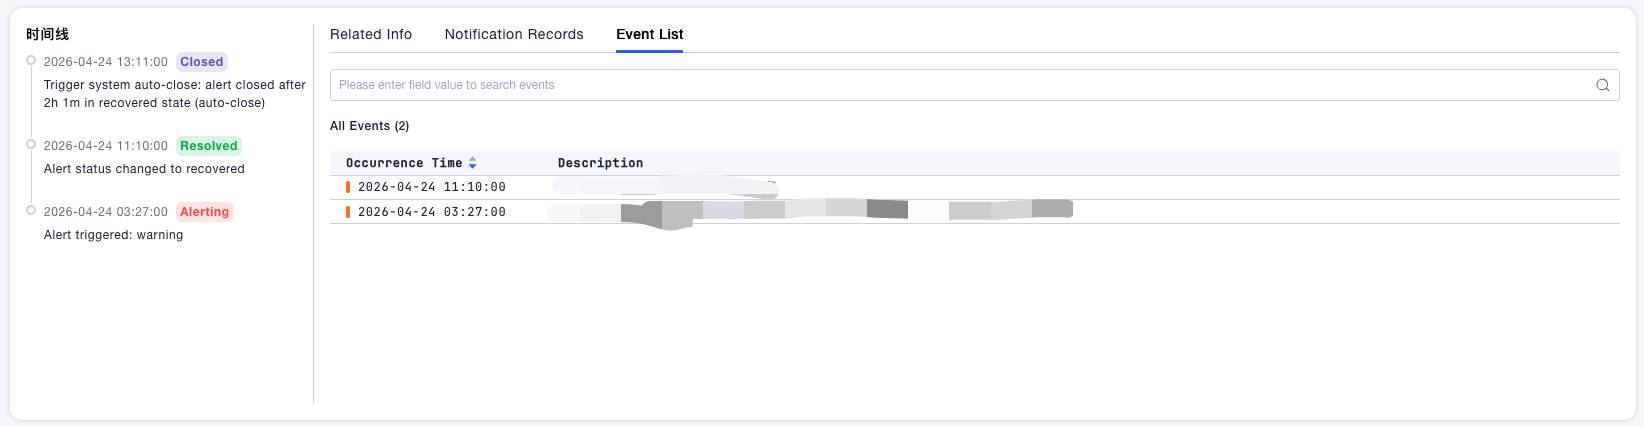
Event List
Lists all specific events that triggered this alert. Each event includes Occurrence Time and Description (e.g., Host CPU usage is currently X%, continuously greater than threshold for N minutes). Supports filtering specific events through field queries.
Common Scenarios
Scenario: Quickly locate the most serious unprocessed alerts Click the Critical card in the level summary bar, and配合 the left status filter Alerting to narrow down to the highest priority alerts that are still ongoing.
Scenario: Confirm which objects are involved in the alert root cause Enter the Detection Data Tab, compare the line charts of multiple grouped objects to find the object that first showed a spike; then switch to the Event List to view the specific indicator values of each object when the alert was triggered, to help determine the scope of impact.
Notes
Switching to Table View allows you to see more key fields of multiple alerts at once (such as alert rules, resource domains), which is suitable for handling multiple alerts simultaneously; Card View shows the duration more intuitively, which is suitable for quickly scanning the current status. Batch operations are not currently supported on the card page
After manually closing an alert, the status becomes "Closed (Manual)" , which is different from the system automatically recovered "Recovered" status and does not mean the indicator has returned to the normal range. Before closing, please confirm the issue has been processed to avoid masking ongoing anomalies.
The alert list currently searches by update time, and the update time of alert data changes based on changes in status and level, so please pay attention to the time range of the time component when searching.
Empty notification records do not mean the alert was not triggered, only that no notification strategy was configured or the notification sending time has not yet arrived. You can confirm whether the rule is associated with a notification strategy through the Related Information Tab.
The page defaults to no automatic refresh . If you need to monitor alert dynamics in real time, click the refresh frequency setting in the upper right corner to enable timed automatic refresh.