Threshold Detection
Threshold detection alert rules are used for continuous monitoring of metric data. When metric values exceed set thresholds, they automatically trigger alerts and notify relevant personnel, enabling proactive operation and maintenance.
Quick Start
Step 1: Enter the Creation Page
Enter Smart Alert → Alert Rules, click New Alert Rule, select Threshold Detection type and enter the configuration page.
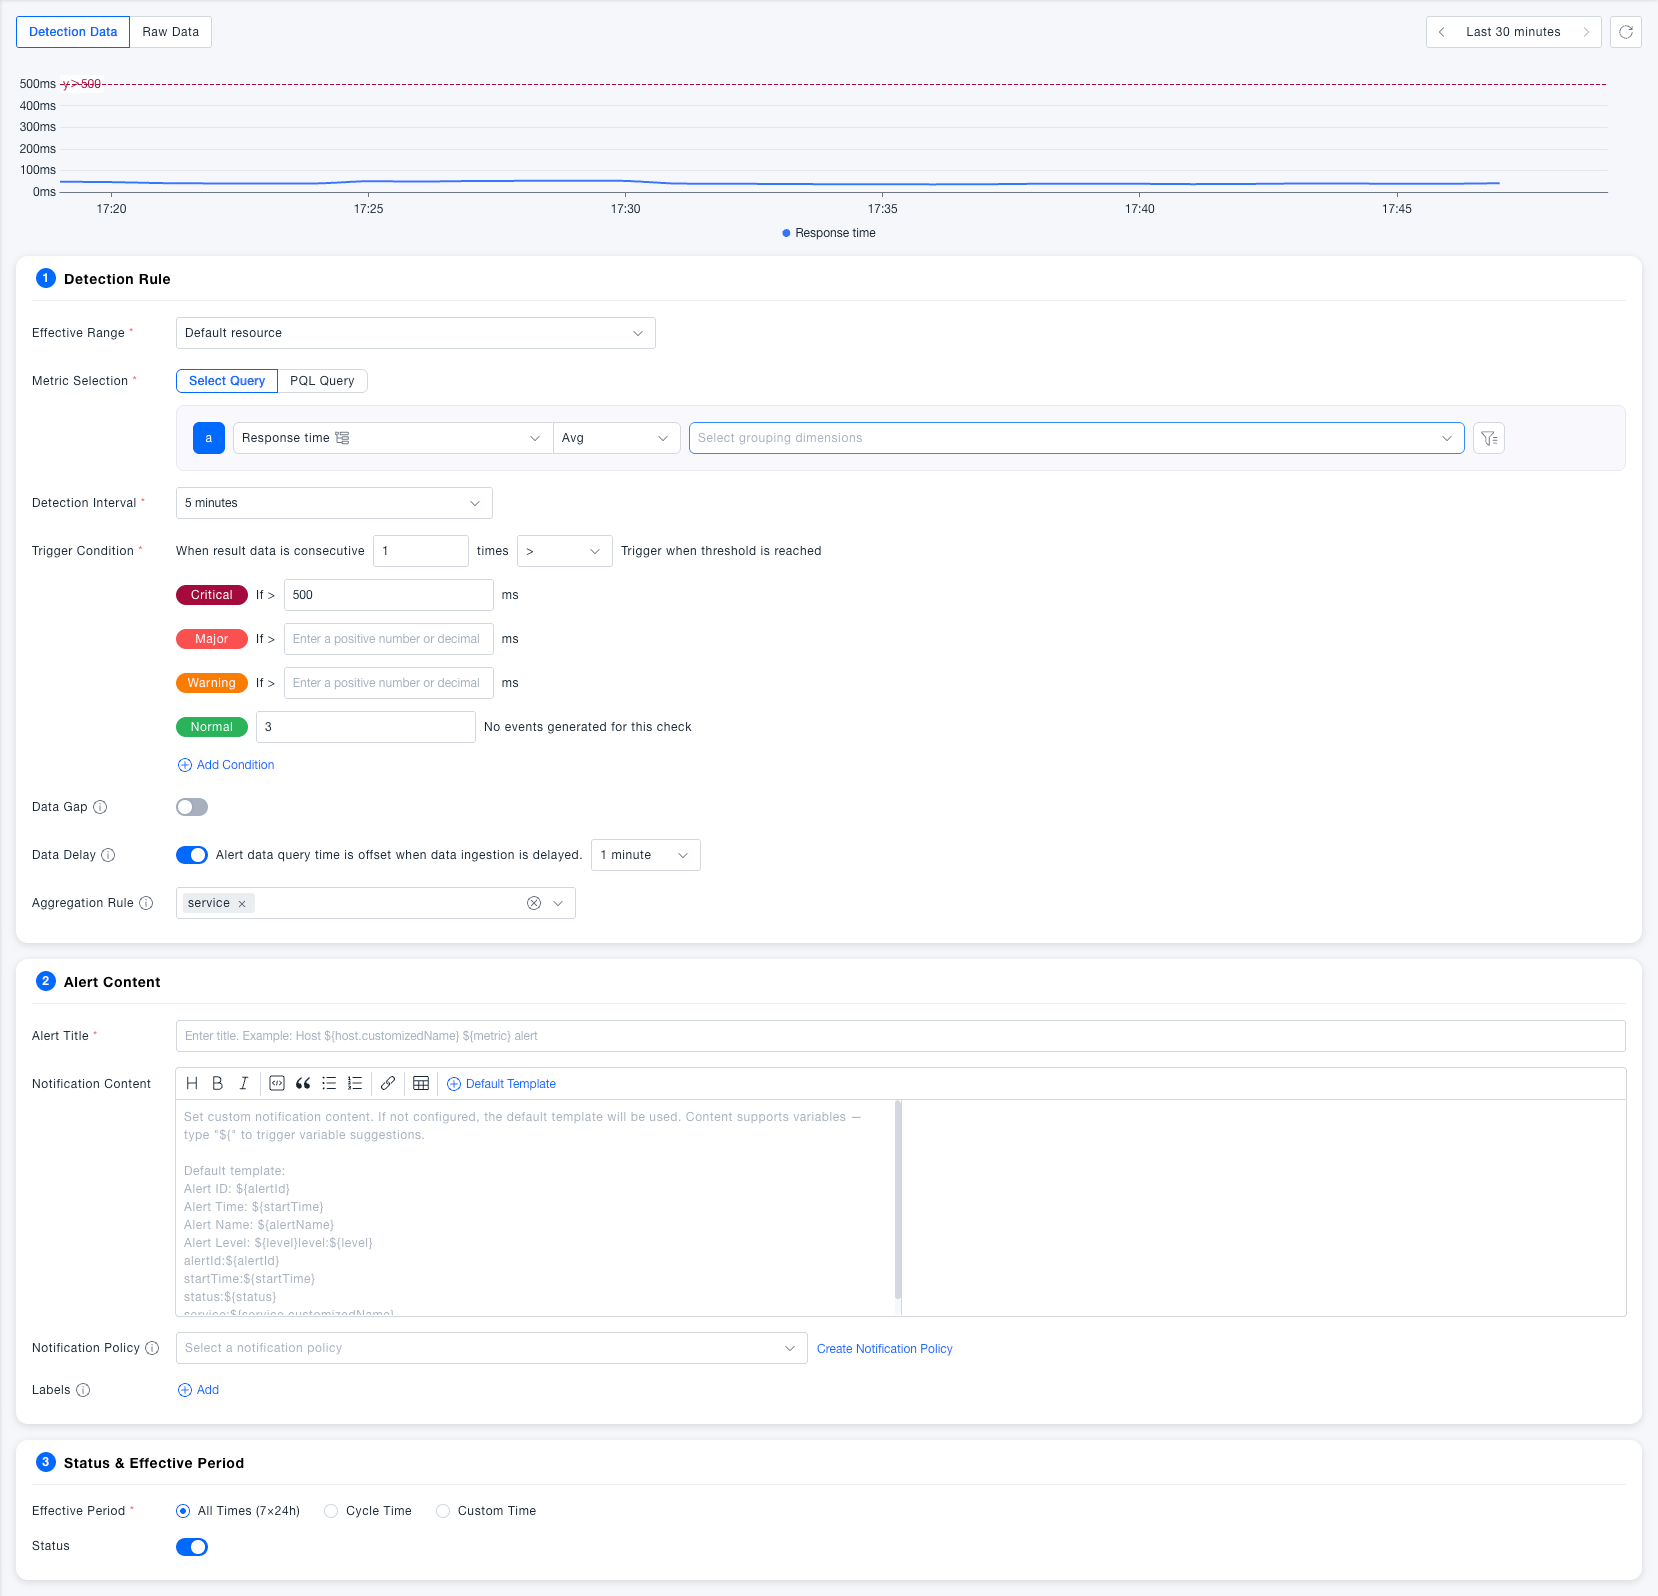
Step 2: Configure Detection Rules
- Select Effective Scope (resource domain, default empty, required. Select the resource domain that the current user has permission for)
- In Metric Selection, select the metric to monitor, such as CPU usage, set the aggregation method (such as latest value) and add grouping dimension (such as host)
- Set Detection Interval (such as 5 minutes, i.e., each detection will query 5 minutes of metric data)
- Configure Trigger Conditions: Fill in the number of consecutive times the result data exceeds the threshold, and fill in the corresponding thresholds for each alert level (Critical / Error / Warning)
- Configure Data Gap and Data Delay strategies as needed
Step 3: Fill in Alert Content and Save
- Fill in Alert Title (supports variables, such as
Host Name: ${host.customizedName}, IP Address: ${host.ipv4Address} ${metric} too high) - Fill in Notification Content as needed (supports rich text and variables)
- Select Notification Strategy
- Set Effective Time (All Time / Periodic Time / Custom Time)
- Click Save to complete creation
Feature Description
Detection Rules
Basic Configuration
| Field | Required | Description |
|---|---|---|
| Effective Scope | Yes | Select the resource domain to which the alert rule belongs, used to isolate alert configurations of different resource domains |
| Metric Selection | Yes | Supports two methods:Select Query and PQL Query |
| Aggregation Method | Yes | Aggregate data within the detection interval, such as latest value, average value, etc. |
| Grouping Dimension | No | Query and calculate separately by specified dimensions (such as host) |
| Detection Interval | Yes | Time window length for each data query, default 5 minutes |
Detection interval supports 1-30min, provides quick options and supports manual input
Trigger Conditions
| Field | Required | Description |
|---|---|---|
| Continuous Trigger Count | Yes | Trigger an alert only when the detection result exceeds the threshold for N consecutive times, avoiding false alarms caused by occasional glitches, default is 1 time |
| Comparison Method | Yes | Supports operators like >, >=, <, <=, = |
| Critical Threshold | No | Metric value exceeding this threshold triggers a critical level alert |
| Error Threshold | No | Metric value exceeding this threshold triggers an error level alert |
| Warning Threshold | No | Metric value exceeding this threshold triggers a warning level alert |
| Medium Threshold | No | Metric value exceeding this threshold triggers a medium level alert, this level is not displayed by default, can be added |
| Info Threshold | No | Metric value exceeding this threshold triggers an info level alert, this level is not displayed by default, can be added |
| Normal Recovery Count | Yes | When no events are generated for N consecutive detections, the alert status returns to normal, default 3 times |
Advanced Configuration
| Field | Required | Description |
|---|---|---|
| Data Gap | No | After enabling, when no data is reported within the specified time, the metric result is treated as 0 to participate in threshold judgment, preventing missed reports due to collection interruption. DefaultOff or enable data gap to trigger alerts of specified levels |
| Data Delay | No | After enabling, the query time window is moved forward by the specified duration to avoid missed reports due to long data links. DefaultEnabled, offset by 1 minute |
| Aggregation Rule | No | When there are multiple time series under the grouping dimension, define the aggregation granularity. Default aggregation by host, each host independently alerts; aggregation by network area, each network area generates an alert containing multiple hosts |
Alert Content
| Field | Required | Description |
|---|---|---|
| Alert Title | Yes | The title of the alert event, supports variables, such as ${host.customizedName}, ${metric}, it is recommended to include object and metric name for quick identification |
| Notification Content | No | The body of the alert notification, supports rich text editing and variable interpolation. |
| Notification Strategy | No | Select the notification channel and recipient configuration after the alert is triggered, if none can clickCreate Notification Strategy to create a new one |
| Labels | No | Tag alert rules for easy filtering and classification management |
It is recommended to use variables instead of fixed text for alert titles to quickly locate problems in the alert list.
When notification content is left blank, the system default template is used, which includes basic information such as alert ID, time, status, and level, meeting the needs of most scenarios.
Status & Effective Time
| Field | Required | Description |
|---|---|---|
| Effective Time | Yes | All Time (7×24 hours) : Always effective; Periodic Time : Set by workday/weekend cycle; Custom Time : Specify specific time periods to be effective |
| Start/Stop Status | Yes | Control whether the alert rule is running. After being closed, the rule pauses detection and does not generate alert events, defaultEnabled |
Common Scenarios
Scenario: Monitoring production server CPU continuous high load Select CPU usage metric, set grouping dimension as host, set critical threshold to 90%, error to 80%, continuous trigger count to 3, to avoid false alarms from short-term peaks.
Scenario: Reduce alert sensitivity during non-working hours Select Custom Time for effective time, configure it to be effective from 9:00-18:00 on workdays, and do not send notifications at other times to reduce night disturbances.
Scenario: Still able to alert when host collection is interrupted Enable Data Gap and treat gap results as 0, cooperating with threshold detection to ensure that alerts can also be triggered when the host Agent is abnormal, rather than being silent.
Notes
Modifying Detection Interval or Continuous Trigger Count will affect the response delay of alerts: the longer the interval and the more times, the longer the time from the occurrence of an anomaly to receiving a notification. Please set it reasonably according to business tolerance.