Event Detection
Event alert rules are used to define trigger conditions and notification strategies for event data, enabling automatic monitoring and alerting of abnormal events. Unlike log alerts, event alerts take structured events as detection objects, suitable for scenarios such as business operation records and system event streams.
Quick Start
Step 1: Enter the New Page
Enter Alert Rules, click New Alert Rule, select event detection type and enter the configuration page.
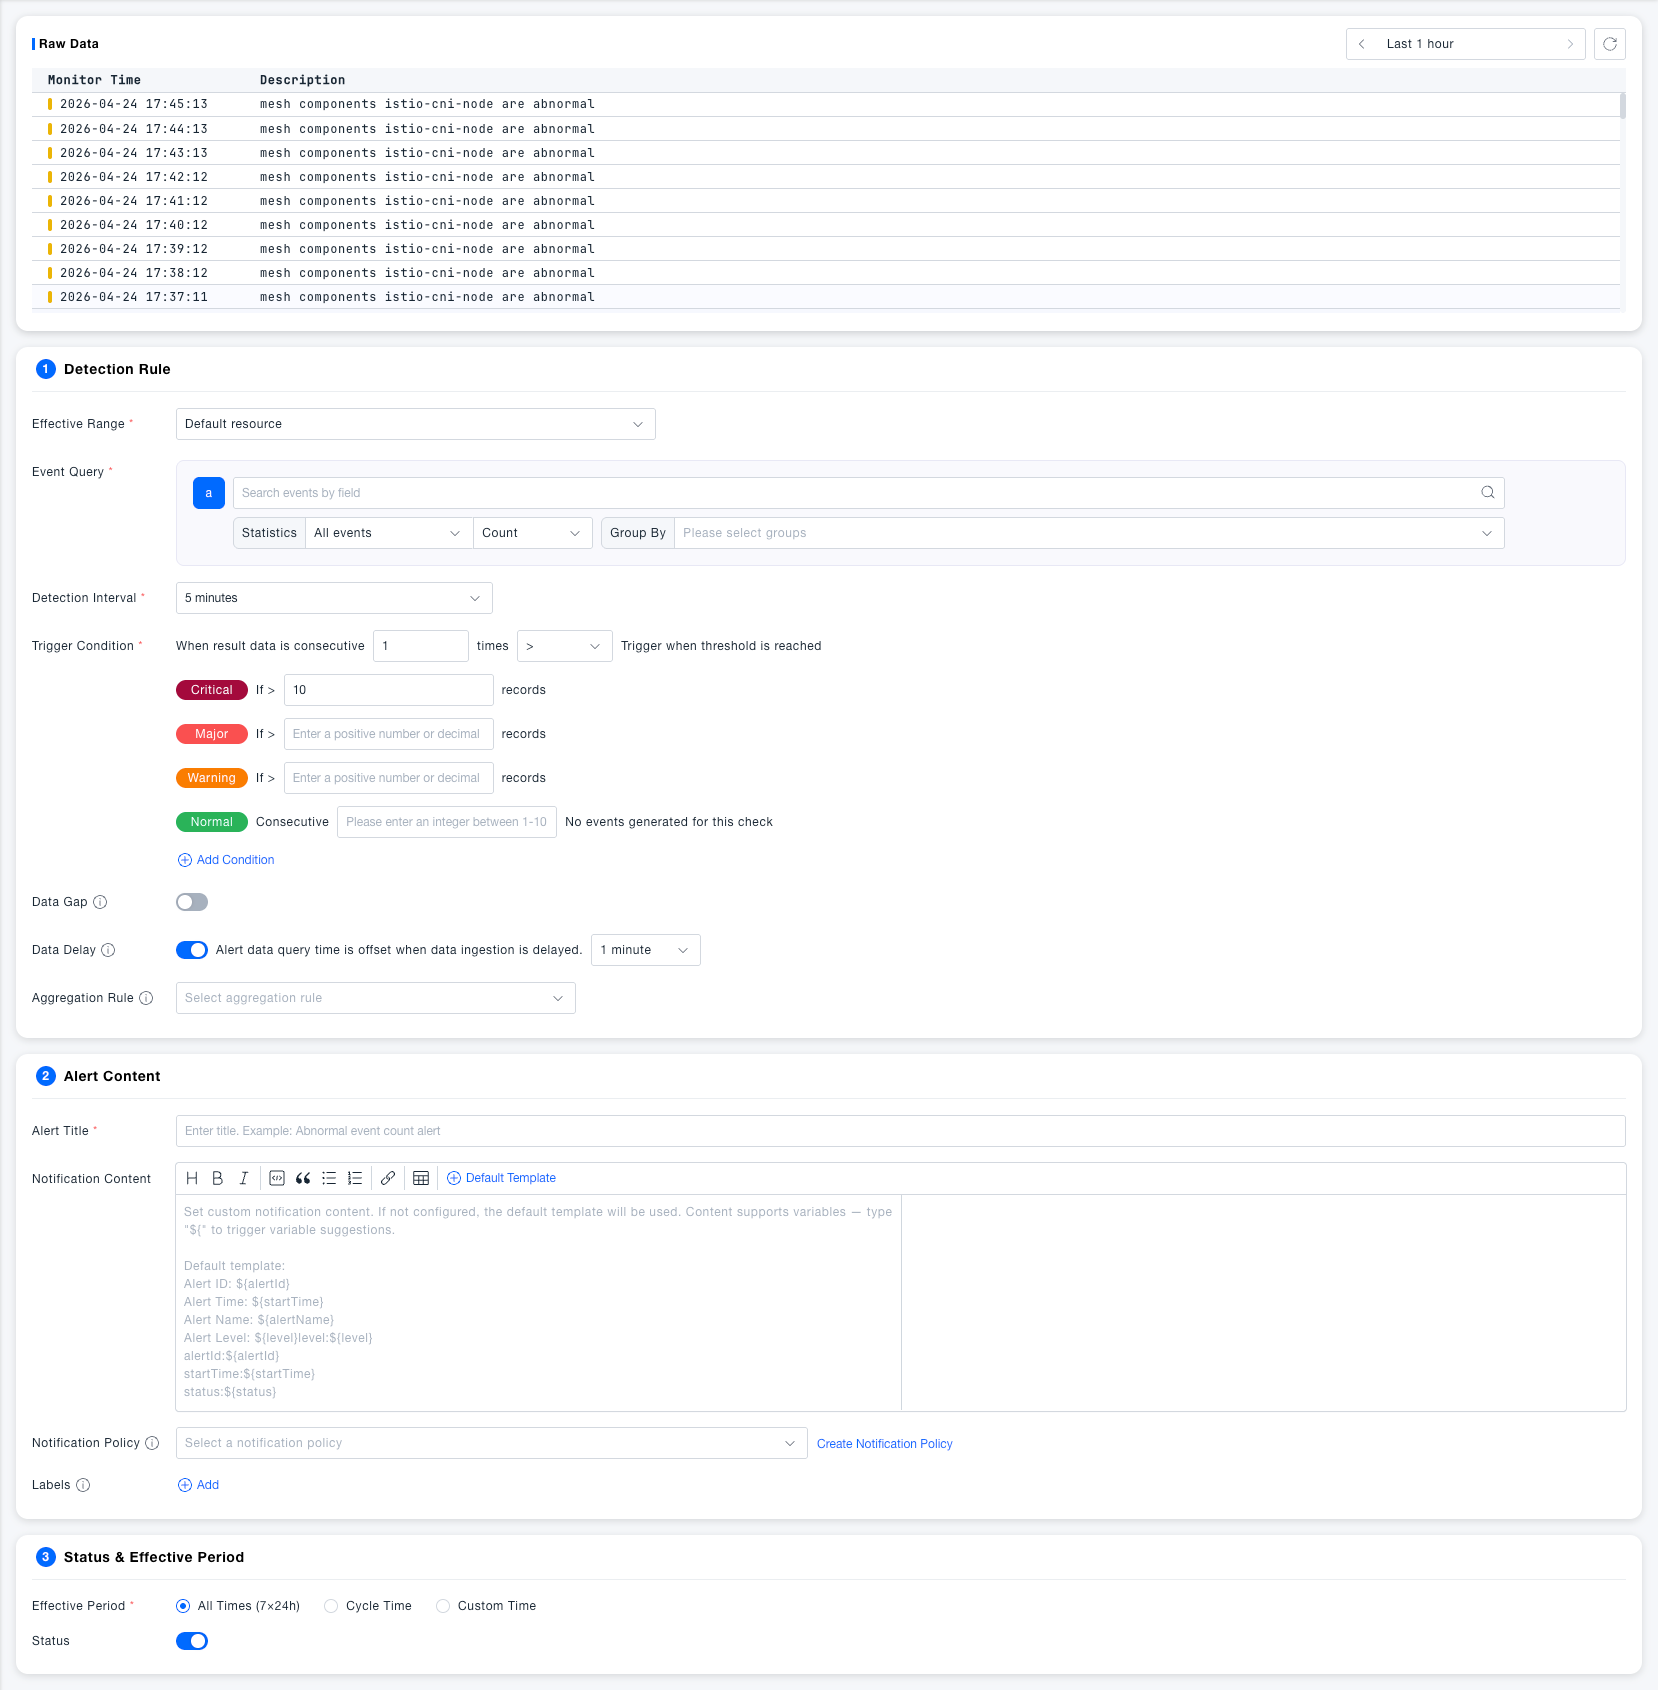
Step 2: Configure Detection Rules
- Select the resource domain in Effective Scope
- Enter fields and query conditions in Event Query to filter target events
- Set Statistics method (default: All Events / Count) and optional Grouping fields
- Select Detection Interval (default 5 minutes)
- Configure Trigger Conditions: Set continuous count and comparison method, fill in thresholds for each level
Step 3: Fill in Alert Content
- Fill in Alert Title, supports the use of variables
- Edit Notification Content as needed, or keep the default template
- Select Notification Strategy; if not created, click Create Notification Strategy
Step 4: Set Effective Time and Save
- Select Effective Time (default 7×24 hours full day)
- Confirm Start/Stop Status is enabled
- Click Save to complete creation; if you need to reuse, click Save to Custom Template
Feature Description
Detection Rules
Basic Configuration
| Field | Required | Description |
|---|---|---|
| Effective Scope | Yes | Select the resource domain monitored by this rule, the rule only applies to event data within the selected scope |
| Event Query | Yes | Enter fields and query statements to filter event data; query results are used as the original data for detection |
| Statistics | Yes | Aggregate query results; supports selectingGrouping Fields to split statistical results by dimension |
| Detection Interval | Yes | Time window traced back during each detection, default 5 minutes |
Trigger Conditions
| Field | Required | Description |
|---|---|---|
| Continuous Trigger Count | Yes | Only trigger an alert when the detection result meets the threshold condition forN consecutive times to filter false alarms caused by one-time jitter |
| Comparison Method | Yes | Supports operators like >, >=, <, <=, =, combined with thresholds to judge whether to trigger |
| Critical Threshold | No | If the result count meets the condition, generateCritical level alert |
| Error Threshold | No | If the result count meets the condition, generateError level alert |
| Warning Threshold | No | If the result count meets the condition, generateWarning level alert |
| Medium Threshold | No | Metric value exceeding this threshold triggers a medium level alert, this level is not displayed by default, can be added |
| Info Threshold | No | Metric value exceeding this threshold triggers an info level alert, this level is not displayed by default, can be added |
| Normal Recovery | No | After N consecutive detections with no events, the alert automatically returns toNormal state, default empty |
Advanced Configuration
| Field | Required | Description |
|---|---|---|
| Data Gap | No | After enabling, when there isno event data at all reported within the detection interval, it also triggers an alert, suitable for scenarios that must continuously generate events (such as heartbeat detection). Default Off |
| Data Delay | No | After enabling, the query time window is shifted back by the specified duration to avoid missed reports due to event data storage delay. DefaultEnabled, offset 1 minute |
| Aggregation Rule | No | When there are multiple time series under the grouping dimension, define the aggregation granularity. Default aggregation by host, each host independently alerts; aggregation by network area, each network area generates an alert containing multiple hosts |
Alert Content
| Field | Required | Description |
|---|---|---|
| Alert Title | Yes | The title displayed when the alert is triggered, supports dynamic filling using variables |
| Notification Content | No | The body sent to recipients, supports rich text editing and variable insertion. If not filled, the default template is used |
| Notification Strategy | No | Specify notification channels and recipients after the alert is triggered. When not configured, alerts are only recorded, not sent |
| Labels | No | Add custom labels to rules for easy classification, filtering, and batch management |
Grouping conditions will affect the variables configured in notifications, but the dimensions selected during grouping are the union of all event attributes, so when grouping is empty, variables in notification content cannot be replaced
Status & Effective Time
| Field | Required | Description |
|---|---|---|
| Effective Time | Yes | All Time (7×24 hours): The rule always runs; Periodic Time: Effective repeatedly by day of week; Custom Time: Specify specific time periods. Default All Time |
| Start/Stop Status | Yes | When enabled, the rule normally detects and generates alerts; when disabled, the rule pauses and does not generate any detection or notification. DefaultEnabled |
Common Scenarios
Scenario: Monitoring abnormal increase in critical operation events
Filter specific operation types (such as action:delete) in event query, select Count as the statistics method, set more than 100 within 5 minutes to trigger Warning, set continuous trigger count to 2 to avoid false alarms from short-term peaks.
Scenario: Heartbeat event interruption detection Enable the Data Gap switch to immediately trigger an alert when specified events completely stop reporting within the detection interval, ensuring the continuity of critical collection links or heartbeat tasks.
Scenario: Reduce alert thresholds during non-peak hours Set Effective Time to Custom Time, configure lower thresholds during low-traffic night periods, and manage alert strategies separately from business peak hours during the day.