Log Detection
Log alert rules are used to define when to trigger alerts for log data and who to notify . By configuring log query conditions, trigger thresholds, and notification strategies, automatic monitoring of log anomalies is achieved.
Quick Start
Step 1: Enter the New Page
Enter Alert Rules, click New Alert Rule, and enter the configuration page.
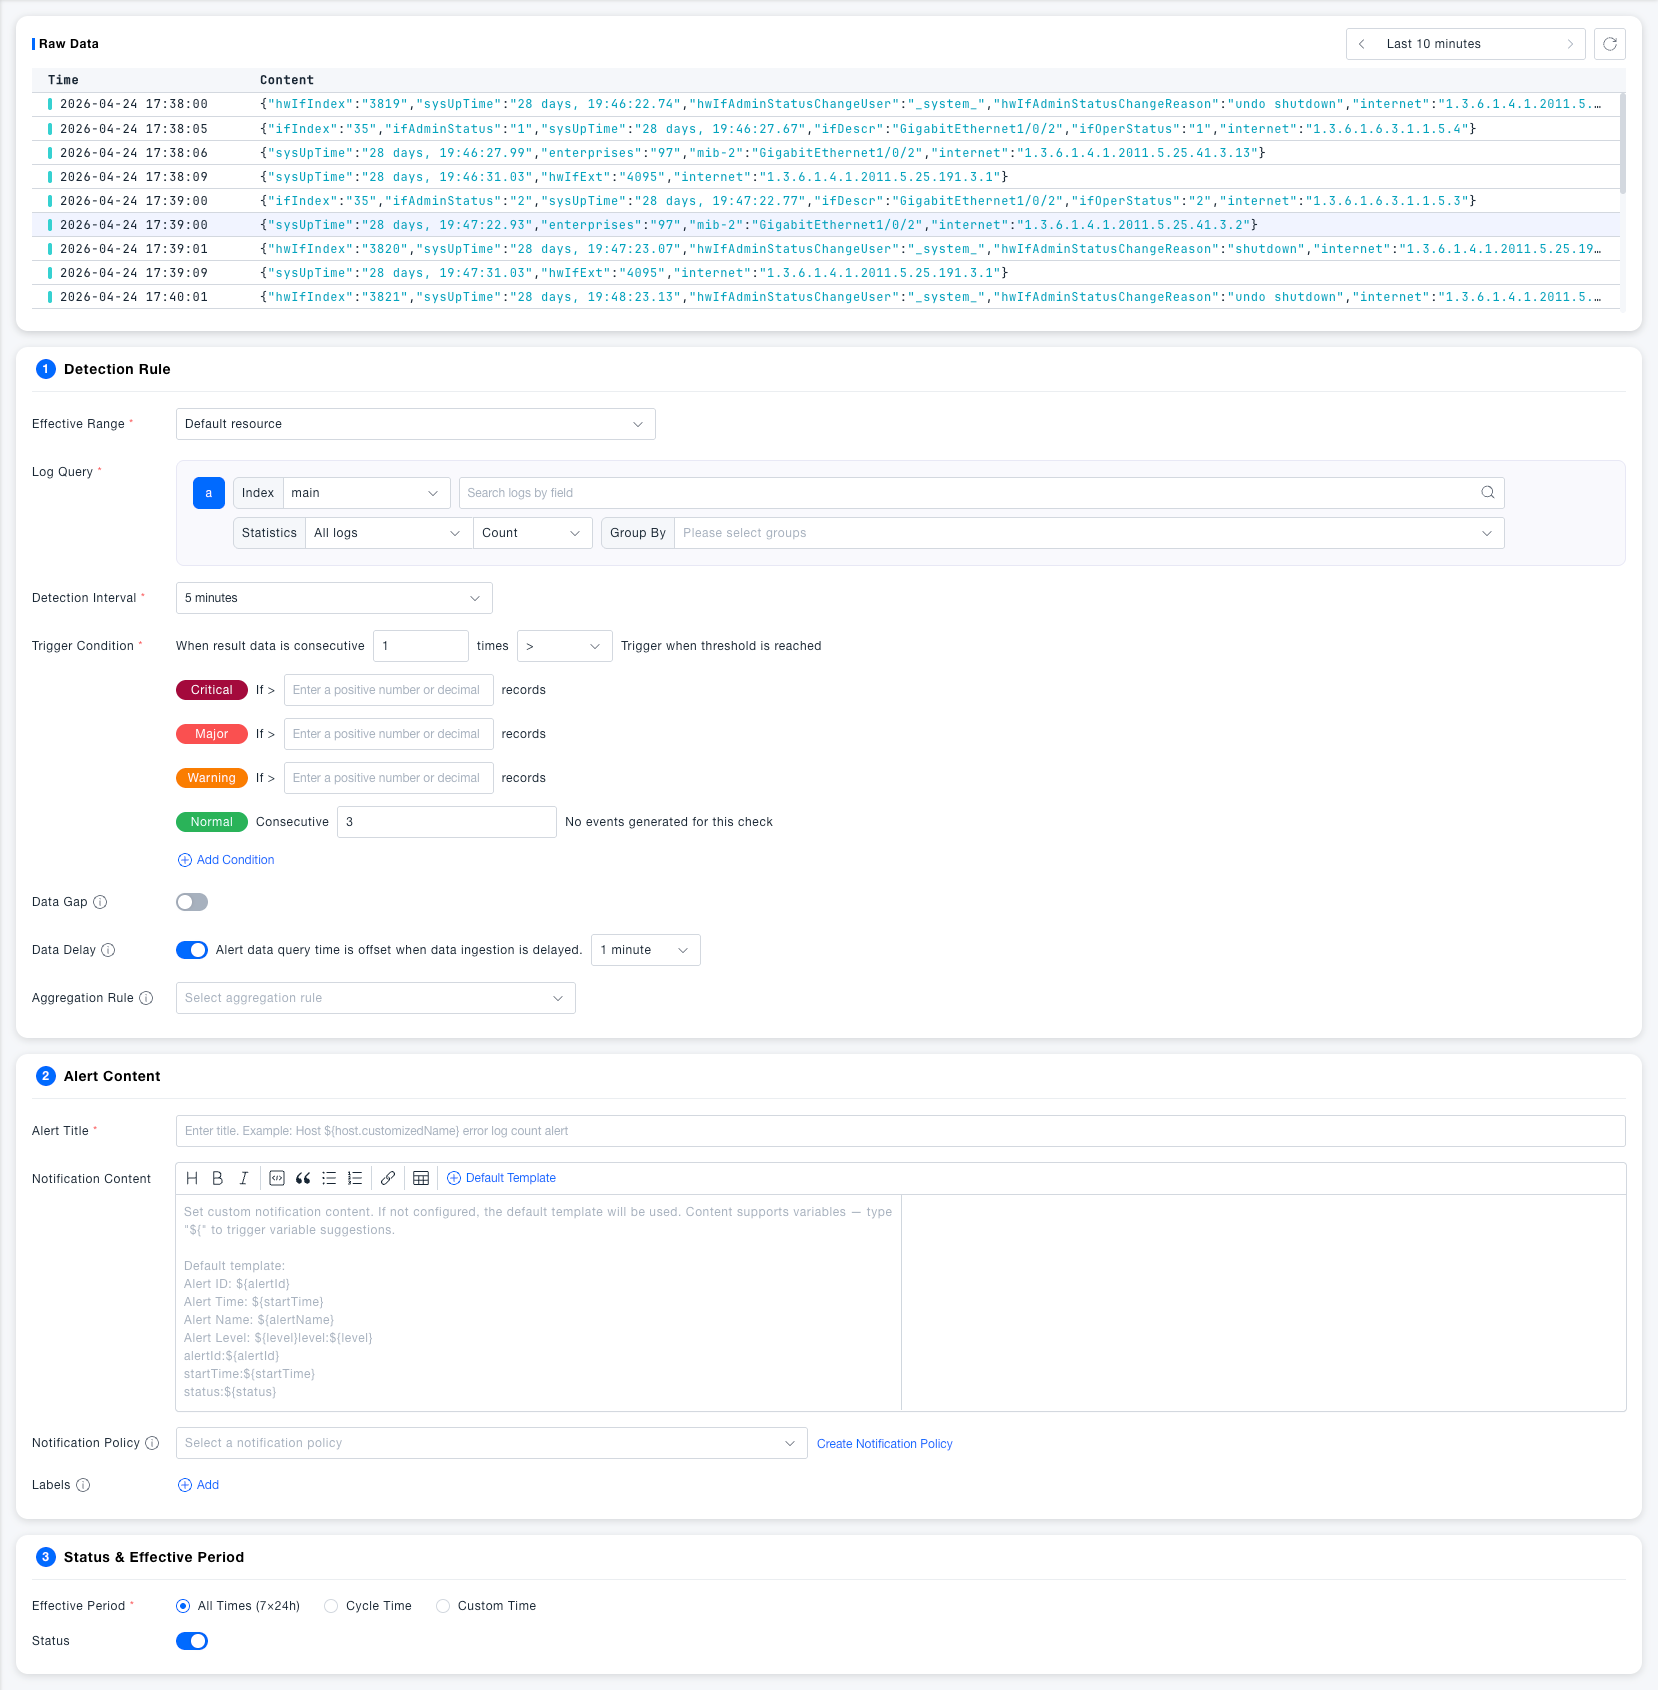
Step 2: Configure Detection Rules
- Select the resource domain in the Effective Scope dropdown
- In Log Query, select the index (such as
main), enter fields and query statements - Set Statistics method (default: All Logs / Count) and optional Grouping fields
- Select Detection Interval (default 5 minutes)
- Configure Trigger Conditions: Set continuous trigger count and comparison method, and fill in thresholds for each alert level
Step 3: Fill in Alert Content
- Fill in Alert Title, supports the use of variables
- Edit Notification Content as needed, or keep the default template
- Select Notification Strategy; if not created, click Create Notification Strategy to create a new one
Step 4: Set Effective Time and Save
- Select Effective Time (default 7×24 hours full day)
- Confirm Start/Stop Status is enabled
- Click Save to complete creation; if you need to reuse, click Save to Custom Template
Feature Description
Detection Rules
Basic Configuration
| Field | Required | Description |
|---|---|---|
| Effective Scope | Yes | Select the resource domain monitored by this rule, the rule only applies to logs within the selected scope |
| Log Query | Yes | Specify index and query statement, support field-level filtering; query results are used as the original data for detection |
| Statistics | Yes | Aggregate query results.All Logs only supports Count, other statistical dimensions support Distinct Count; supports selecting Grouping Fields to split statistics by dimension |
| Detection Interval | Yes | Time window traced back from the current time during each detection, default 5 minutes |
Trigger Conditions
| Field | Required | Description |
|---|---|---|
| Continuous Trigger Count | Yes | Only trigger an alert when the detection result meets the threshold condition forN consecutive times to avoid false alarms from occasional jitter |
| Comparison Method | Yes | Supports operators like >, >=, <, <=, = |
| Critical Threshold | No | If the result count > set value, generateCritical level alert |
| Error Threshold | No | If the result count > set value, generateError level alert |
| Warning Threshold | No | If the result count > set value, generateWarning level alert |
| Medium Threshold | No | Metric value exceeding this threshold triggers a medium level alert, this level is not displayed by default, can be added |
| Info Threshold | No | Metric value exceeding this threshold triggers an info level alert, this level is not displayed by default, can be added |
| Normal Recovery | No | After N consecutive detections with no events, the alert automatically returns toNormal state; default 3 times |
Advanced Configuration
| Field | Required | Description |
|---|---|---|
| Data Gap | No | After enabling, when there isno log data at all within the detection interval, it also triggers an alert; suitable for scenarios that must continuously report. Default Off or enable data gap to trigger alerts of specified levels |
| Data Delay | No | After enabling, the query time window is shifted back by the specified duration to avoid missed reports due to data storage delay. DefaultEnabled, offset 1 minute |
| Aggregation Rule | No | When there are multiple time series under the grouping dimension, define the aggregation granularity. Default aggregation by host, each host independently alerts; aggregation by network area, each network area generates an alert containing multiple hosts |
Alert Content
| Field | Required | Description |
|---|---|---|
| Alert Title | Yes | The title displayed when the alert is triggered, supports dynamic filling using variables |
| Notification Content | No | The body sent to recipients, supports rich text editing and variable insertion. If not filled, the default template is used |
| Notification Strategy | No | Specify who to notify and through which channel (such as DingTalk, email) after the alert is triggered. If not configured, alerts are only recorded and no notifications are sent |
| Labels | No | Add custom labels to rules for easy classification, filtering, and batch management |
Both alert title and notification content support variables. Common variables include ${alertId} (alert ID), ${startTime} (trigger time), ${alertName} (rule name), ${level} (alert level). You can enter ${ in the notification content editing box to see all variable prompts.
Status & Effective Time
| Field | Required | Description |
|---|---|---|
| Effective Time | Yes | All Time (7×24 hours): The rule always runs; Periodic Time: Effective repeatedly by day of week; Custom Time: Specify specific time periods. Default is All Time |
| Start/Stop Status | Yes | When enabled, the rule runs normally and generates alerts; when disabled, the rule pauses and does not generate any detection or notification. DefaultEnabled |
Common Scenarios
Scenario: Monitoring service error log surge
Filter level:error in log query, select Count as the statistics method, set count > 50 within 5 minutes to trigger Warning, > 200 to trigger Error, set continuous trigger count to 2 to avoid occasional false alarms.
Scenario: Critical log reporting interruption detection Enable the Data Gap switch to trigger an alert when logs completely stop reporting within the detection interval, suitable for collection links that need to ensure continuous reporting.
Scenario: Tighten alert thresholds during non-business peak hours Set Effective Time to Custom Time, configure a separate set of lower thresholds for low-traffic night periods, different from the normal fluctuation range during the day.