AI Adaptive
AI adaptive alerting automatically establishes metric baselines based on historical data and dynamically calculates normal fluctuation ranges, eliminating the need for manual fixed threshold settings. When metrics deviate from the baseline beyond a preset percentage, it triggers alerts, suitable for monitoring metrics with periodic fluctuation patterns (such as CPU usage, request volume, etc.).
Quick Start
Step 1: Enter the New Page
Enter Alert Rules, click New Alert Rule, select AI adaptive detection type and enter the configuration page.
Step 2: Configure Detection Rules
- Select the resource domain in Effective Scope
- In Metric Selection, select the metric to monitor, such as CPU usage, set the aggregation method (such as latest value) and add grouping dimension (such as host)
- Add Filter Conditions as needed (such as host name = specific host) to narrow the monitoring scope
- In Trigger Conditions, set the comparison method for the prediction data interval, and fill in the percentage thresholds for deviation from the baseline at each level
- Adjust the fluctuation tolerance multiple in Algorithm Configuration as needed
Step 3: Fill in Alert Content
- Fill in Alert Title, supports using variables like
${host.customizedName} - Edit Notification Content as needed, or keep the default template
- Select Notification Strategy; if not created, click Create Notification Strategy
Step 4: Set Effective Time and Save
- Select Effective Time (default 7×24 hours full day)
- Confirm Start/Stop Status is enabled
- Click Save to complete creation; if you need to reuse, click Save to Custom Template
Feature Description
Detection Rules
Basic Configuration
| Field | Required | Description |
|---|---|---|
| Effective Scope | Yes | Select the resource domain monitored by this rule, the rule only applies to data within the selected scope |
| Metric Selection | Yes | Select the monitored metric and aggregation method (such as average, maximum), and can precisely target monitoring objects (such as specific hosts) through filter conditions |
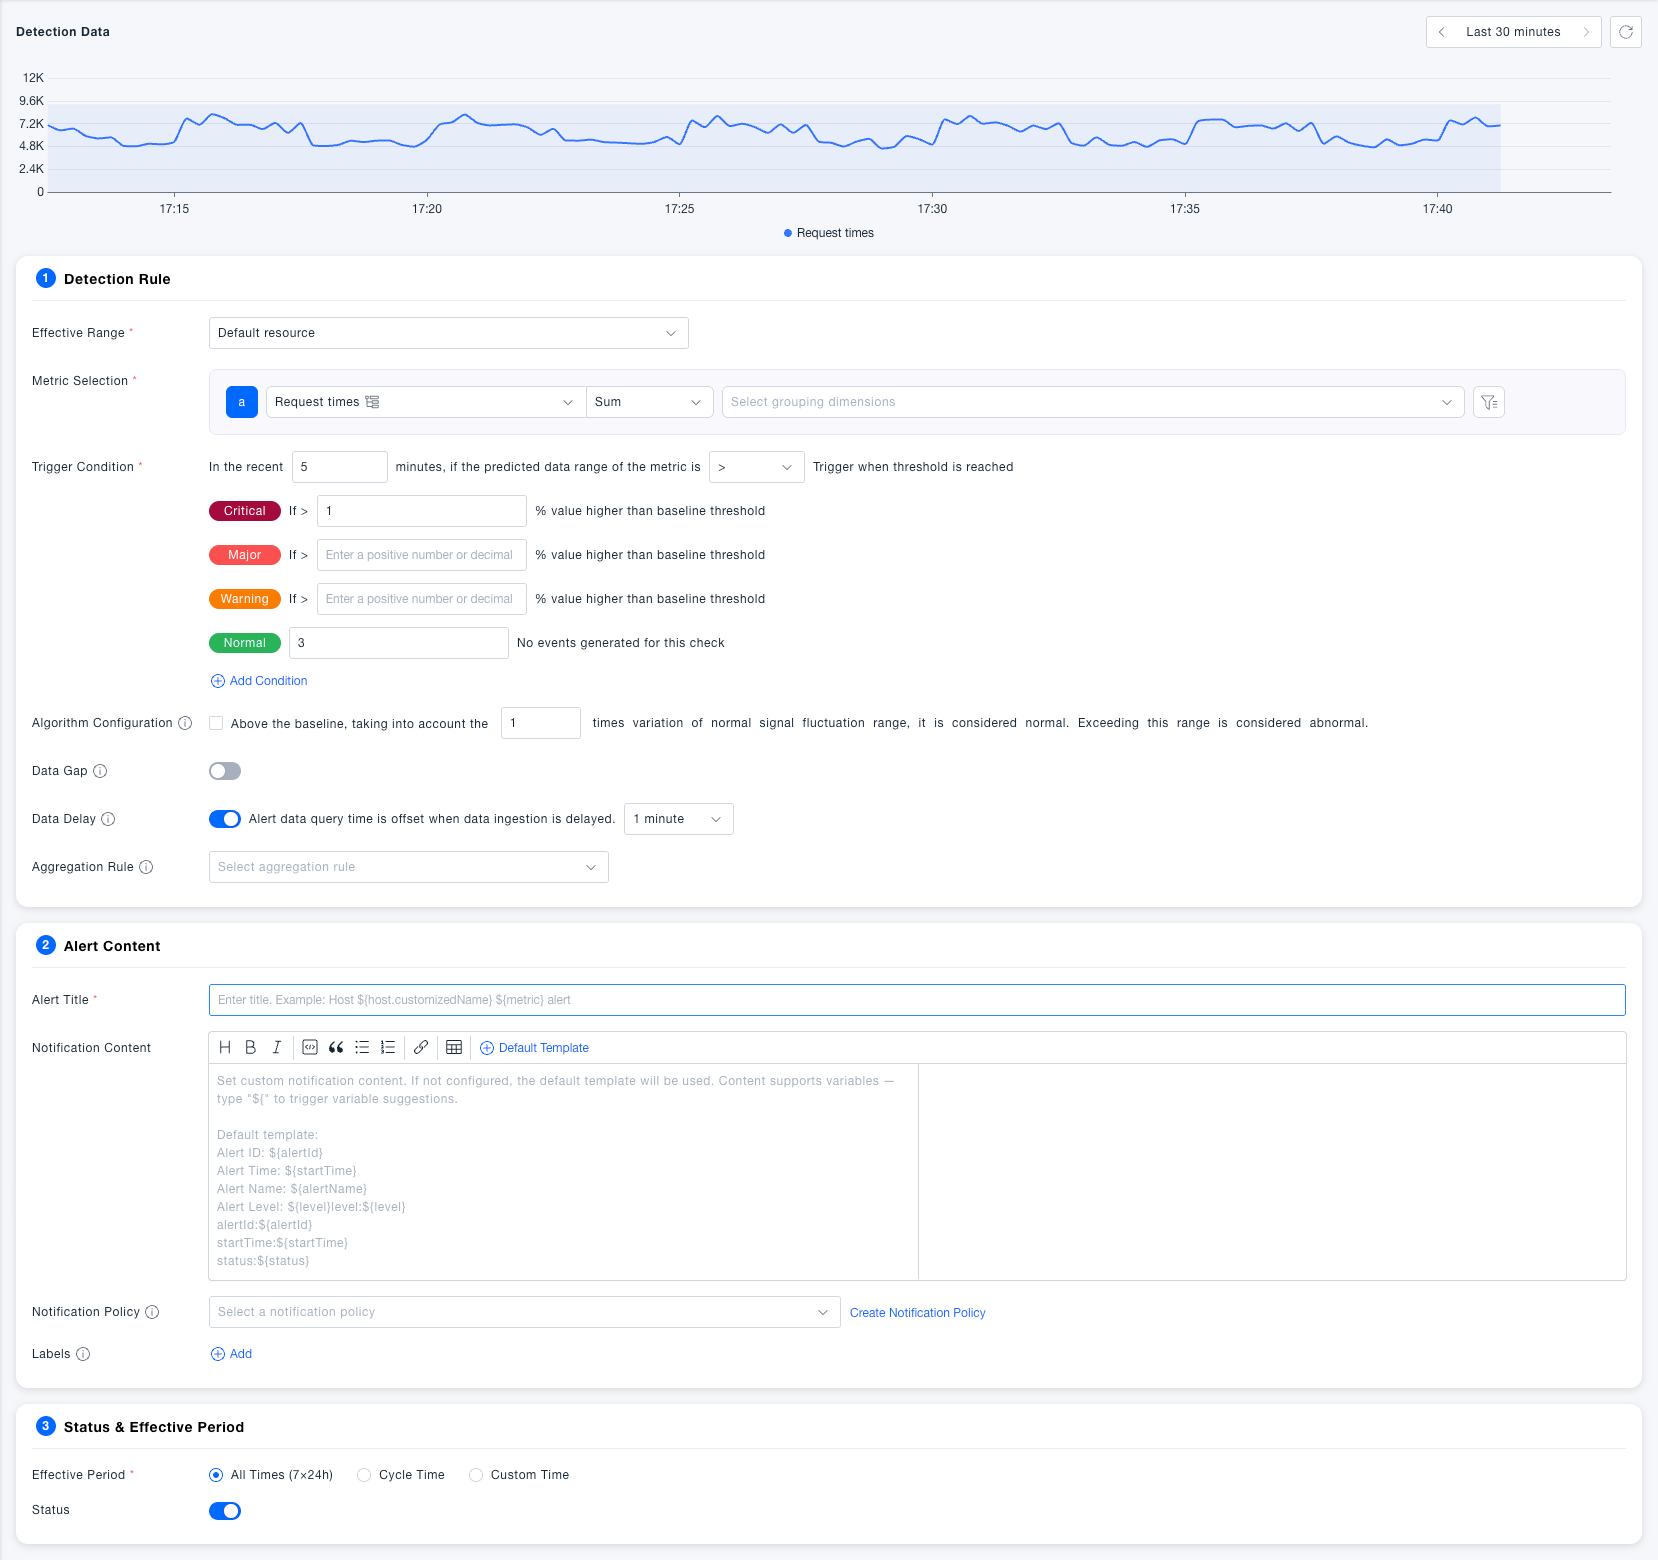
The Detection Data chart at the top of the page will display the historical trend of the selected metric in real time, as well as the baseline range calculated by AI (blue interval). It is recommended to confirm whether the baseline meets expectations through the chart before saving, to assist in calibrating threshold settings.
Trigger Conditions
In AI adaptive mode, the threshold is not a fixed value, but a deviation percentage relative to the AI baseline.
| Field | Required | Description |
|---|---|---|
| Prediction Interval Duration | Yes | Within the last N minutes, trigger if the predicted data interval of the metric meets the condition; determines the length of the detection time window |
| Comparison Method | Yes | Supports operators like >, <, etc., combined with deviation percentages at each level to judge whether to trigger |
| Critical Threshold | No | If the percentage of metric value higher than baseline threshold > set value, generateCritical level alert |
| Error Threshold | No | If the percentage of metric value higher than baseline threshold > set value, generateError level alert |
| Warning Threshold | No | If the percentage of metric value higher than baseline threshold > set value, generateWarning level alert |
| Normal Recovery | No | After N consecutive detections with no events, the alert automatically returns toNormal state, default 3 times |
Advanced Configuration
| Field | Required | Description |
|---|---|---|
| Algorithm Configuration | No | On top of the baseline, additionally tolerate changes within N times the normal signal fluctuation range. The larger the value, the more tolerant of glitches and fewer false alarms; the smaller the value, the more sensitive to anomalies. Default is 1 time |
| Data Gap | No | After enabling, when there isno metric data at all within the detection interval, it also triggers an alert, suitable for collection scenarios that must continuously report. Default Off |
| Data Delay | No | After enabling, the query time window is shifted back by the specified duration to avoid missed reports due to data storage delay. DefaultEnabled, offset 1 minute |
| Aggregation Rule | No | When there are multiple time series under the grouping dimension, define the aggregation granularity. Default aggregation by host, each host independently alerts; aggregation by network area, each network area generates an alert containing multiple hosts |
It is recommended to start with the default value of 1 for the fluctuation tolerance multiple in Algorithm Configuration, and gradually adjust based on actual alert conditions: increase appropriately if there are many false alarms, and decrease appropriately if there are many missed alarms.
Alert Content
| Field | Required | Description |
|---|---|---|
| Alert Title | Yes | The title displayed when the alert is triggered, supports dynamic filling using variables |
| Notification Content | No | The body sent to recipients, supports rich text editing and variable insertion. If not filled, the default template is used |
| Notification Strategy | No | Specify who to notify and through which channel after the alert is triggered. When not configured, alerts are only recorded, not sent |
| Labels | No | Add custom labels to rules for easy classification, filtering, and batch management |
Status & Effective Time
| Field | Required | Description |
|---|---|---|
| Effective Time | Yes | All Time (7×24 hours): The rule always runs; Periodic Time: Effective repeatedly by day of week; Custom Time: Specify specific time periods. Default All Time |
| Start/Stop Status | Yes | When enabled, the rule normally detects and generates alerts; when disabled, the rule pauses and does not generate any detection or notification. DefaultEnabled |
Common Scenarios
Scenario: CPU usage abnormal increase alert
Select CPU usage / Average value as the metric, specify target hosts through filter conditions, set trigger conditions to trigger Warning when above baseline by 30%, Error when above by 80%, and let AI automatically identify normal ranges for business peaks and valleys, eliminating the need to manually set different thresholds for day and night.
Scenario: Frequent false alarms for metrics with periodic fluctuations Appropriately increase the fluctuation tolerance multiple in Algorithm Configuration (such as from 1 to 2), allowing larger normal fluctuations without triggering alerts, reducing noise alerts caused by sudden but reasonable business traffic changes.
Scenario: Unified monitoring of similar metrics across multiple hosts Select multiple hosts in filter conditions, and set Aggregation Rule to aggregate by Host. The system will establish baselines for each host separately and trigger alerts independently, rather than mixing data from all hosts for calculation.
Notes
AI baseline relies on historical data . For metrics that have just started collecting recently and have insufficient data, the baseline may not be accurate. It is recommended to accumulate a certain amount of historical data before enabling AI adaptive rules, and use fixed threshold rules as a transition in the early stage.