Alert Rules
Alert rules are used to define when to trigger an alert, what level of alert to trigger, and who to notify. By configuring detection rules, alert content, and effective time, automatic monitoring and alerting for metrics, logs, and events is achieved.
Application Scenarios
- Metric Threshold Exceedance: Monitor host CPU, memory, disk and other metrics, and immediately alert when they exceed set thresholds
- Log Anomaly Surge: Detect whether the number of specific logs abnormally increases within a time window
- Event Change Perception: Trigger notifications when operations such as deployment and configuration changes occur to prevent failures caused by changes
- AI Predictive Warning: Predict future anomalies of metrics based on historical trends, and intervene in advance before problems occur
- AI Adaptive: Calculate metric boundaries based on historical data, eliminating the need for manual threshold setting
Quick Start
Enter Smart Alert → Alert Rules and click Create to complete the configuration in three steps.
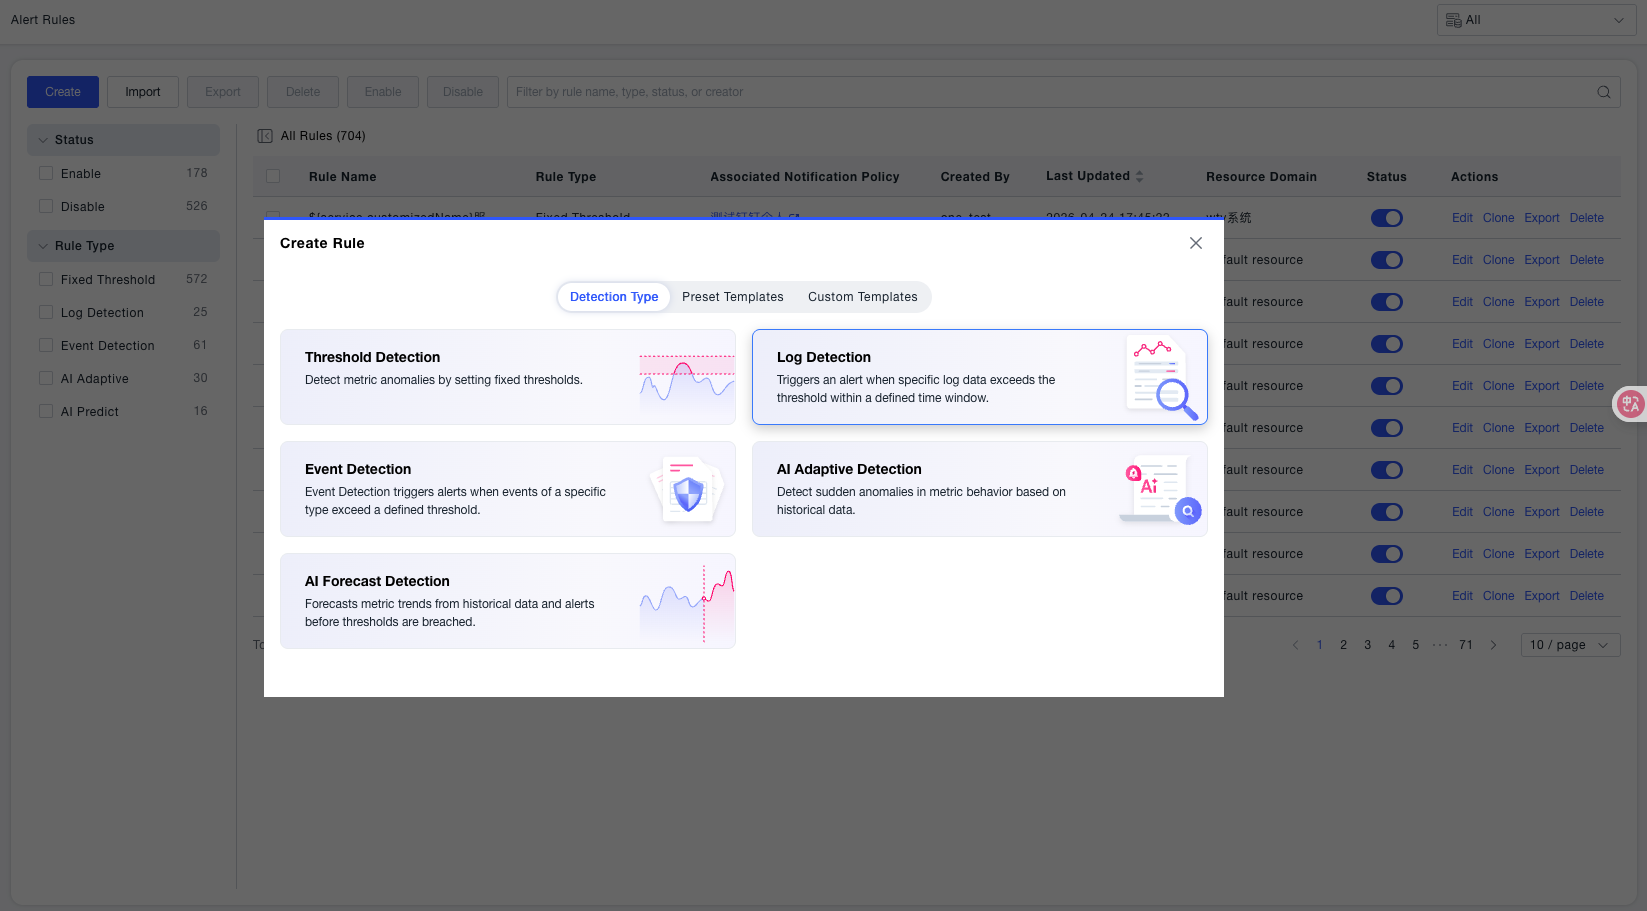
Step 1: Select Detection Type
Select the detection type in the pop-up window. Supports quick creation from Preset Templates or Custom Templates to reduce duplicate configuration.
| Type | Description |
|---|---|
| Threshold Detection | Alert when metric values exceed fixed thresholds, suitable for general monitoring such as CPU, memory, etc. |
| Log Detection | Detect the number of specific logs within a specified time period and alert when exceeding thresholds |
| Event Detection | Alert when specific events (such as deployment, changes) exceed thresholds |
| AI Adaptive | Automatically identify sudden anomalies based on historical data, no need to manually set thresholds |
| AI Forecast | Predict future metric values based on historical trends, and alertbefore exceeding thresholds |
Detection type cannot be modified after saving. If you need to change it, it is recommended to clone the original rule and reconfigure.
Step 2: Configure Detection Rules
Effective Scope (Required): Select the resource domain to which this rule belongs. The rule only takes effect on data within this resource domain.
Metric Selection (Required): Supports two methods:
- Select Query: Default visualized metric selection, suitable for regular monitoring
- PQL Query: Custom query statements, suitable for complex conditions
Detection Interval (Required): Time window for each round of detection, default 5 minutes.
The shorter the window, the more sensitive the alert, but occasional jitter is also more likely to trigger false alarms. It is recommended to select an appropriate detection interval based on metric stability.
Trigger Conditions (Required): Set to trigger an alert only when the detection results meet the conditions for N consecutive times.
- N > 1 can effectively filter out occasional jitter and avoid false alarms
- Set thresholds for three levels:
Critical,Error, andWarningfrom high to low severity - After N consecutive times without alerts, the status automatically returns to
Normal
Step 3: Fill in Alert Content and Save
Alert Title (Required): Supports the use of variables, which are automatically replaced with actual values when the alert is triggered.
For example: Host Name: ${host.customizedName}, IP Address: ${host.ipv4Address} ${metric} too high
Final effect: Host Name: apm-01, IP Address: 192.0.0.1 CPU usage too high
Notification Content (Optional): Customize notification body, supports rich text and variables:
If not filled, the system default template will be used, which includes all the above fields.
Notification Strategy (Optional): Specify alert strategy and match notification methods, recipients, etc.
When the notification strategy is empty, alerts will still be generated, but no notifications will be sent to any channel. If you need to receive notifications, please confirm that you have associated a notification strategy, or go to the [Notification Strategy] page to create and associate it after saving.
Effective Time (Required): Select the effective time period of the rule. The rule does not trigger detection during non-effective time periods. Default is 7x24 hours effective.
When the effective time is set to "Periodic Time" or "Custom Time", please confirm that the expected monitoring period has been covered to avoid missed detection.
Start/Stop Status: Enabled by default when creating. After being disabled, the rule pauses detection, the configuration is completely retained, and it can be re-enabled at any time.
After confirming the configuration, click Save.
Rule Management
Enter Smart Alert → Alert Rules to view all rules under the current resource domain. Supports filtering by start/stop status and rule type, and searching by name, type, status, and creator.
Each rule supports the following operations:
| Operation | Description |
|---|---|
| Edit | Modify rule configuration |
| Clone | Copy the current rule, suitable for quickly creating similar rules |
| Export | Export the rule as a file, which can be imported into other environments for reuse |
| Delete | Permanently delete the rule |
| Enable / Disable | Temporarily close the rule, no alerts are generated but configuration is retained |
Common Scenarios
Scenario: Monitoring host CPU continues to be too high
Select threshold detection, select CPU usage as the metric, set 3 consecutive times exceeding 90% to trigger a critical alert, and bind the on-duty group notification strategy.
Scenario: Temporarily block alerts during maintenance
Turn off the start/stop status of the target rule in the rule list, and re-enable it after maintenance ends. The configuration is completely retained, no need to re-fill.
Scenario: Quickly reuse existing rules
Click Clone of the target rule, and only modify key parameters (such as thresholds, metrics) after generating a copy, no need to configure from scratch.