User Sessions
User sessions integrates users' full range of operational behaviors across multiple devices. Using the "Session" as the core analytical dimension, it comprehensively tracks and analyzes user navigation paths and interaction logic across different contexts such as browsers, mobile applications, and MiniPrograms. This enables deep insights into users' genuine usage patterns and behavioral preferences.
For details on session definition and identification, refer to User Session.
Usage Scenarios
- Resolving User Feedback: When users report application issues to support or technical teams with vague descriptions, analyzing session details and replays allows for precise reconstruction of the problem scenario. It helps understand the specific context, triggering steps, and surrounding information, enabling support teams to quickly identify the issue and take action, avoiding back-and-forth communication and speeding up confirmation and resolution.
- Optimizing Product User Experience: By watching session replays, product teams can visually observe user navigation paths, interactions, and behaviors like "furious clicking" during freezes or confusion. This helps pinpoint exact moments and locations of poor experience, identify obstacles users encounter, and uncover potential design flaws for targeted optimization.
- Assisting Developer Troubleshooting: Developers can use session details and replays to examine the specific environment, user action sequence, and generated error logs at the time a bug occurred. Correlating this with user actions allows for more accurate root cause identification, especially for hard-to-reproduce issues, effectively reducing debug time and improving fix efficiency.
- Enabling Cross-Team Collaboration: When discussing and resolving product issues, miscommunication between product, technical, and support teams can lead to inefficiency. The session replay functionality provides all team members with a unified, fact-based perspective, fostering smoother, more accurate collaboration and decision-making.
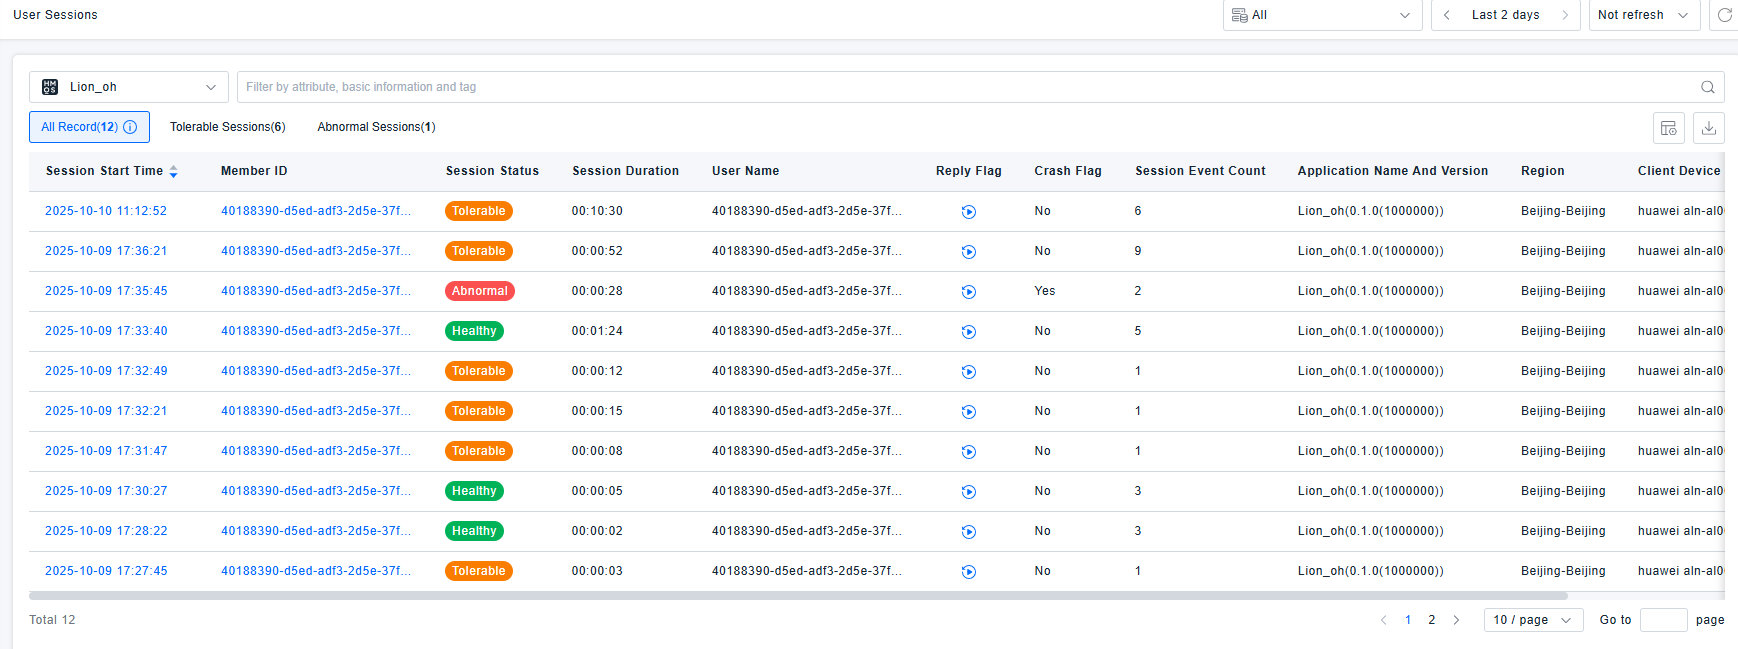
Session List
Displays a list of all sessions that occurred within the selected time range, filtered by application. Sessions can be filtered by attributes, basic information, and tags. Supports customizing visible columns and exporting data. Session status is categorized as Normal, Tolerable, or Abnormal, based on evaluation rules detailed in Health Analysis.
Querying is limited to a maximum of 500 sessions from the last 14 days.
Session Details
Displays user information, session start time, application name, region, device model, access method, operating system, device IP, session health rating, along with session duration, number of views, action count, number of fatal issues, and number of error issues.
- Action Count includes: clicks or XHR actions.
- Fatal Issues include: Crashes, Lags, ANRs, Page Load Errors.
- Error Issues include: JS Errors, Console Errors, Business Exceptions, Blocking Actions, Failed Requests, Custom Protocol Request Failures.
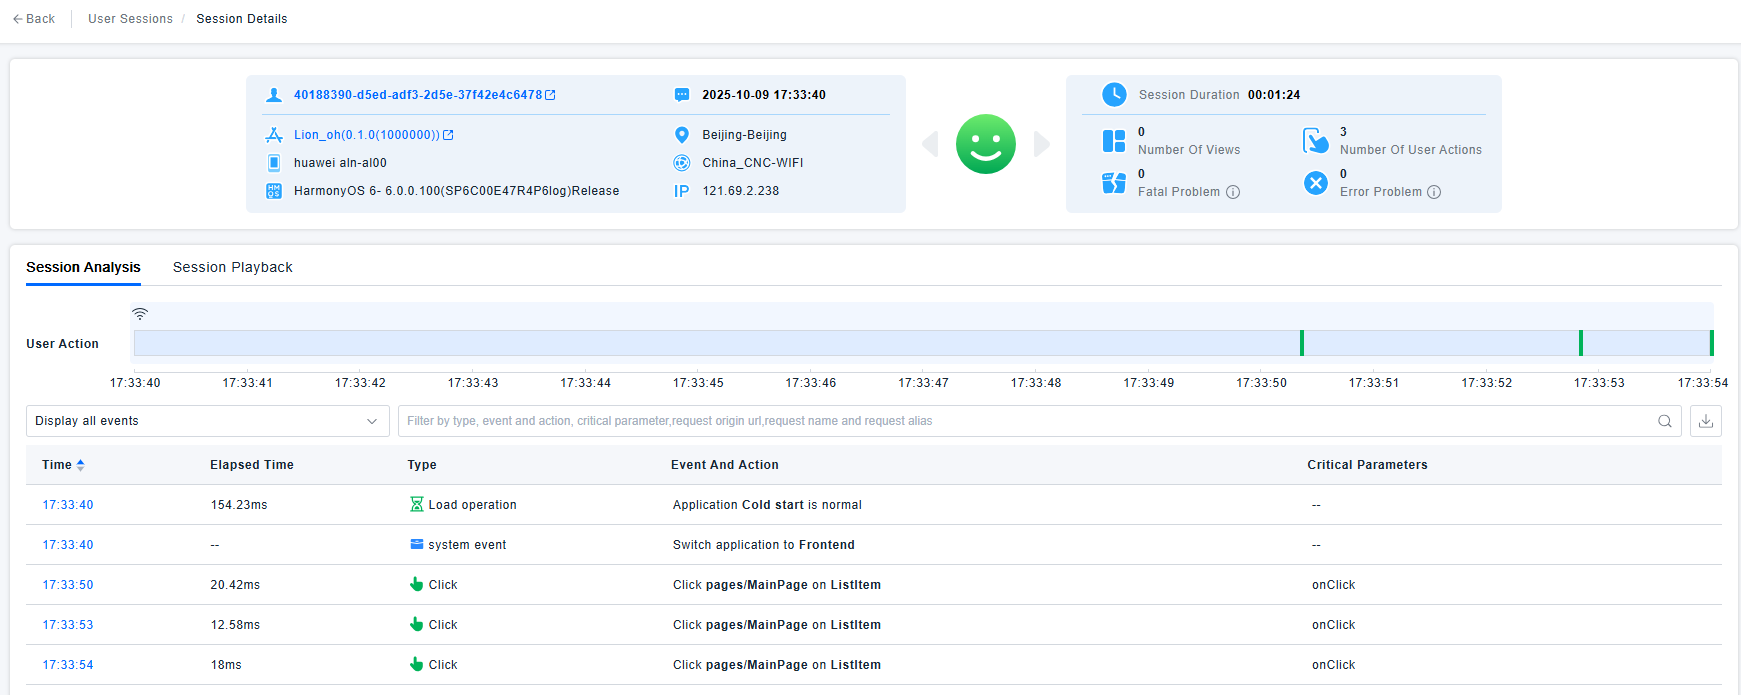
Event Analysis
The navigation bar clearly shows the user's action path. It aggregates events triggered by user actions, starting from each action. It includes highlighting logic: if an action caused a problematic event, the navigation bar is colored based on severity—yellow for tolerable slowness-related issues, red for abnormal issues. Allows quick navigation from the bar to problematic events in the list.
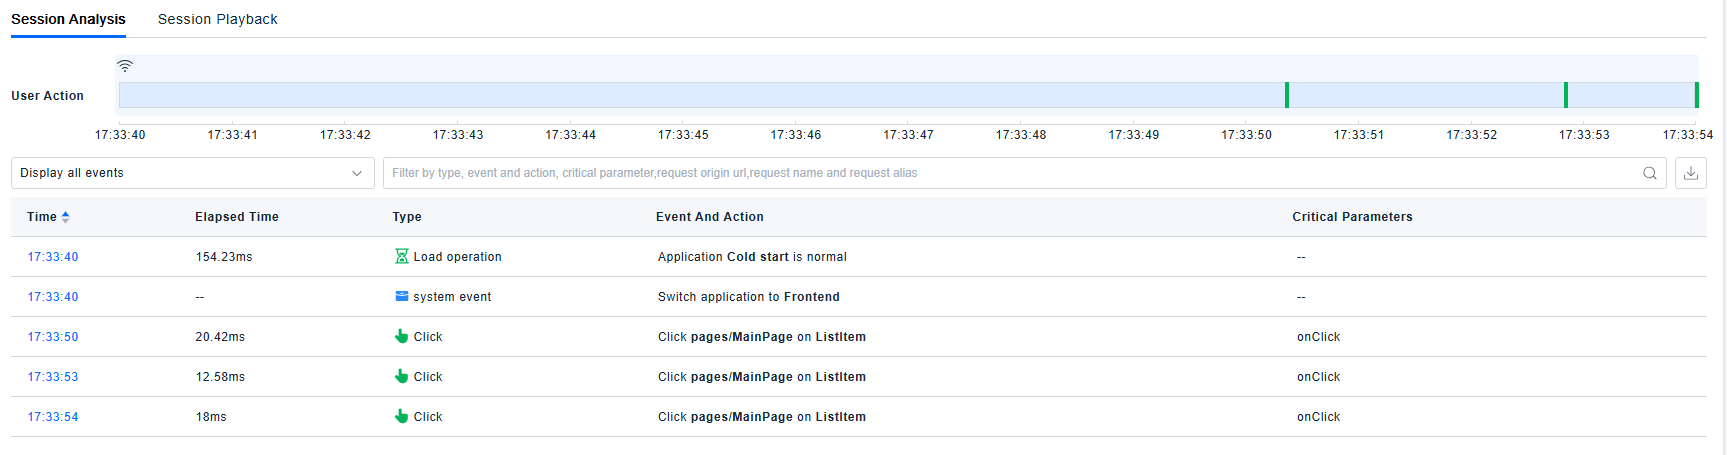
The time series chart supports zooming by sliding to select a time range. Hovering over color blocks displays corresponding events, and clicking "Position to this event" will scroll down to the corresponding event.

The search box supports filtering by type, event/action, key parameters, original request URL, request name, and request alias. Pressing Enter, clicking a blank area, or clicking the search button initiates a search that locates but does not filter out data.
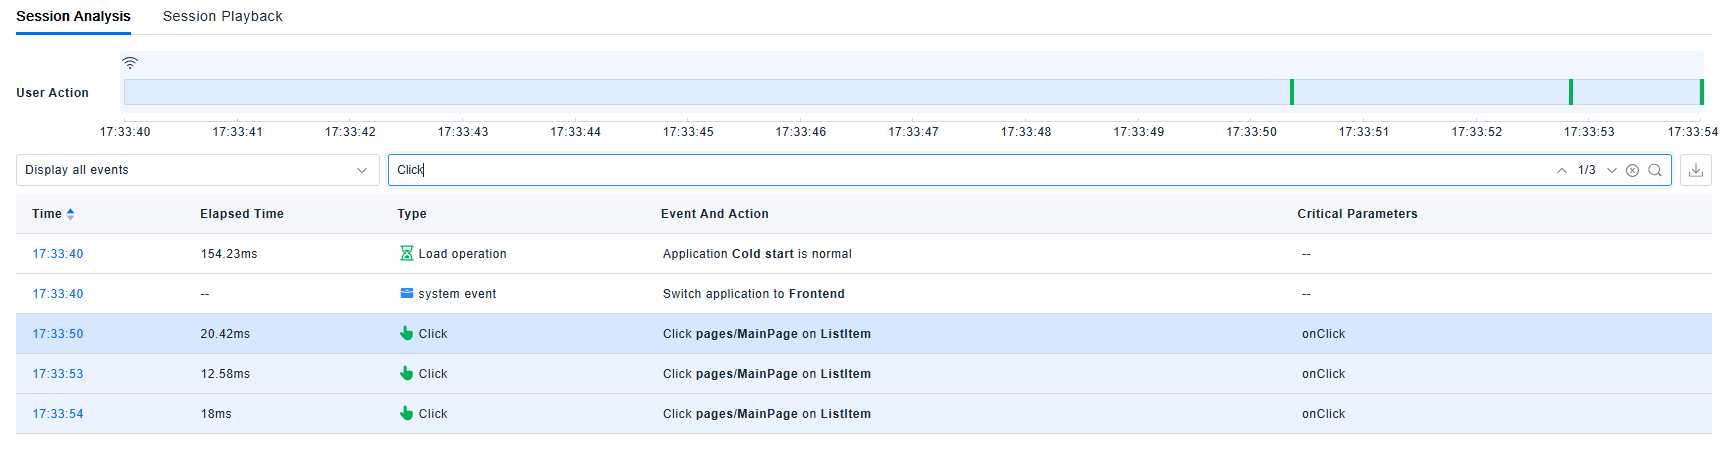
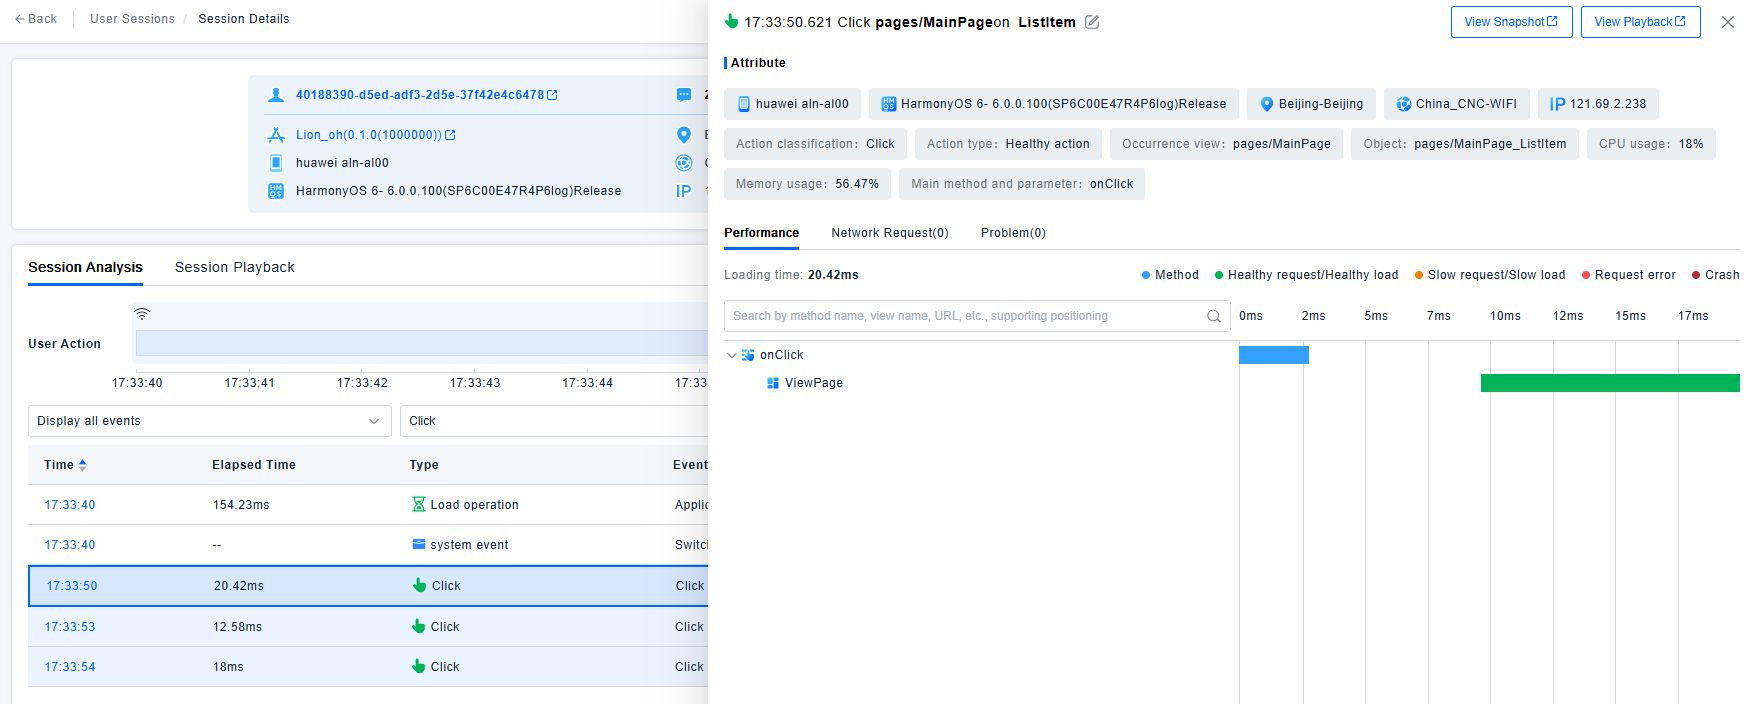
Clicking on an individual session event opens a drawer displaying the specific event's attributes and content related to the current event.
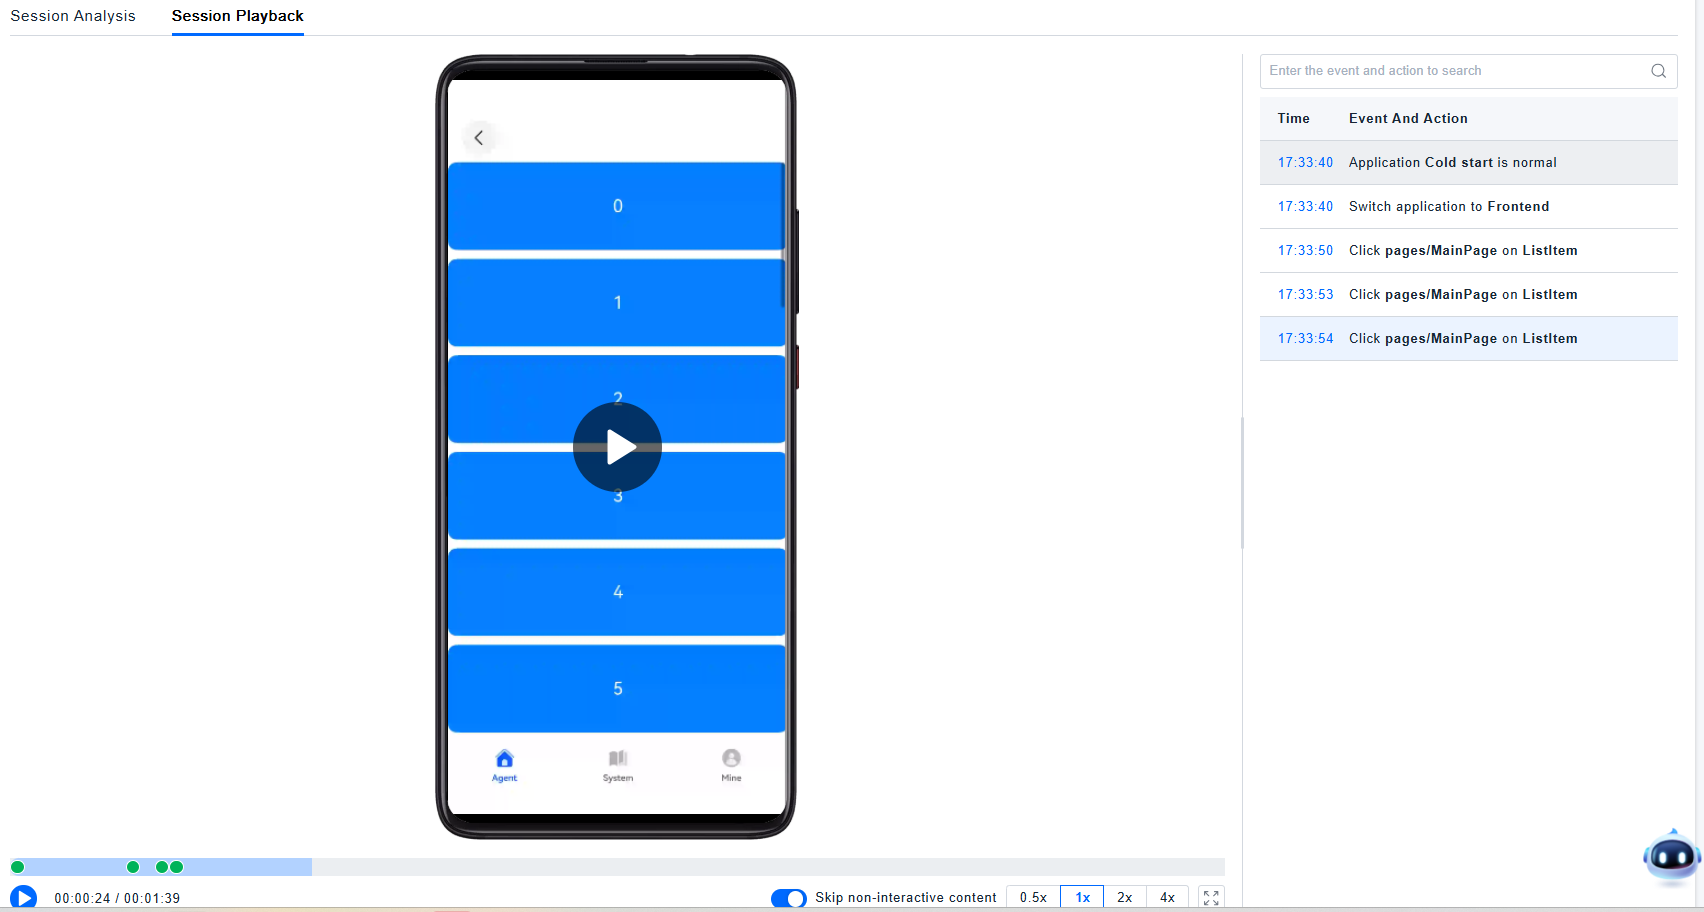
Session Replay
The Session Replay tab on the Session Details page is displayed only if a Session Replay License is purchased, session replay collection is enabled, and the session meets the collection criteria. Session replay collection rules are detailed in Data Collection.
The Session Replay page is divided into three areas. The bottom-left area is the video playback window. Above the playback window is the control panel (containing the progress bar, play/pause button, "Skip inactivity" toggle, and playback speed selector). The right side displays the list of events and actions for this session.
General Interaction:
- During playback, the progress bar, video area, and the "Events & Actions" list on the right are synchronized.
- For convenient review, the progress bar is annotated with markers for all "Events & Actions" and "Issues" in the session. Normal events are indicated by green dots, problematic events by red dots.
- Supports full-screen mode and zoom. In full-screen mode, only the video playback area and controls are displayed.
- The "Skip inactivity" button is enabled by default; skipped periods are fast-forwarded on the progress bar.
- Supports playback speeds of 0.5x, 1x, 2x, and 4x; default is 1x.
- The "Events & Actions" list on the right supports fuzzy search by event/action name. Pressing Enter or clicking the search button performs the search and pauses playback.