Requests
Network Request Analysis is one of the core modules. Its primary value lies in tracing, from the "real user's perspective," all network requests (e.g., API calls, resource loading) initiated by users during their interaction with a product (such as an APP, MiniProgram, or Web). By quantifying request performance, pinpointing anomalies, and analyzing request context, it provides data support for optimizing user experience and enhancing system stability.
For details on the definition of network requests, identification rules, and request types, please refer to Network Request.
Usage Scenarios
- Post-Launch Monitoring for New Features: After launching a new feature (e.g., payment process, homepage redesign), monitor the success rate and latency of related interfaces in real-time. If a sudden increase in 5xx error rates or a doubling of latency is detected, quick rollback or fixes can be initiated to prevent impact on a large number of users.
- User Complaint Attribution: For user feedback like "order placement failed" or "blank page," query the corresponding request logs using User ID / Session ID. If "payment interface timeout" is identified, collaborate with backend teams to investigate the stability of the payment service.
- Performance Optimization Validation: After implementing optimizations (e.g., interface caching, CDN acceleration for static resources), use RUM to compare request latency and error rates before and after the optimization to verify effectiveness.
- Version Iteration Comparison: Compare network request metrics (e.g., Version V2.1 vs. V2.2) across different APP/Web versions to determine if a new version introduces network performance regressions (e.g., surge in request volume or increased latency due to new features).
Getting Started
Business Request
Business Request analysis consists of four parts: Domain List, Domain Details, Business Request Details, and Request Record Details.
Business Request Domain List
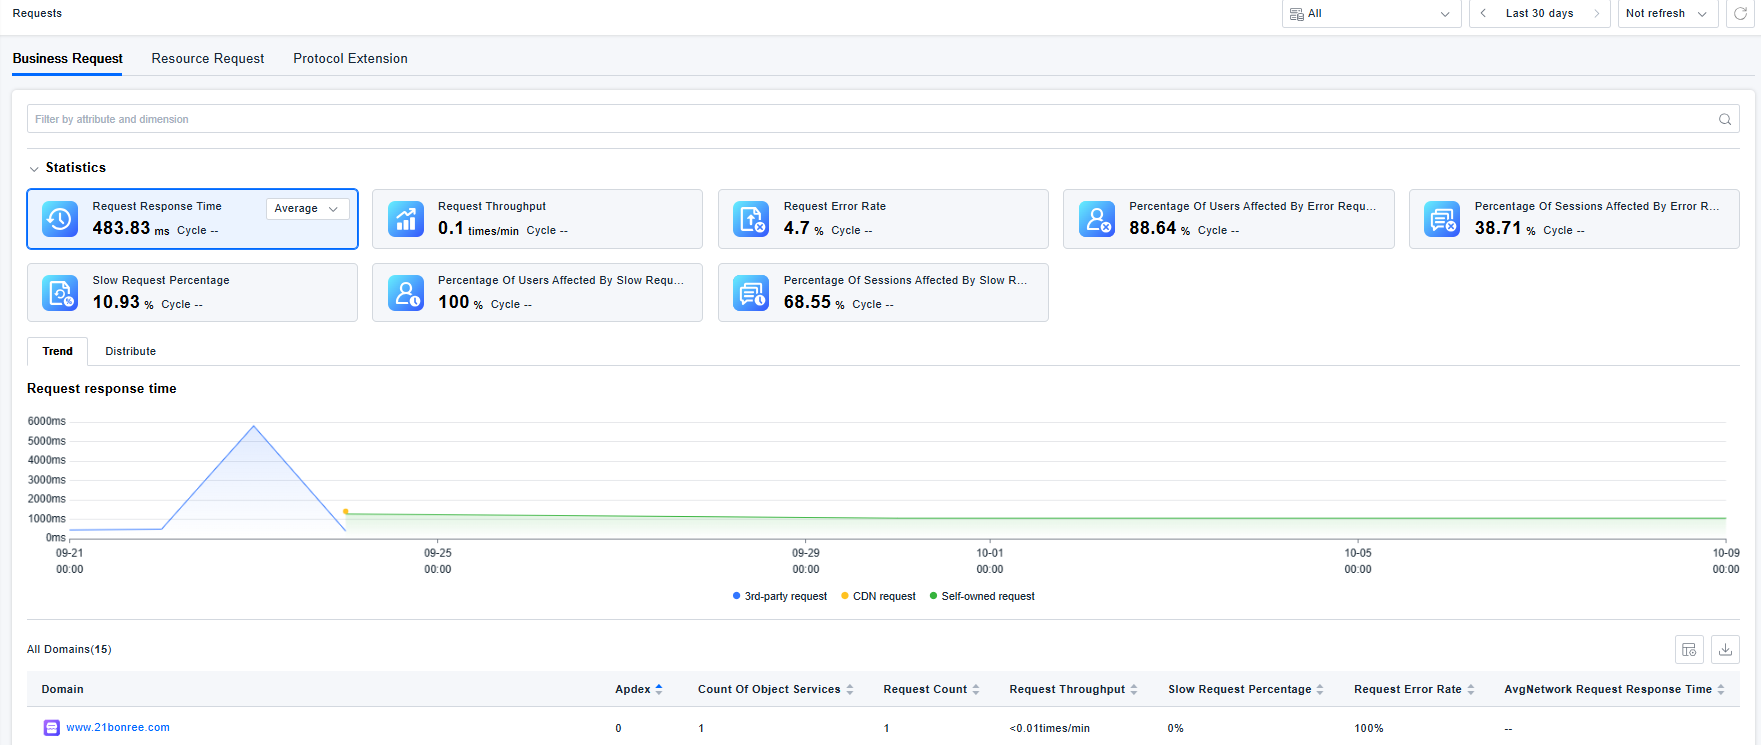
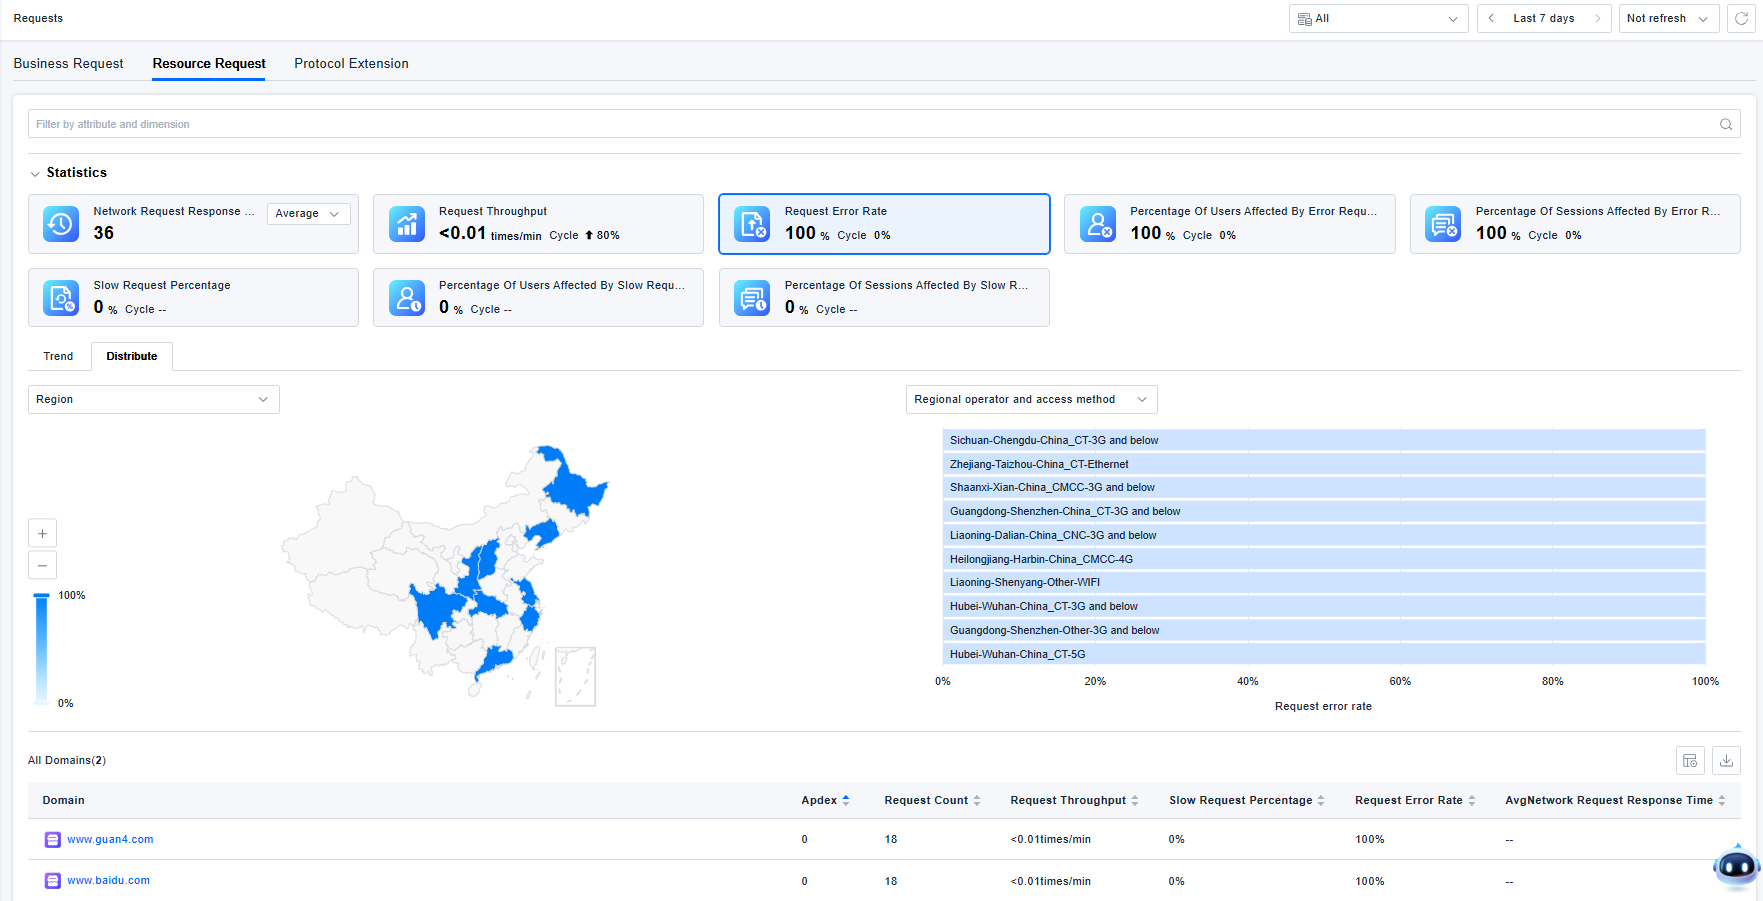
Displays all domain information collected by the ONE platform, including statistics, filtering options, and a list. You can filter by attributes and dimensions.
Response times are grouped and counted based on Owned requests, CDN requests, and Third-party requests to clarify the source of issues.
Trend Chart Interaction: Click and drag to select a specific time range on the trend chart; the global time selector in the top right will update, changing the view to the selected period.
Distribution Chart Interaction: Click on a segment in a distribution chart (e.g., click "Beijing" on the map, or "v1.0.1" under Application Version) to add that dimension as a filter condition, enabling drill-down analysis.

Business Request Domain Details
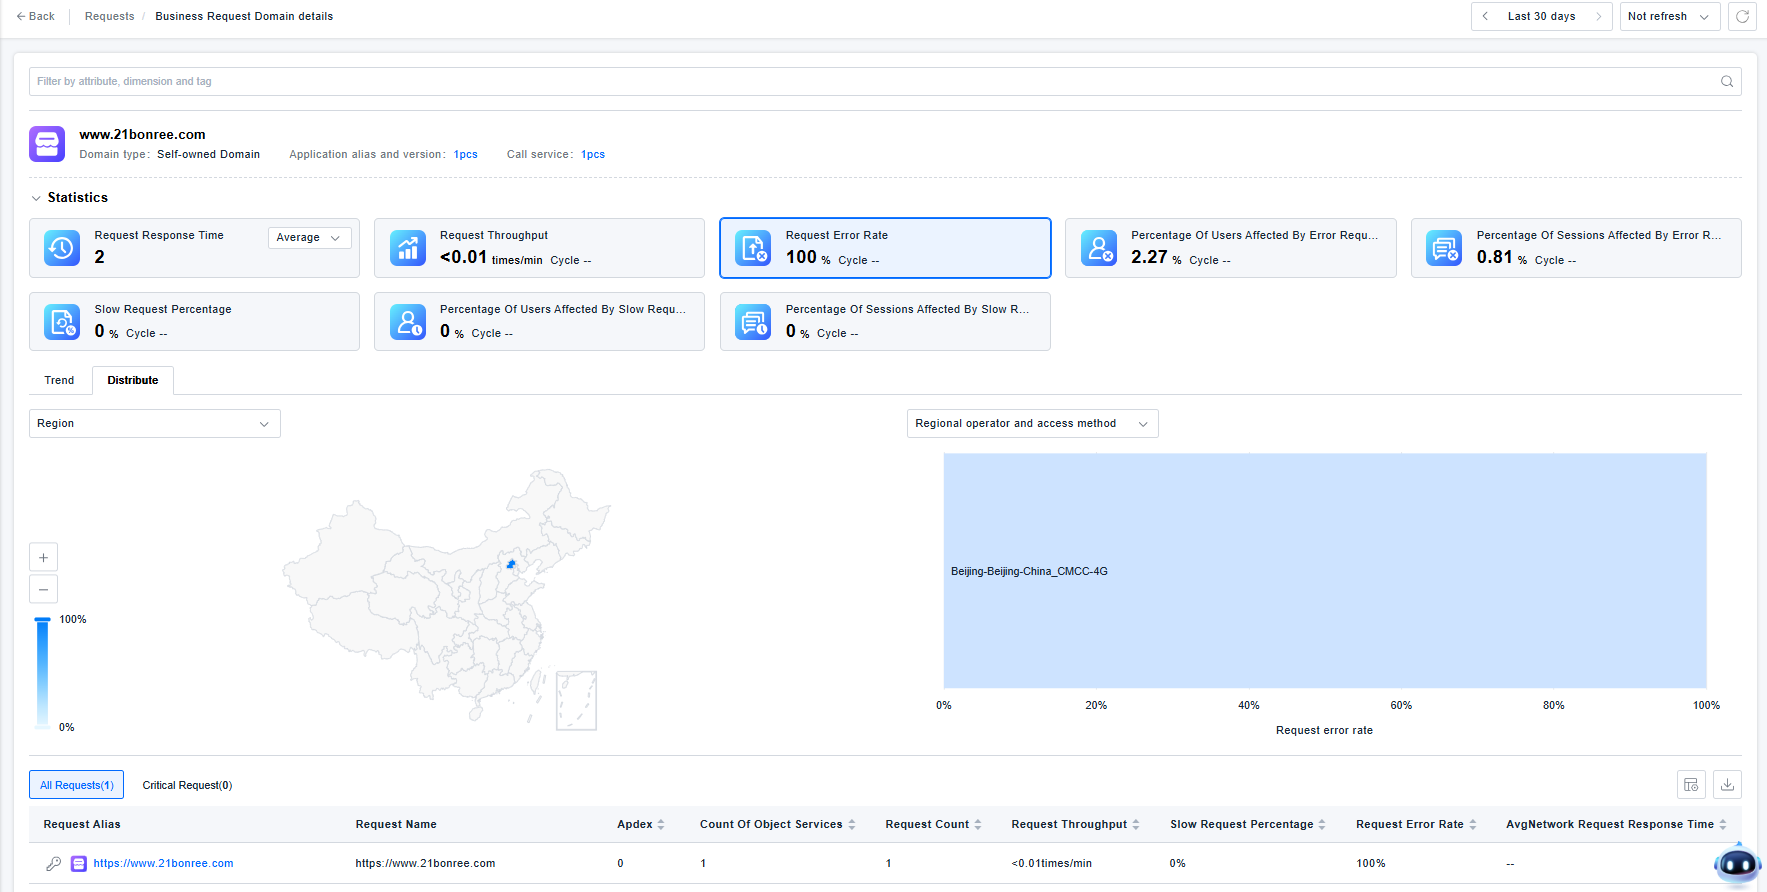
The Domain Details page displays basic domain information, statistics, and a list of network requests under that domain. You can filter by attributes, dimensions, and tags.
The interaction with statistical charts, trend charts, and distribution charts is consistent with the Business Request Domain List.
Business Request Details
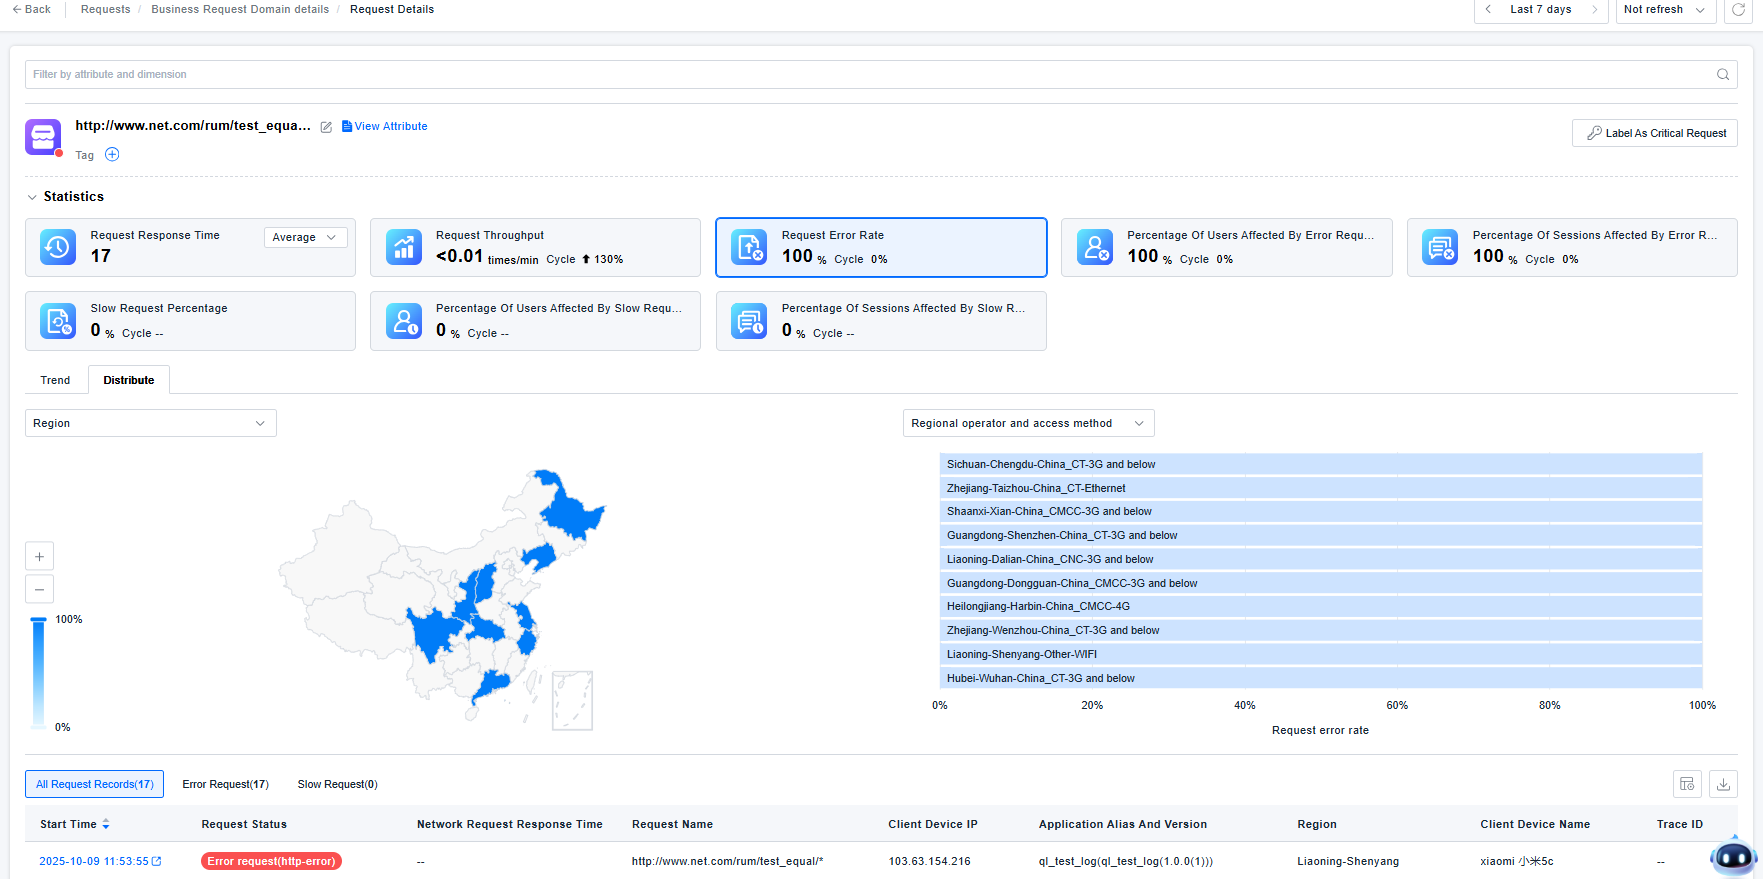
The Request Details page displays basic request information, statistics, and a list of individual request records. You can filter by attributes and dimensions.
The interaction with statistical charts, trend charts, and distribution charts is consistent with the Business Request Domain List.
Clicking on a network request record will navigate to Data Query, where you can view the detailed business request record.
Resource Request
Resource Request analysis contains four parts: Domain List, Domain Details, Resource Request Details, and Resource Request Records. The interactions are consistent with those for Business Requests.
Protocol Extension
Protocol Extension analysis consists of three parts: Request List, Request Details, and Request Records.
Request List
WebSocket and Socket type protocol extensions are aggregated based on IP subnetworks by default: IPv4 addresses are merged to the /24 segment (C class), and IPv6 addresses are merged to the first 64 bits.
- IPv4 Example:
http://192.168.1.8/test/would be merged ashttp://192.168.1.*/test/ - IPv6 Example:
http://[cdcd:910a:2222:5498:8475:1111:3900:2020]/test/would be merged ashttp://[cdcd:910a:2222:5498:*:*:*:*]/test/

Request Details
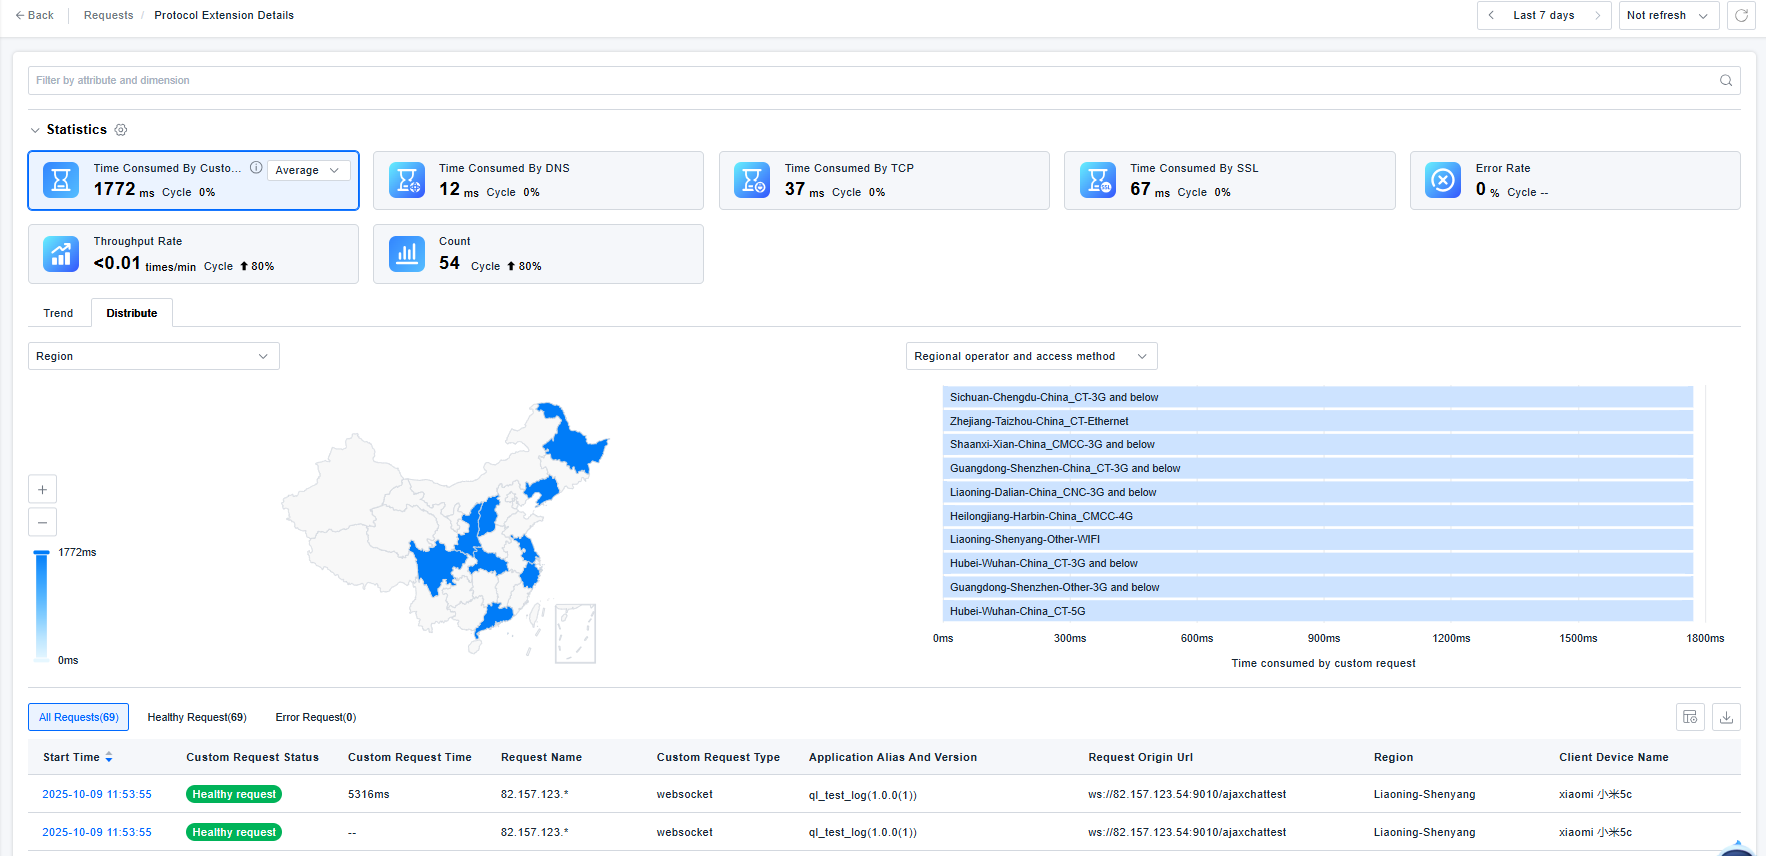
The Request Details page displays statistics, trend and distribution charts for the network request, along with a list of request records. You can filter by attributes and dimensions.
The interaction with statistical charts, trend charts, and distribution charts is consistent with the Business Request Domain List.
Request Records
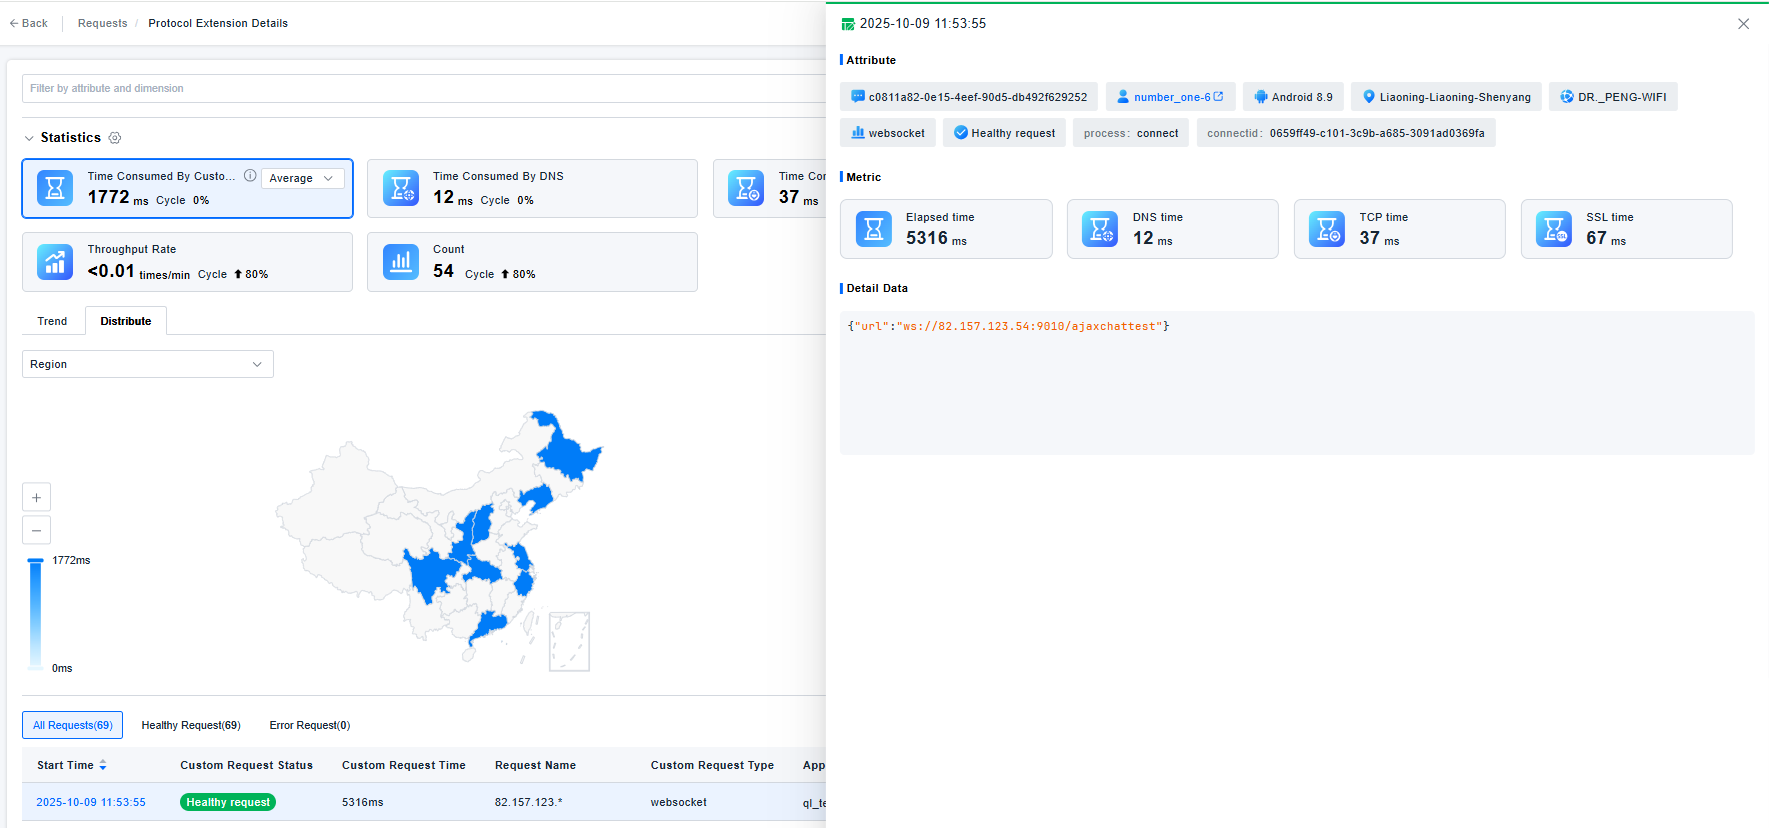
Displays information such as the requesting user, region, access method, protocol type, Session ID, along with metrics and custom detail data.
