Health Analysis
Health Analysis supports four components: Health Score, Apdex, Slow Detection, and Anomaly Detection.
Health Score is a feature that comprehensively evaluates the user experience quality of an application through a quantitative indicator system. It integrates multi-dimensional data such as frontend performance (e.g., Page Loading time, First Content Paint (FCP) time), error rates (e.g., crash rate, JS error, Network Request error), and user behavior fluency (e.g., Lag rate, action time). This data is converted into an intuitive score (0-100 points) via a preset algorithm, helping teams quickly determine the health status of applications, User Sessions, Views, Pages, User Actions, and Network Requests, locate weak points, and track optimization effects.
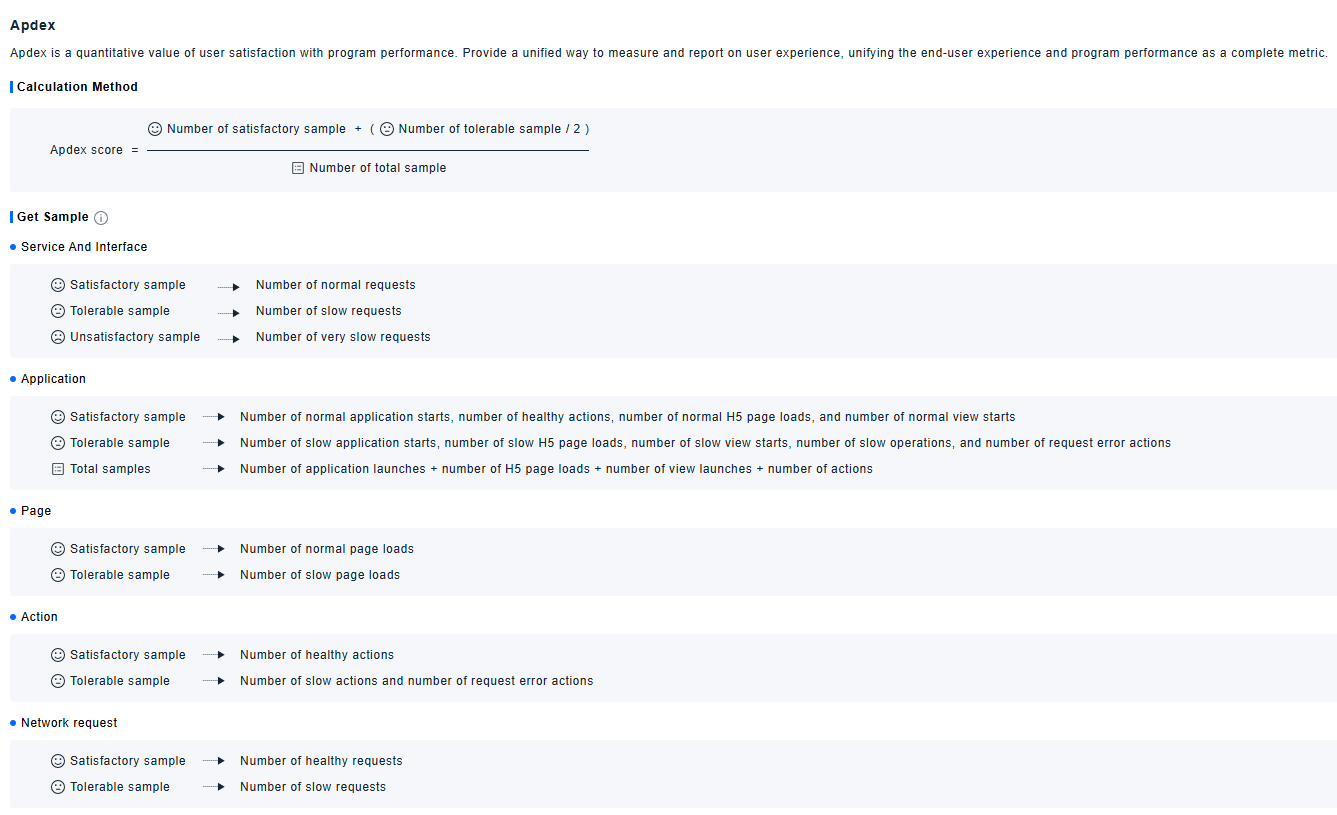
Apdex is a quantitative measure of user satisfaction with application performance. It provides a unified method for measuring and reporting user experience, integrating end-user experience and application performance into a single comprehensive indicator for unified measurement.
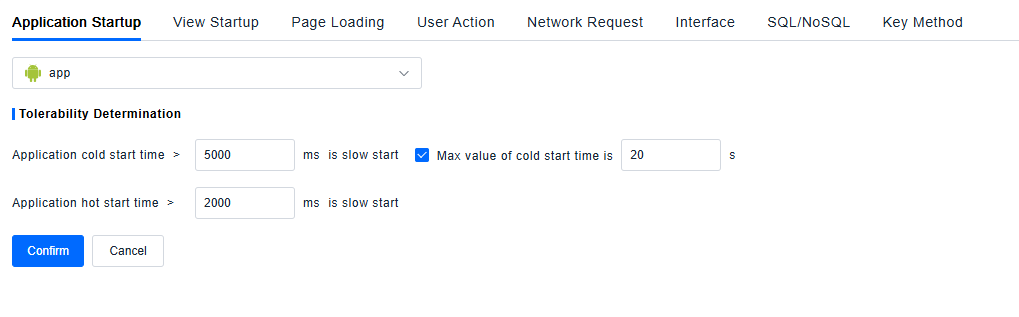
Slow Detection defines the criteria for determining when users perceive slow responses in scenarios such as Application Startup, View Startup, Page Loading, User Actions, and Network Requests.
Anomaly Detection defines Lag, failed requests, crash actions, and blocked actions. It also supports custom shielding of Network Requests, Crashes, Lags, and JS errors associated with specific errors.
Usage Scenarios
- End-to-End Experience Quality Monitoring: When the operation and maintenance team needs to grasp the overall health status of the application in real time and detect potential experience issues promptly, they can build a daily monitoring system based on the Health Analysis feature. Use Health Score to quickly assess the overall experience level of the application, combine the Apdex index to understand user satisfaction with performance, identify slow response issues in scenarios like Application Startup and Page Loading via Slow Detection, and filter non-critical error data through Anomaly Detection to focus on core anomalies such as Lags and Crashes. This enables comprehensive and regular monitoring of application experience, ensuring early detection and resolution of issues.
- Version Release Quality Verification: Product and development teams can compare experience differences between new and old versions, check trends in Health Score and Apdex, and determine whether the new version has a negative impact on user experience. If the score drops, Apdex decreases, or anomalies increase, they can quickly locate the problem and roll back or fix the version.
- Cross-Team Collaboration and Goal Alignment: When product, development, and operation teams need to advance experience optimization based on unified standards, the feature helps teams move beyond "subjective experience judgments" and drive experience optimization with data, achieving a closed-loop management process from "problem discovery" to "quantified improvement".
- Weak Point Localization: When an application has a low Health Score, teams can check for anomalies such as slow Application Startup, slow Page Loading, slow actions, slow Network Requests, and Lags to quickly locate and fix weak points, preventing user churn due to experience issues.
Getting Started
Health Score
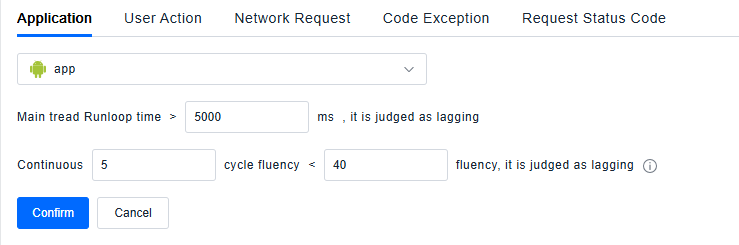
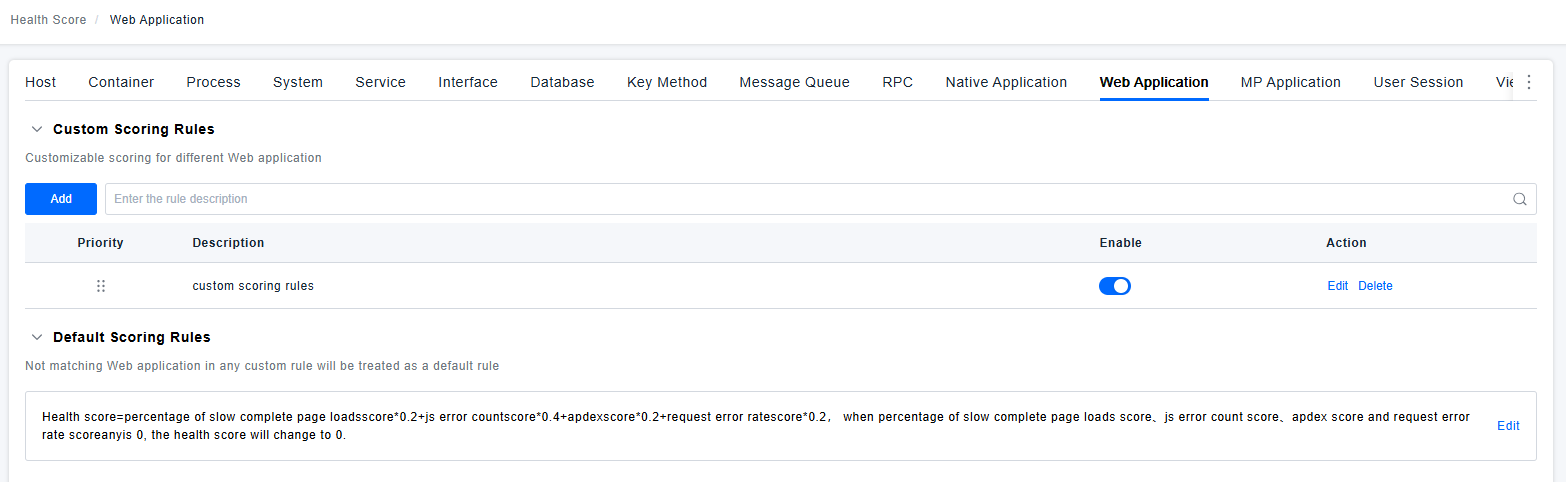
It supports configuring Health Scores for Native Applications, Web Applications, MP Applications, User Sessions, Views, Pages, User Actions, and Network Requests. The platform provides default scoring rules; users can modify these default rules or create new custom rules to apply to specific applications. The matching priority can be adjusted by dragging in the list—when multiple rules are applicable, the calculation uses the rule with the highest priority.
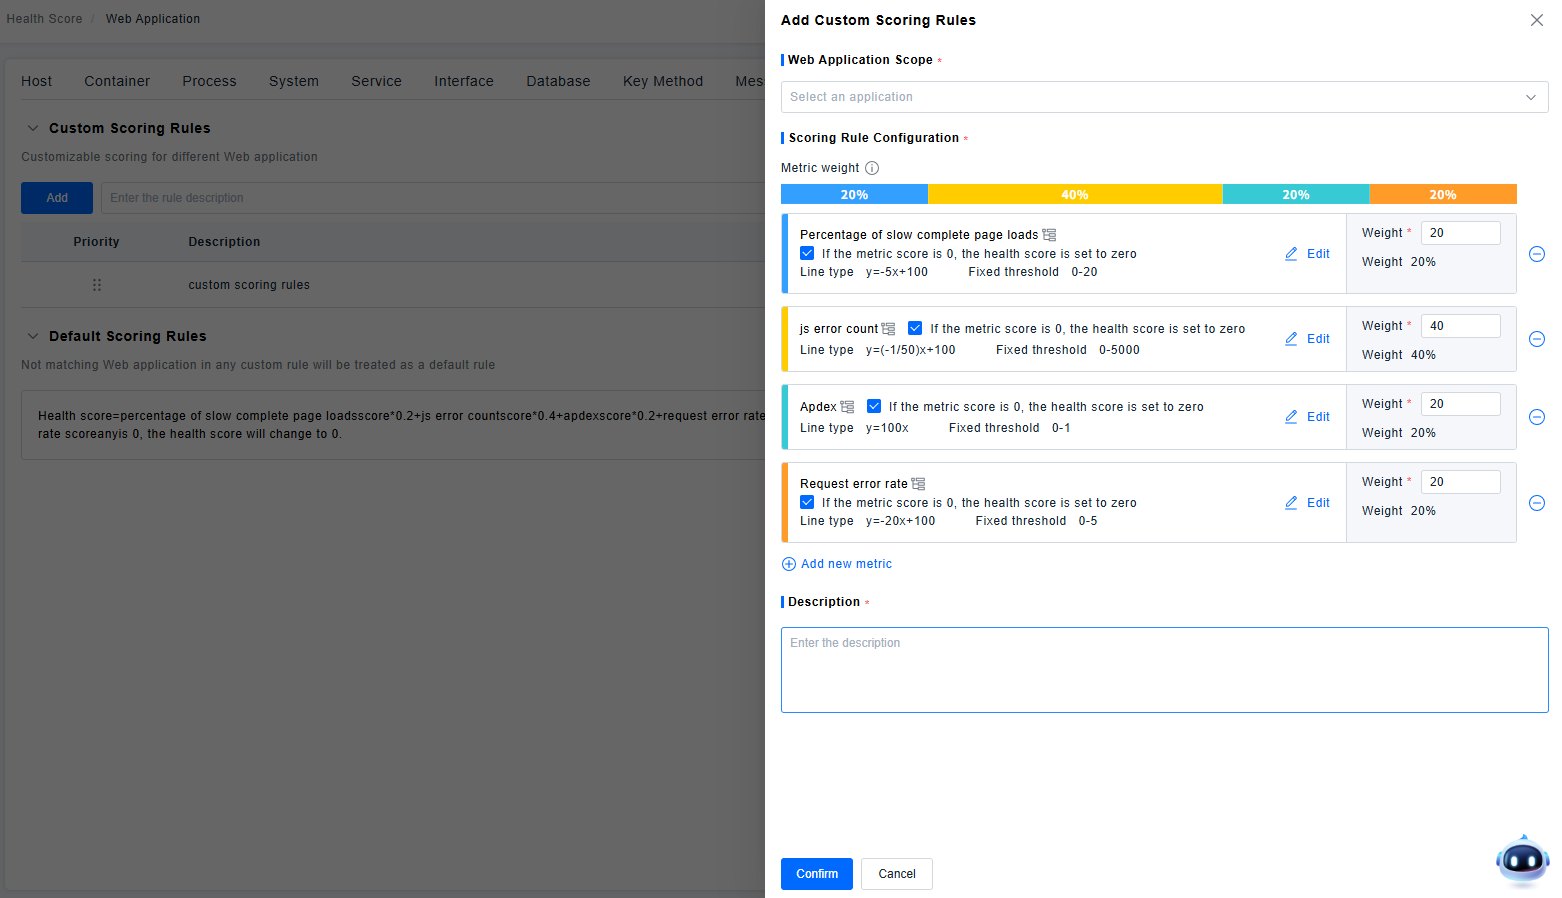
To create a custom scoring rule, you need to set the object scope, define conditions to target the objects for which the rule will calculate the Health Score (this example uses Web Applications, but the same logic applies to Native Applications, MP Applications, Views, Pages, Actions, and Network Requests), select the applicable application scope, set indicator weights, and specify whether the Health Score is set to 0 if the score of a specific indicator is 0.
User Session Status
User Session status is categorized as Satisfactory, Tolerable, or Anomalous. Anomalous settings have the highest priority, followed by threshold settings. If neither anomalous settings nor threshold settings are triggered, the session is considered Tolerable.
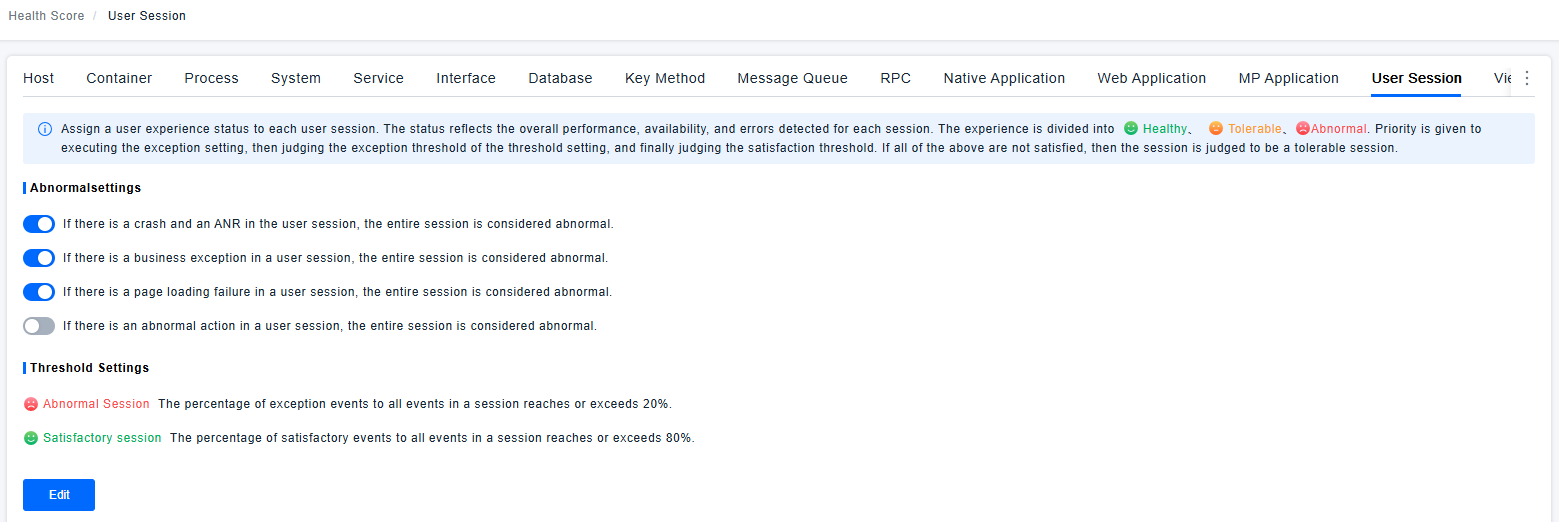
For example, suppose a session contains the following event types. The user sets that if anomalous types account for more than 10%, the session is Anomalous; if satisfactory events account for more than 80%, the session is Satisfactory.
| XHR Action | XHR Action | Loading Action | Business Event | XHR Action | Loading Action | XHR Action | Loading Action |
|---|---|---|---|---|---|---|---|
| Satisfactory | Satisfactory | Anomalous | Satisfactory | Satisfactory | Tolerable | Tolerable | Anomalous |
-
Number of Satisfactory events: 1+1+1+1 = 4
-
Number of Anomalous events: 1+1 = 2
-
Number of Tolerable events: 1+1 = 2
-
Total events: 4+2+2 = 8
-
Proportion of Satisfactory events: 4/8 = 50%
-
Proportion of Anomalous events: 2/8 = 25%
Therefore, this session is classified as Anomalous.
Apdex
Apdex (Application Performance Index) is a quantitative indicator for evaluating user satisfaction with application performance. Its core value lies in providing a unified method for measuring and reporting user experience. It integrates end-users' subjective experience perceptions and application's objective performance data into a single comprehensive indicator, enabling standardized and integrated measurement of application performance and allowing teams to intuitively determine user satisfaction with performance.
Slow Detection
The Slow Detection feature defines quantitative criteria for "user-perceived slow responses" across five core scenarios: Application Startup, View Startup, Page Loading, User Actions, and Network Requests. It provides a unified basis for identifying slow experience issues in each scenario.
Anomaly Detection
The Anomaly Detection feature clarifies the criteria for determining Lag, failed requests, Crashes, and blocked actions. It also supports custom configurations—specific error types (including Network Request errors, Application Crashes, Page Lags, and JS errors) can be shielded, flexibly filtering out anomaly data that does not require monitoring and ensuring that issue analysis focuses on core problems.