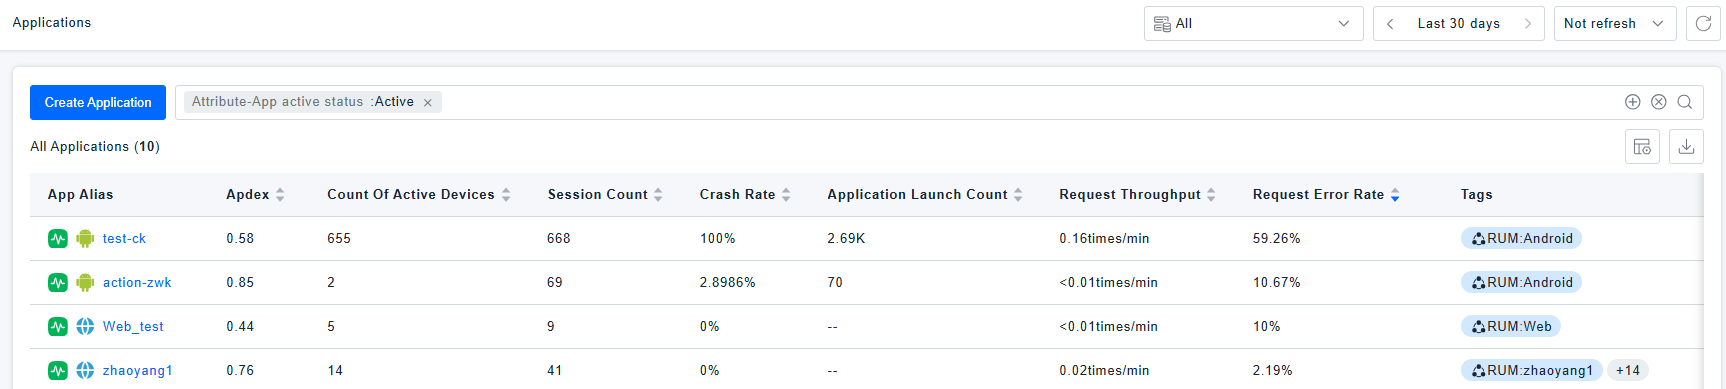
Applications
Application Analysis is one of the core entry points for Real User Monitoring (RUM). It encompasses multi-dimensional core capabilities, providing comprehensive support for in-depth insights into your applications: It not only offers an overall Health Score and trend charts for key metrics but also supports quick access to modules such as the Application Relationship Diagram, Key Metrics, Issues, Log Records, Topical Analysis, and Smart Insights. Furthermore, it allows filtering analysis data by different application versions and intuitively displays basic information like application properties, associated tags, and monitored duration, flexibly meeting analytical needs across various business scenarios.
Usage Scenarios
Global Application Health Monitoring Scenario: When you notice a low Health Score for an application on your workspace dashboard, you can drill down directly into the application details page. By integratively reviewing multi-dimensional analysis content—such as core metric trends, session data, page performance, user action records, network request details, associated service data, key metric trends, issue logs, and alert information—you can quickly identify the specific issues affecting the Health Score, providing precise direction for subsequent troubleshooting and optimization.
Issue and Root Cause Identification Scenario: When development teams receive user feedback like "blank page" or "application crash" and need to trace the "symptom" back to the "code-level root cause", they can perform chained investigation by "quickly accessing Issues + Log Records + the Application Relationship Diagram".
New Version Iteration Validation Scenario: After a product update, when there's a need to compare the user experience between the new and old versions to verify if the iteration meets goals or introduces new issues, precise validation can be achieved through "Version filtering + Multi-dimensional metric comparison".
Getting Started
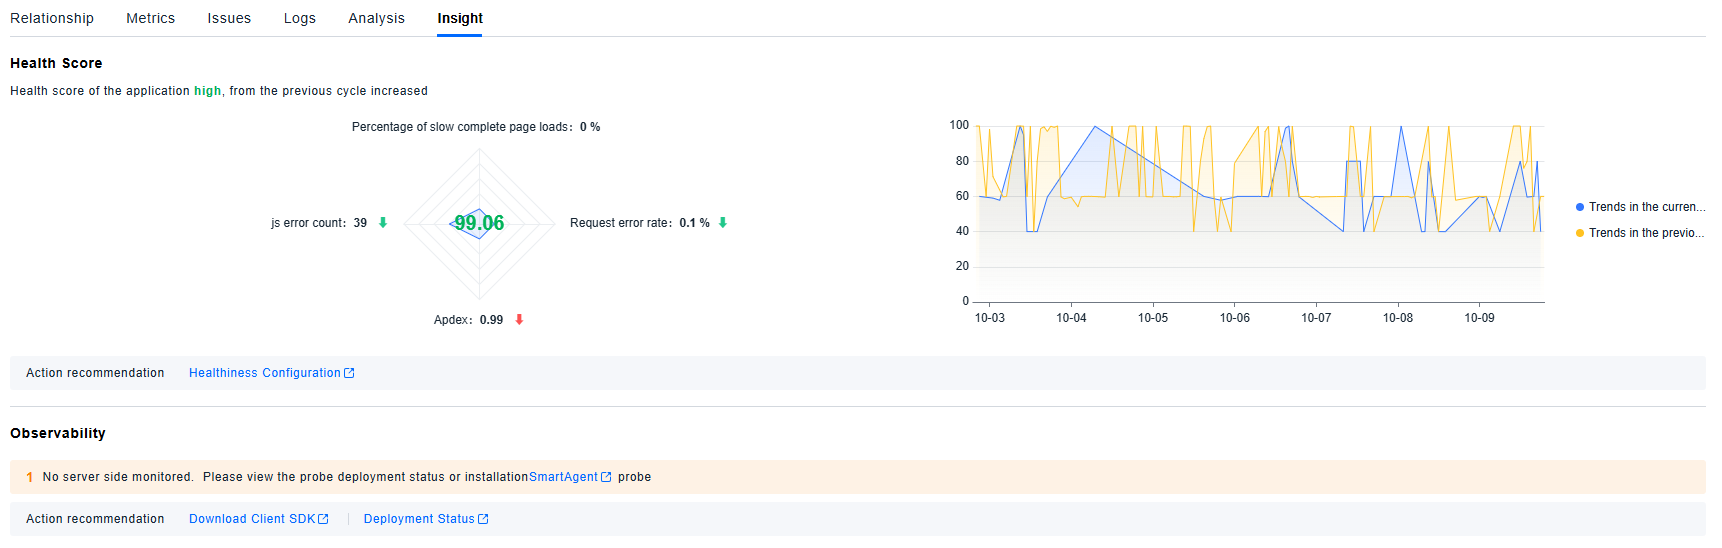
Health Score
The Health Score is an overall evaluation calculated by weighting various application metrics. It supports custom calculation rules. For details, see Health Analysis.
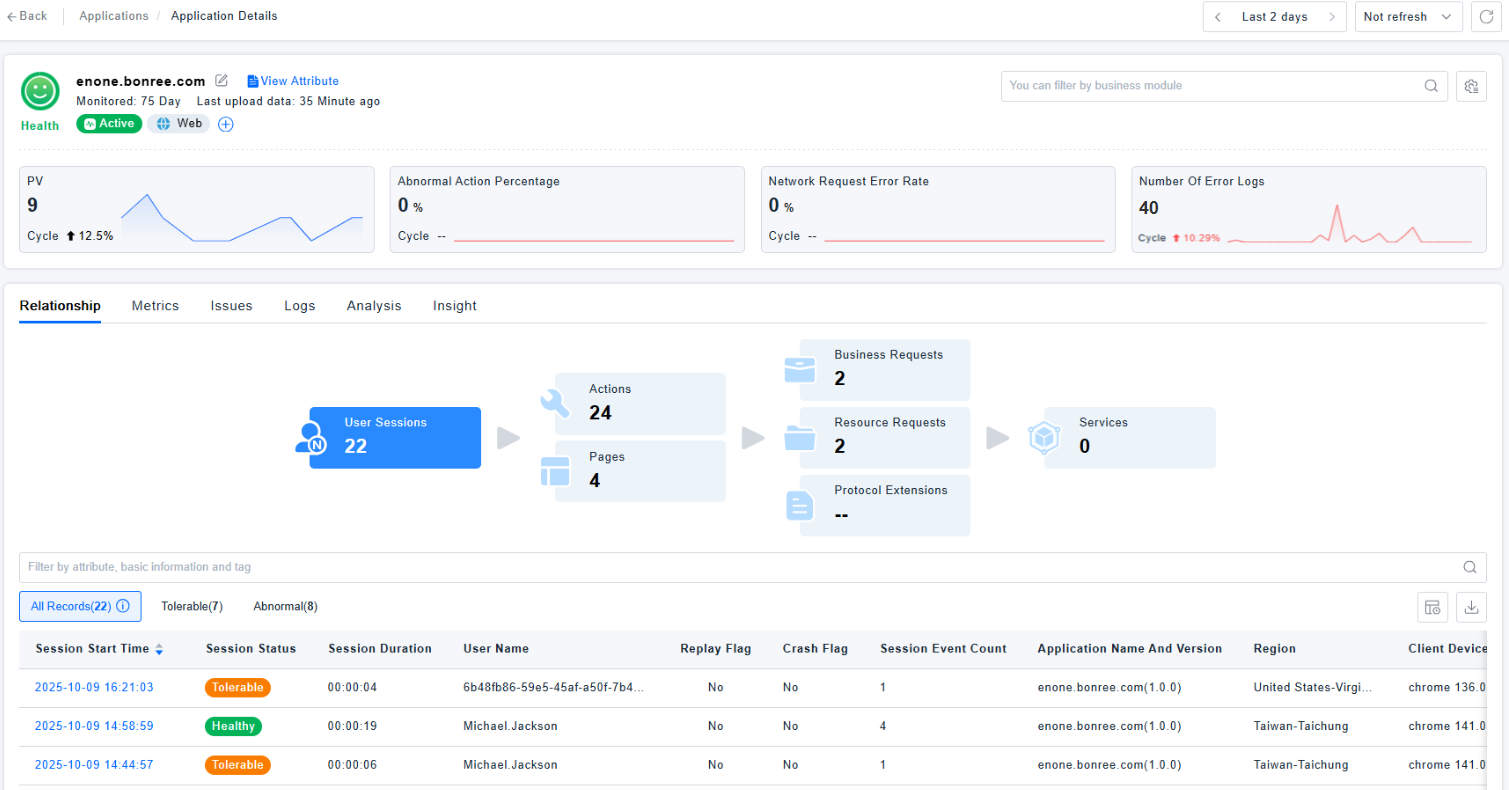
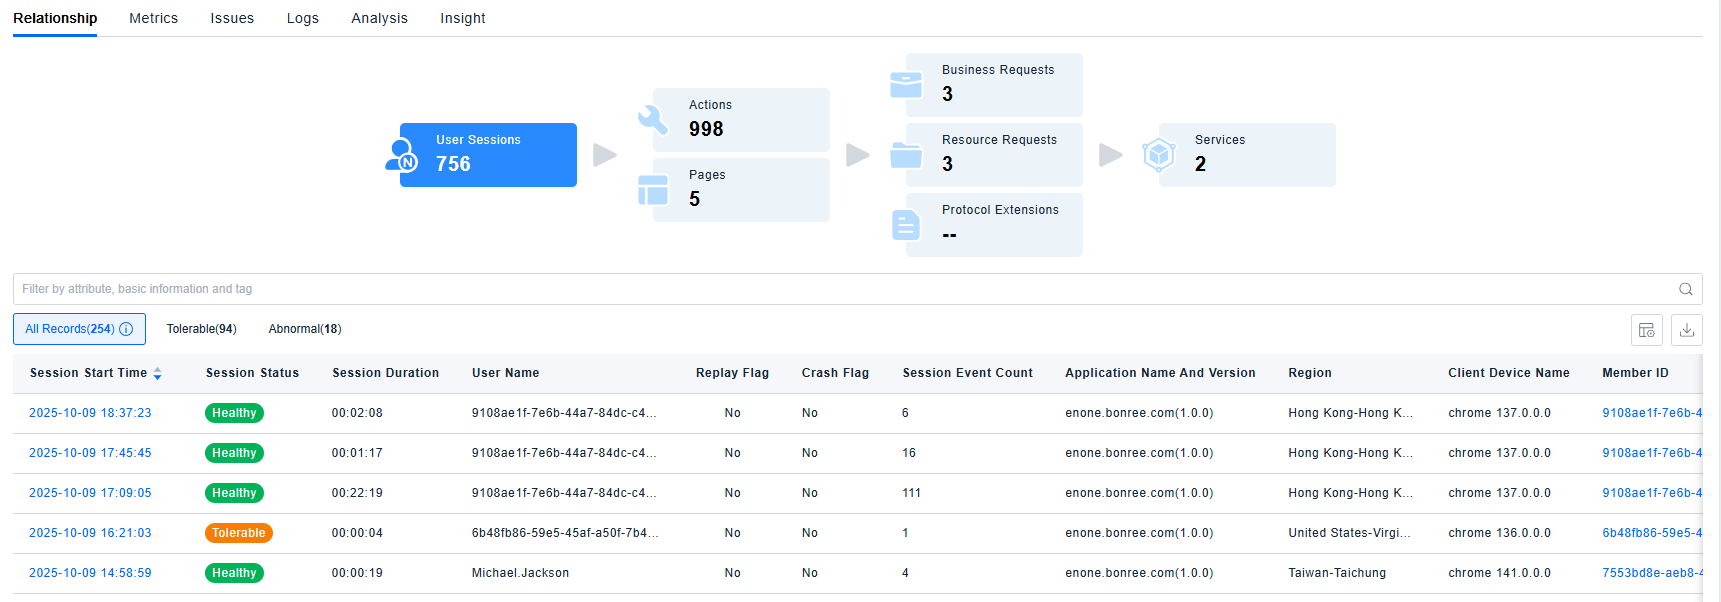
Relationships
Displays the number of User Sessions under the application, as well as the number of pages and actions contained within those sessions. It also shows the number of triggered Business requests, Resource requests, Protocol extensions, and calls to backend services. Clicking on a card allows you to view the corresponding list data and drill down into details.
Metrics
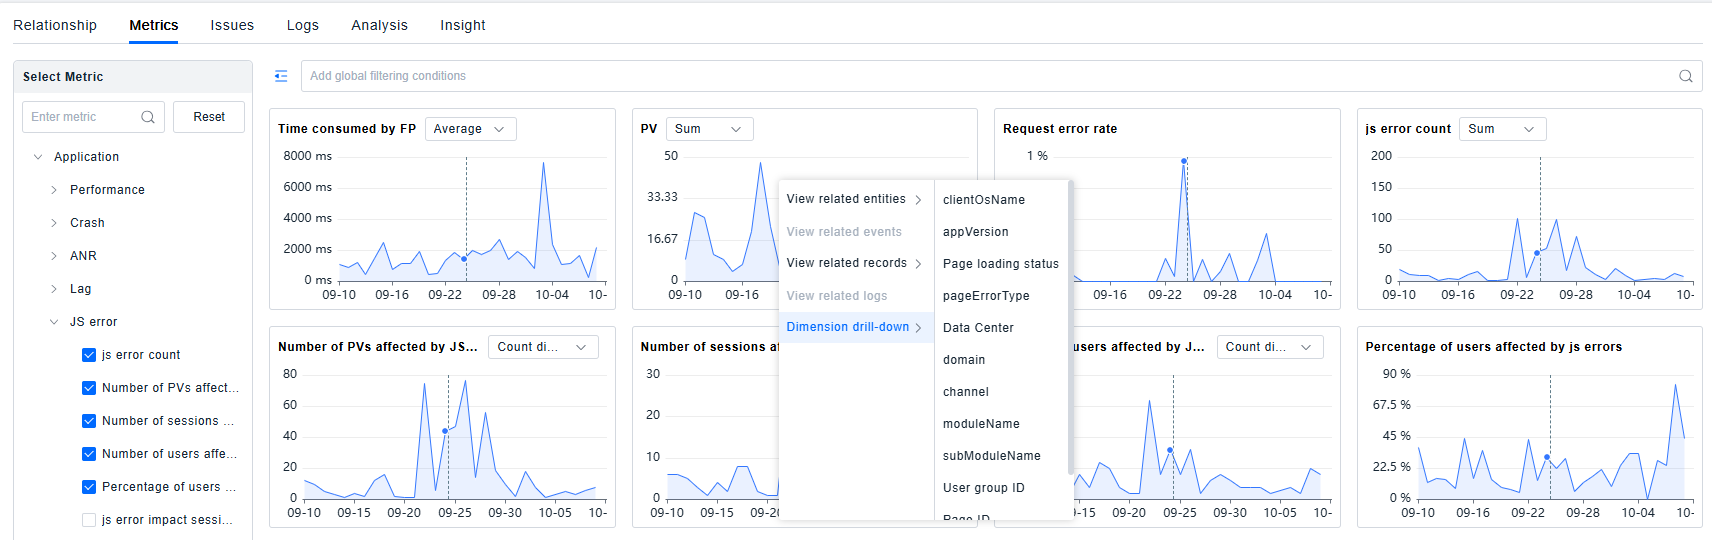
Displays trend charts for various metrics of the current application over the selected time period. You can download the data, view related dimensions and records, or enlarge the card for year-over-year or month-over-month analysis.
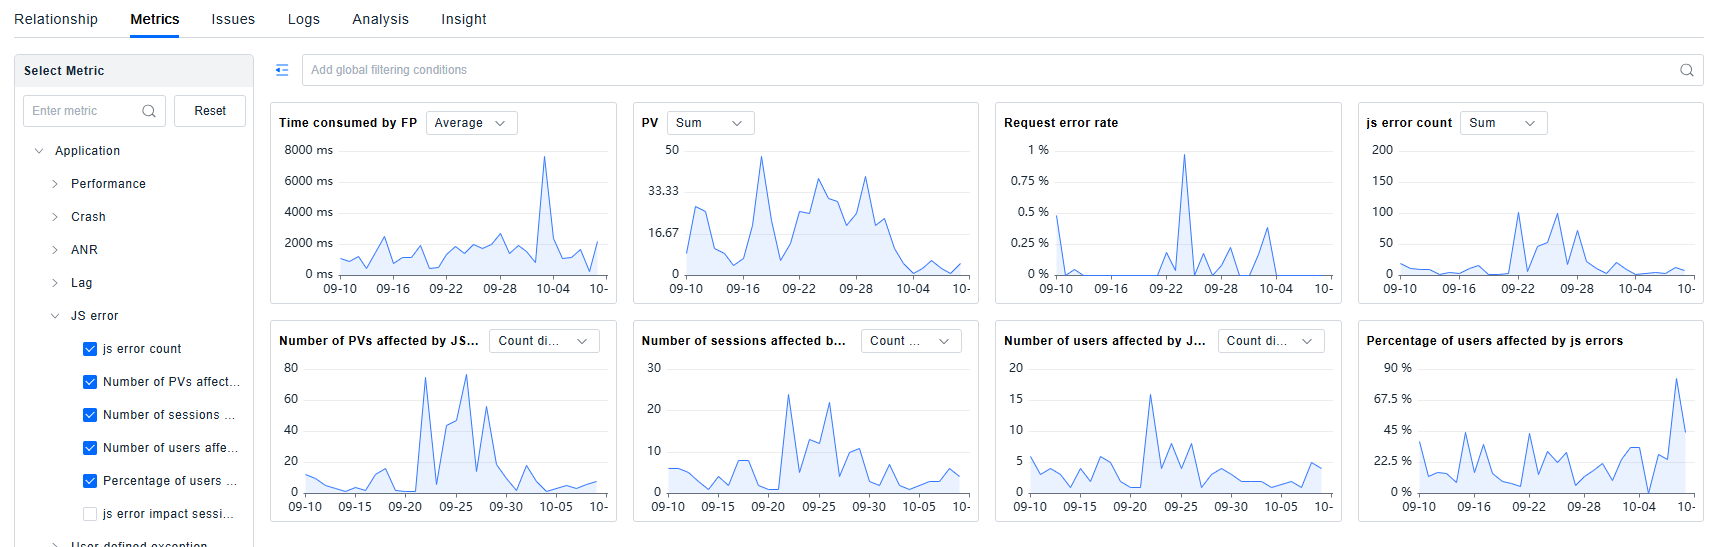
Supports dimensional drill-down analysis for metrics.
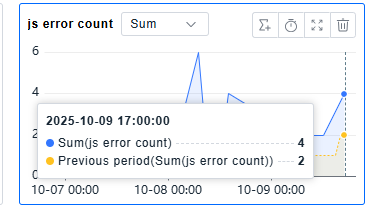
Supports time analysis: Comparative analysis with the previous period, previous day, previous week, previous month, or previous year.
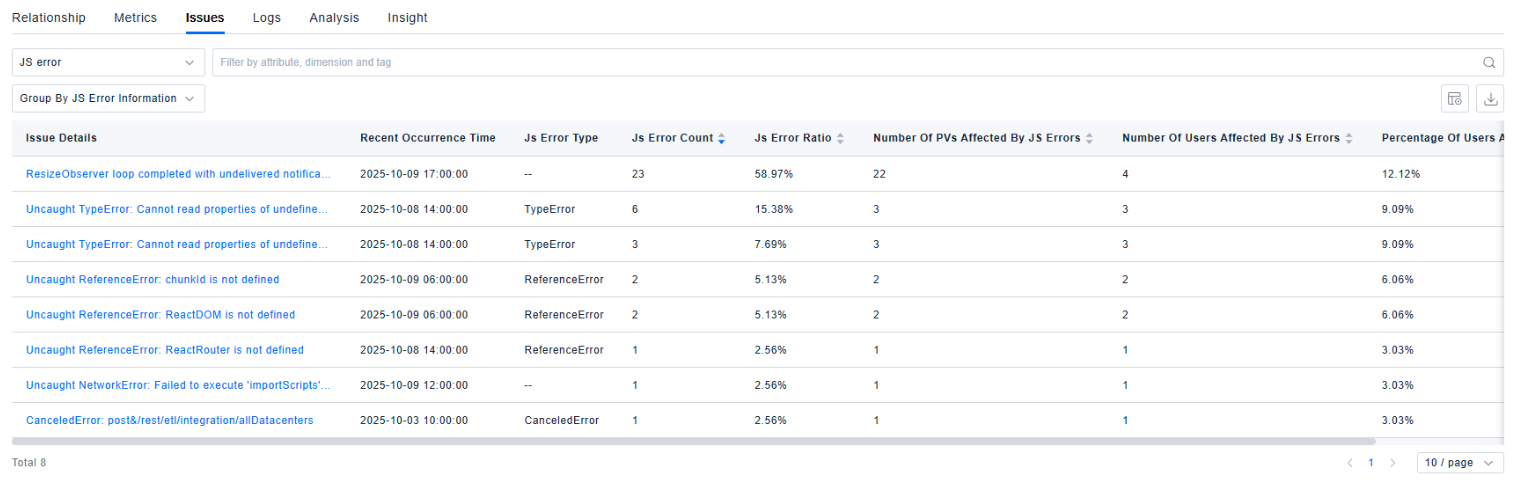
Issues
Displays the current application's Issues. You can switch the view between different issue types using the dropdown menu. For details, see issues.
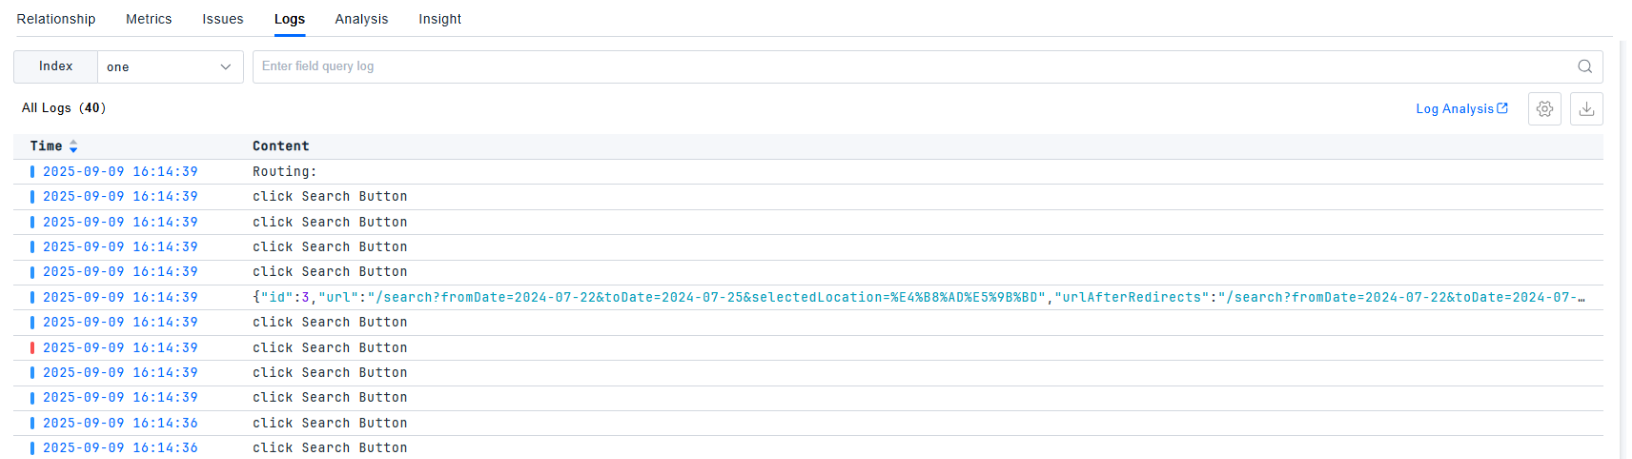
Logs
Displays the logs for this application. For a detailed introduction to log capabilities, see Log Query
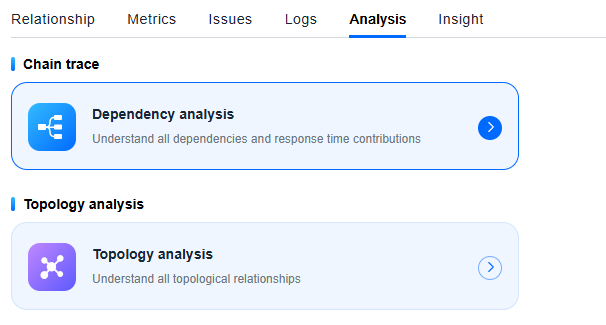
Analysis
Provides quick links to Dependency Analysis and Topology Analysis. After jumping, the current application is automatically selected as the analysis target.
Insights
The ONE platform performs decomposition analysis on the metrics involved in the Health Score, displays the Health Score trend over the last seven days, and records insights such as server-side monitoring status, SDK version status, and changes.