Data Query
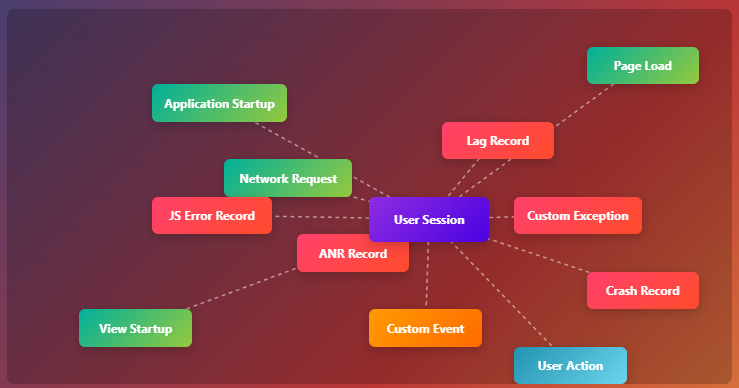
When users access an application, they trigger a series of detailed records, including: Application Startup, User Session, Page Load, View Startup, User Action, Network Request, Crash Record, ANR Record, JS Error Record, Lag Record, Custom Exception, and Custom Event.
In the Data Query center, users can quickly search for detailed data generated during user access to an application. It allows for locating issue stack traces, contextual information, and the surrounding circumstances.
The types of records available for each application type are listed in the table below:
| Application Type | Records |
|---|---|
| Android | Application Startup, User Session, Page Load, View Startup, User Action, Network Request, Crash Record, ANR Record, Lag Record, JS Error Record, Custom Exception, Custom Event |
| HarmonyOS NEXT | Application Startup, User Session, Page Load, View Startup, User Action, Network Request, Crash Record, Lag Record, JS Error Record, Custom Exception, Custom Event |
| iOS | Application Startup, User Session, Page Load, View Startup, User Action, Network Request, Crash Record, Lag Record, JS Error Record, Custom Exception, Custom Event |
| Web Application | Application Startup, User Session, Page Load, User Action, Network Request, JS Error Record, Custom Exception, Custom Event |
| WeChat MiniProgram | Application Startup, User Session, View Startup, User Action, Network Request, JS Error Record, Custom Exception, Custom Event |
| TikTok MiniProgram | Application Startup, User Session, View Startup, User Action, Network Request, JS Error Record, Custom Exception, Custom Event |
Usage Scenarios
Troubleshooting Customer Complaints Scenario: When receiving a customer complaint with known specifics like the time and associated user information, you can quickly locate the target User Session in the RUM Data Query center. By entering the username/ID and setting the time range around the complaint, you can filter the session records. Using features like session replay, you can trace the user's complete action path (page navigations, button clicks, etc.) while correlating performance fluctuations or network request errors that occurred during the session, precisely identifying the experience issue that caused the complaint (e.g., page freeze, unresponsive action).
Code-Level Root Cause Identification for Crashes Scenario: If a specific crash, JS error, or other exception is known to exist in the application, filter for the corresponding exception type in the RUM Data Query center. After finding the target exception record, directly view the associated stack trace to clearly trace the code execution path that triggered the error, including the error line number and relevant context, quickly pinpointing the root cause at the code level and reducing cross-team investigation time.
Context Investigation for Specific Events Scenario: When needing to analyze a known specific event (e.g., "payment failure," "order submission timeout"), enter the event information in the RUM Data Query center to quickly locate the corresponding User Session. By examining the action context within the session details (page state before/after the event, interface request parameters, response results), you can clarify the complete scenario and contributing factors of the event.
Getting Started
Access: Insight/Data Query. Click the Session ID of a record to view complete contextual information and analyze issues.
Click the corresponding record tab to view the record list. For definitions of statuses like error and slow for each record, please refer to Health Analysis.
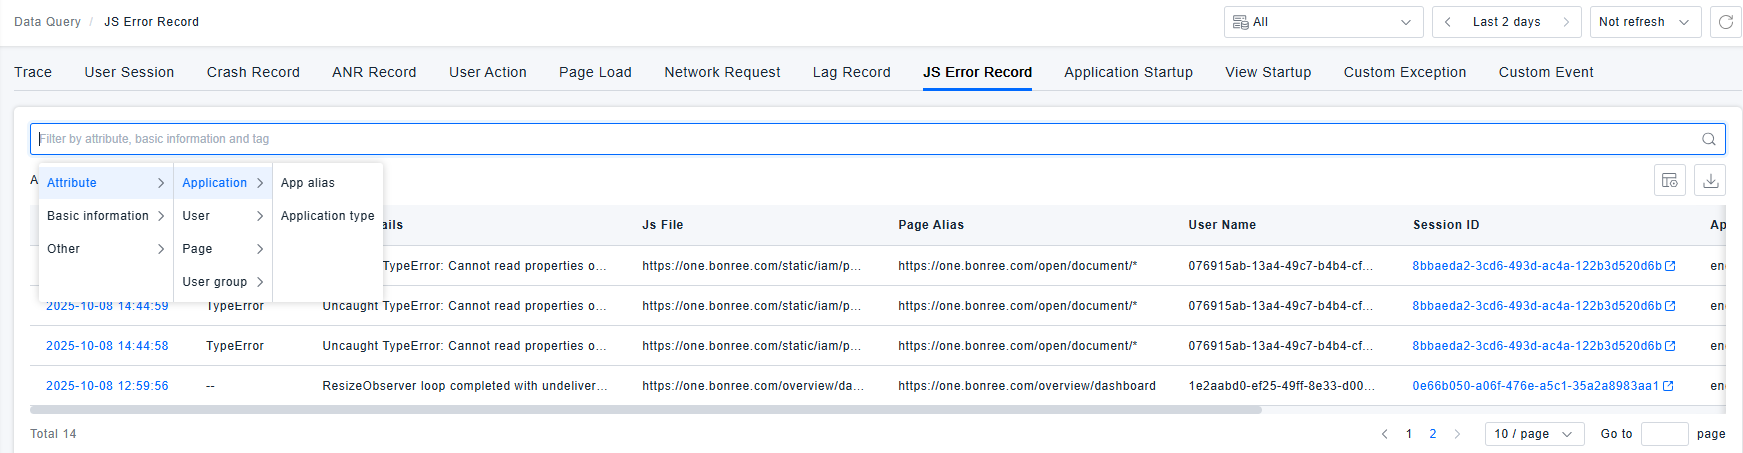
Supports filtering based on application attributes, user attributes, user group attributes, basic information (device model, device IP, operating system, city, ISP, access method, application Client SDK version, download channel, etc.), and tags. Recently used filter conditions are displayed, and frequently used filters can be saved for quick reference and reuse.
Record Details
Crash Record
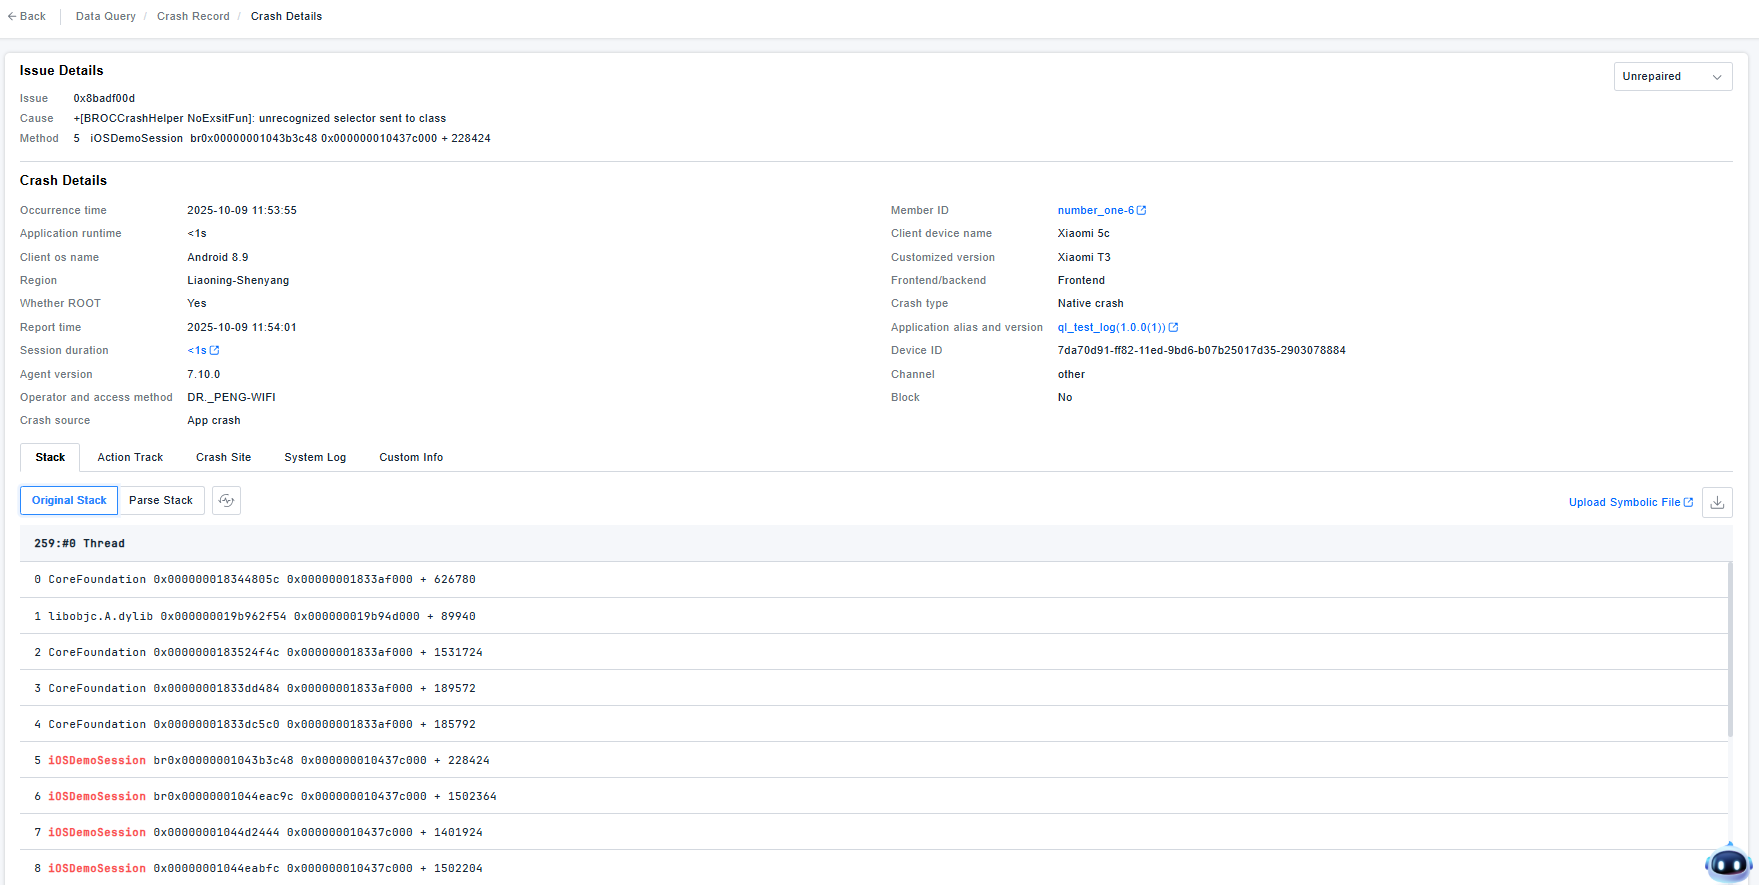
Displays: Issue detail, application name and version, session duration, User ID, device information, etc., along with the stack, action track, crash site, system log, and custom info.
-
Issue Detail: Extracts the Issue, cause, and method from the record, grouping similar issues for statistical analysis.
-
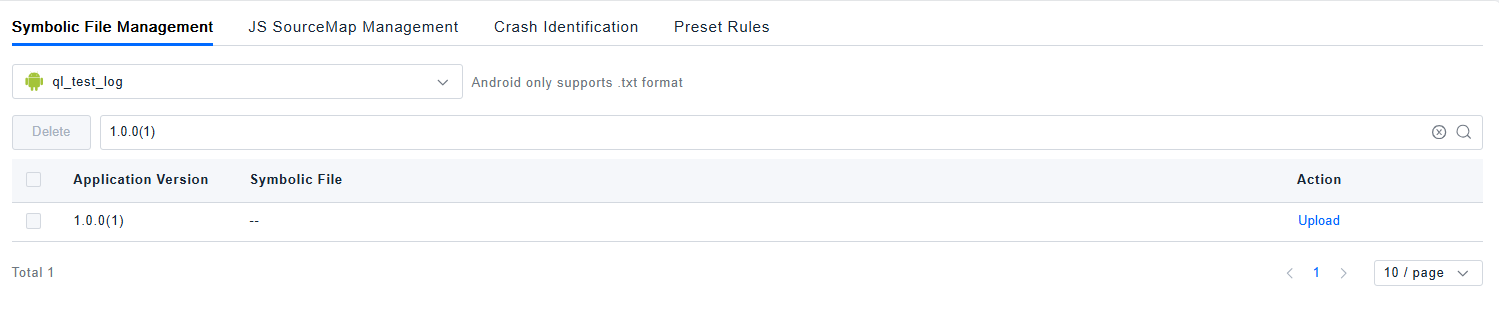
Stack: The SDK collects the raw stack. It can be symbolicated by uploading symbolic files. Supports downloading the stack locally. (Symbolic File Management)
-
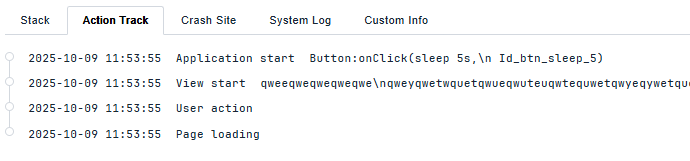
Action Track: Refers to the sequence of actions leading up to the current record, as shown below:
-
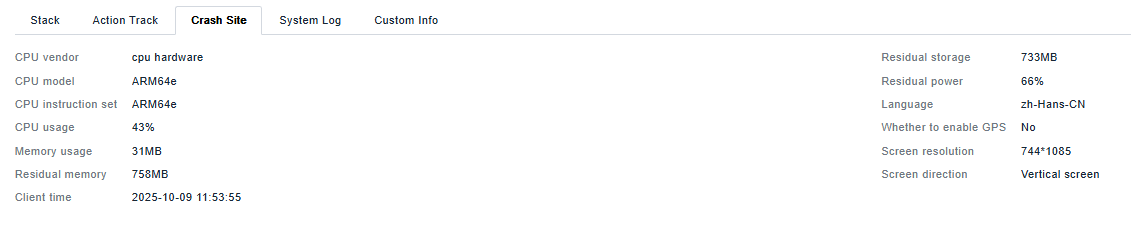
Crash Site: Shows the device information at the time of the event, as shown below:
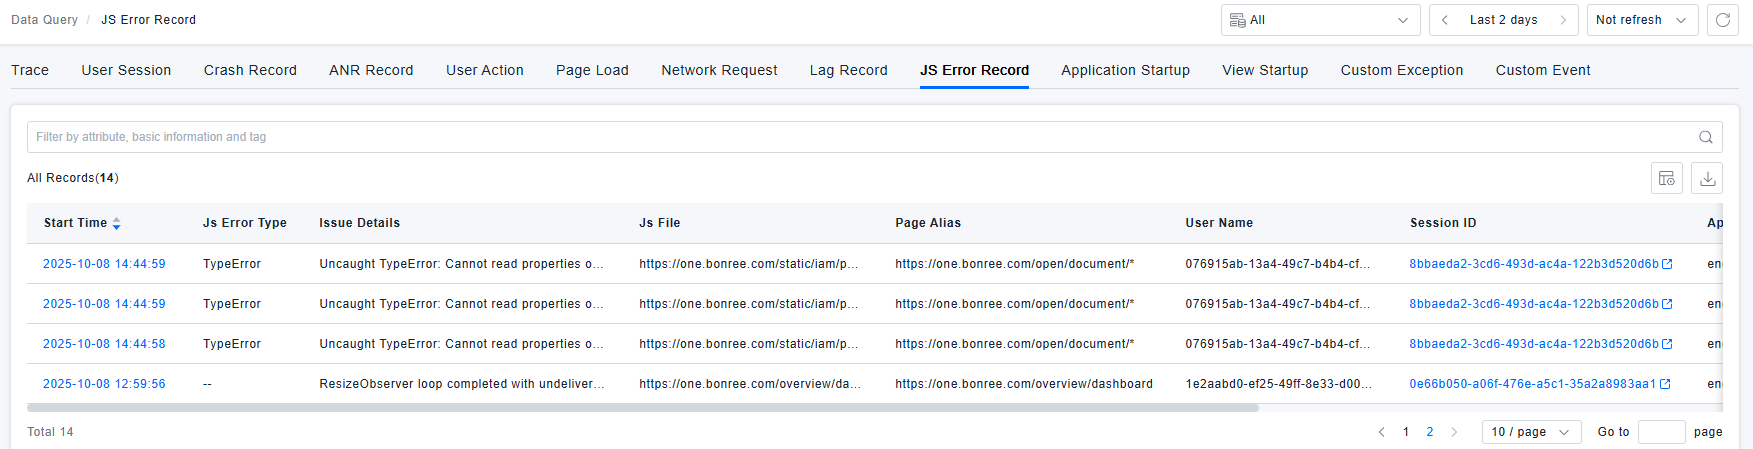
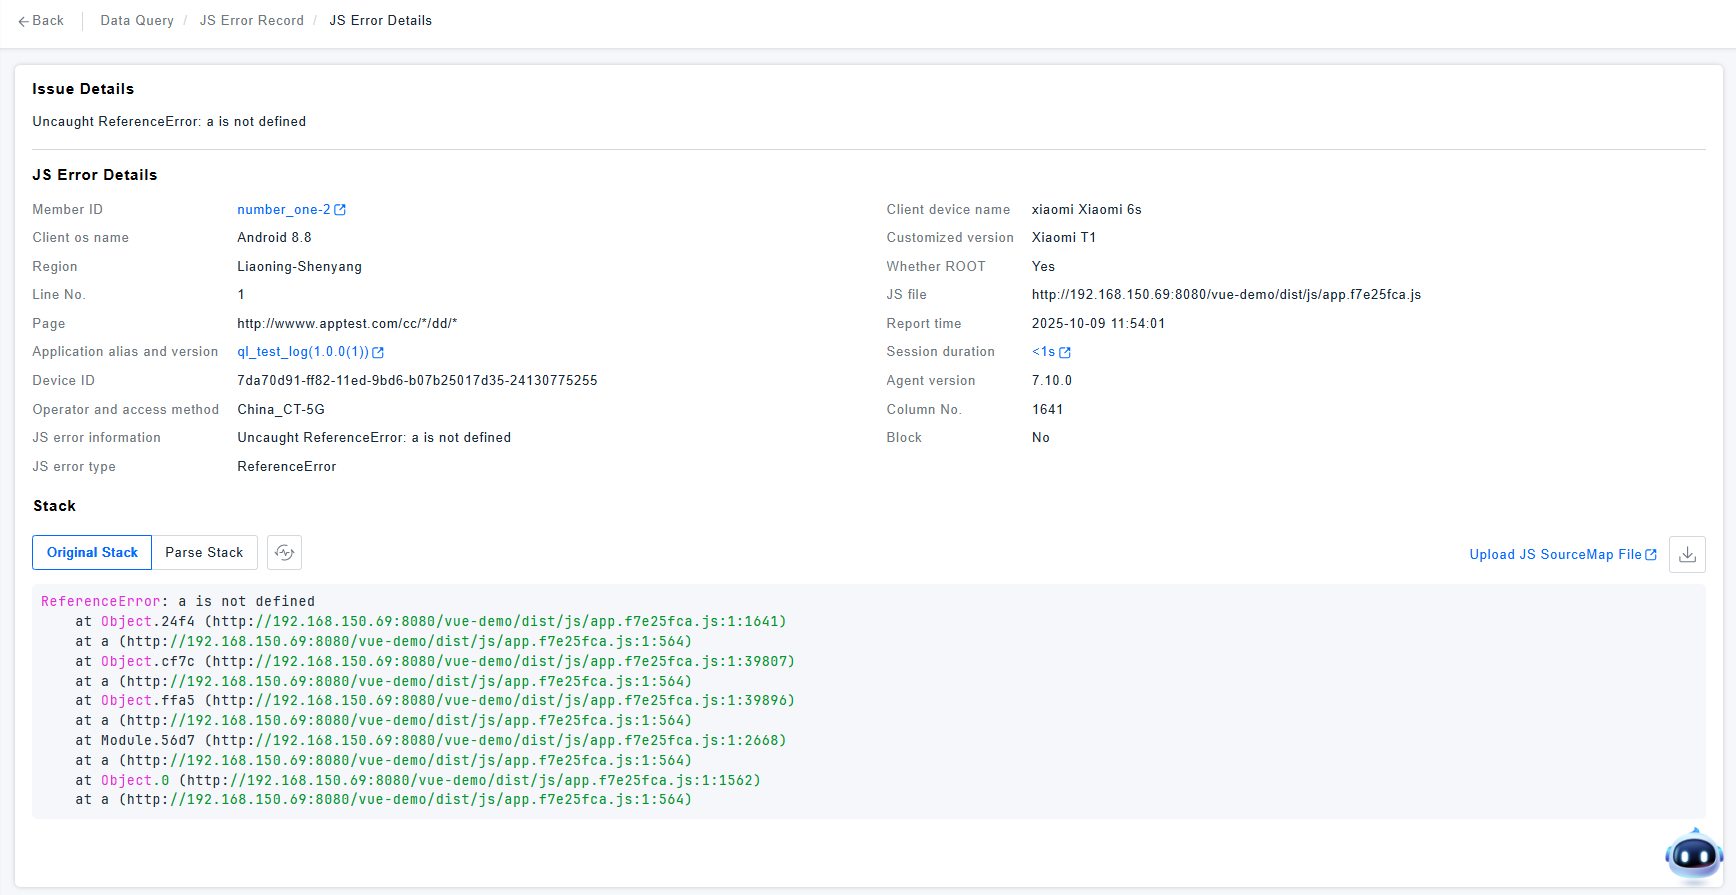
JS Error Record
This section allows you to view JS Error records for all applications, facilitating quick troubleshooting.
- Details include the JS Error summary, specific error details, and the stack trace. The stack trace can be parsed to locate the problematic code.
- Clicking the User ID navigates to the User Session / User Details. Clicking the session duration navigates to Data Query / User Session / Session Details, highlighting the current JS Error event. If the JS SourceMap file hasn't been uploaded, clicking the link directs you to Settings / Data Processing / Application / JS SourceMap Management for upload.
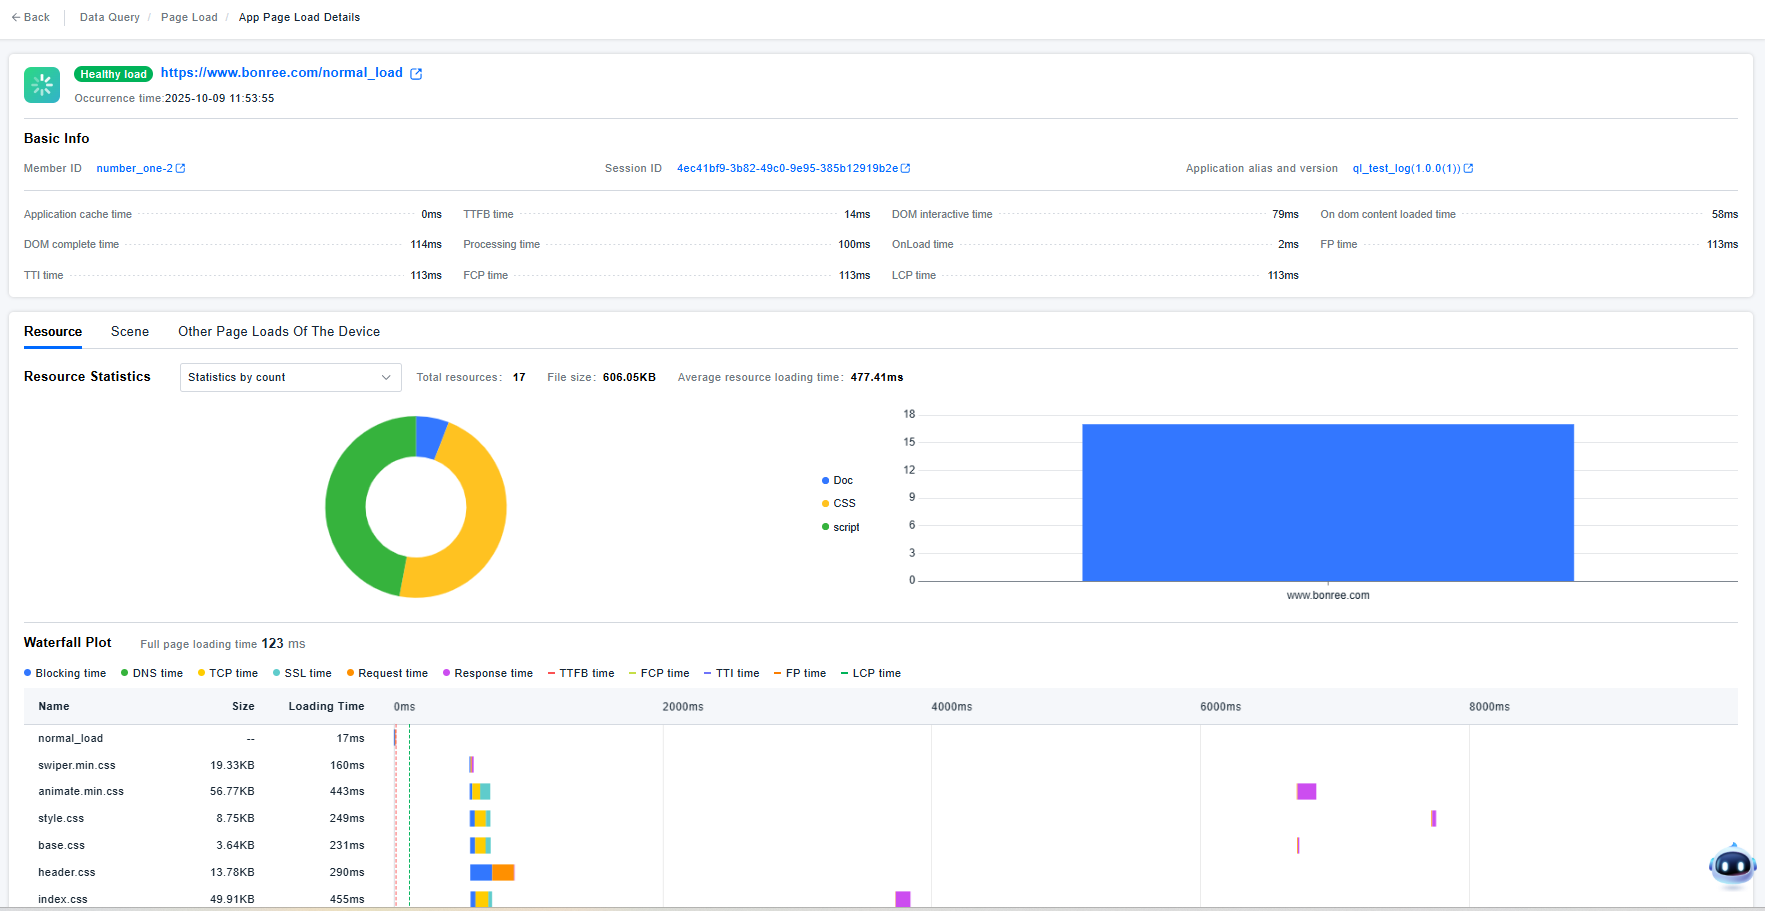
Page Load Record
Displays Page Load metrics and a waterfall chart. The waterfall chart's horizontal axis uses ms as the unit, covering the entire page loading cycle from left to right (0ms to 8000ms). The length of each resource "block" on the horizontal axis represents the total time taken from request initiation to loading completion, helping you quickly identify the "most time-consuming periods".
The vertical axis lists all resources loaded during the page load (such as normal_load, various CSS/JS files), with each row containing three key pieces of information:
- Name: Resource name (e.g.,
style.css); - Size: Resource volume (e.g.,
8.75KB); - Loading Duration: Total time from start to completion of resource loading (e.g.,
249ms).
Performance Analysis Logic:
-
Identify "Top Time-Consuming Resources": Focus on resources with high values in the "Loading Duration" column, as these are key targets for frontend performance optimization (consider compression, CDN acceleration, asynchronous loading, etc.).
-
Analyze "Time Distribution Across Phases": Use the length of color blocks to analyze which phase consumes the most time for each resource. For example:
-
If a resource has a long blue "Blocking" block, it indicates the browser is blocked due to resource dependencies (optimize resource loading order, such as making non-critical CSS/JS load asynchronously).
-
If a purple "Response" block is long, it suggests slow data return from the server (investigate backend interface performance).
-
-
Identify "Resource Dependencies": If resources load "serially" (one resource starts only after the previous one finishes), consider changing to "parallel loading" (e.g., adding
defer/asyncattributes to JS) to reduce overall loading time.
Through this analysis, you can precisely identify the core bottleneck resources and time-consuming phases during page loading, enabling targeted optimization of frontend resources, backend interfaces, or network configurations.
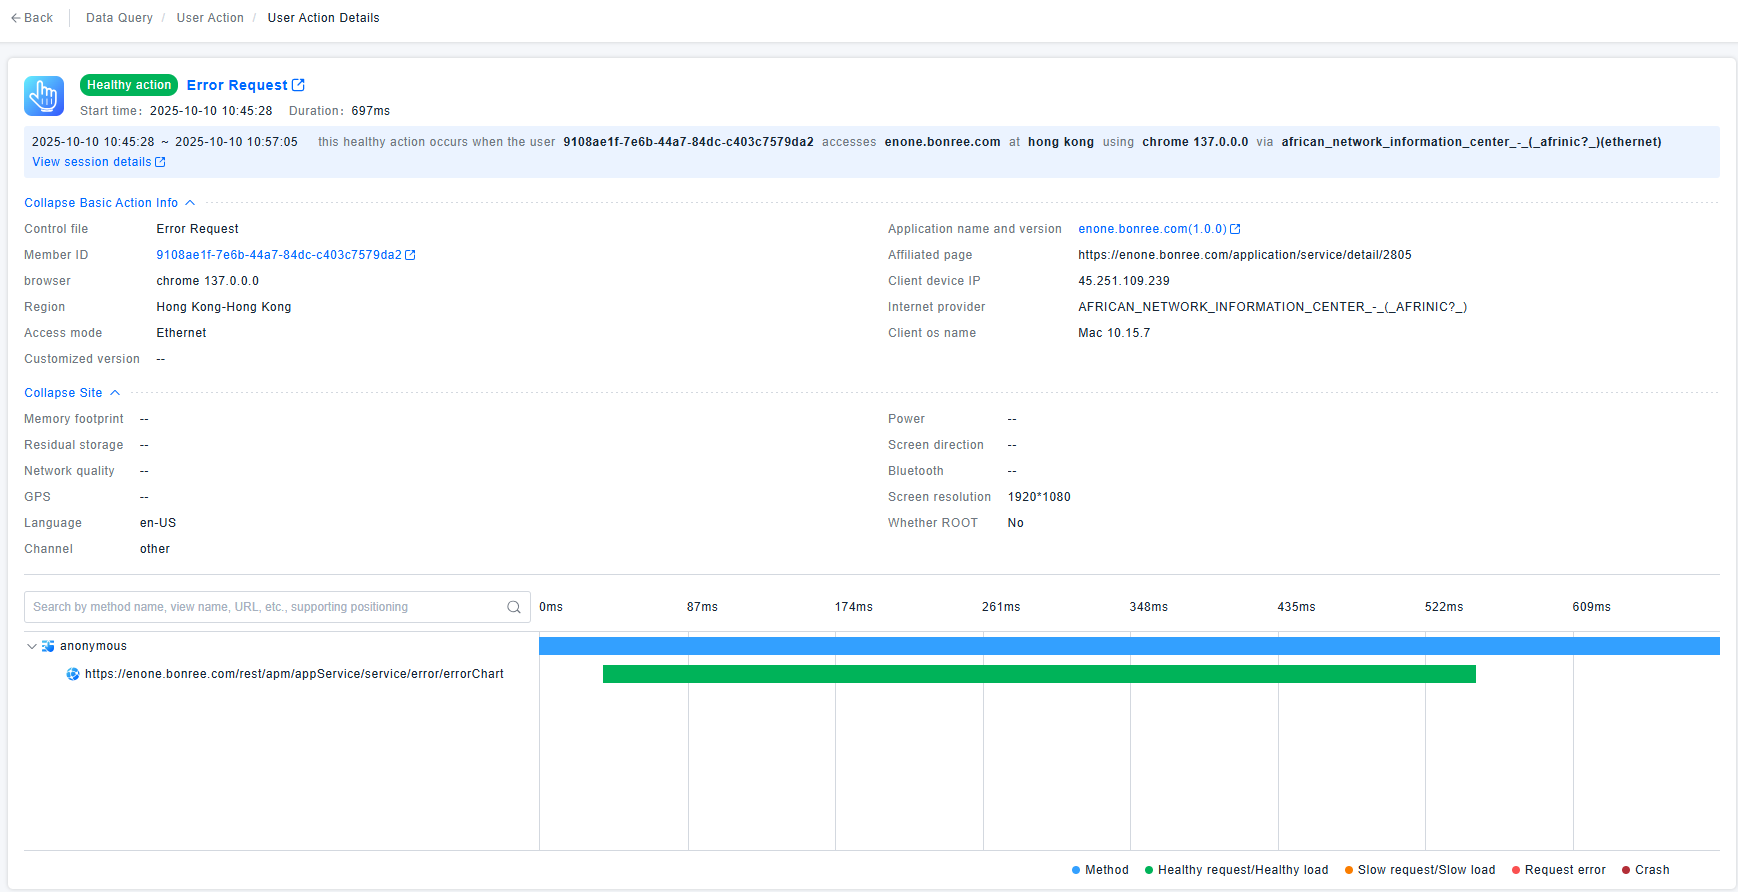
User Action Record
Shows the Network Requests triggered by the user action and their status. You can click to view detailed analysis.
The horizontal axis uses ms as the unit, representing the page loading timeline from left to right (0ms to 609ms). Each time point corresponds to the initiation, execution, and completion phases of different requests, helping you identify the time distribution of requests.
-
The "anonymous" at the top represents the action that triggered the page load (such as a user click event).
-
The requests below represent the chain of network requests triggered by this action:Green entries**: Normal network requests
Performance Analysis Logic
- Identify Time-Consuming Peaks: Observe which time period has the widest request bars, indicating the most time-consuming requests that should be the primary focus for performance optimization.
- Analyze Anomaly Propagation: If red requests appear in critical paths, investigate their impact on subsequent requests (e.g., whether they block page rendering).
- Understand Request Dependencies: Analyze the chronological order and hierarchical relationships of requests to determine "which requests have serial dependencies" and "which execute in parallel," thereby optimizing request scheduling logic (such as parallelizing non-dependent requests).
Through these dimensions, you can quickly locate performance bottlenecks (the most time-consuming requests) and anomalies (failed/erroneous requests) during page loading, providing direction for frontend optimization or interface debugging.