Issues
In system operations and stability assurance, continuously monitoring collected exception data is a critical link in safeguarding system health. However, when a flood of independent exception events pours in, operations teams often find themselves trapped in a "sea of noise"—struggling to quickly filter key problems and define troubleshooting priorities, leading to delayed response times and compromised user experience.
The Issues Analysis function addresses this by automatically grouping repetitive, similar exception events into "Issues". By presenting key information in a structured way and providing efficient management capabilities, it significantly simplifies the debugging process and enhances fault resolution efficiency.
Usage Scenarios
- Assess the Scale of Users Affected by Issues: Clearly displays the number of users and sessions impacted by an issue, aiding in determining severity (e.g., "Only 1% of test users affected" vs. "50% of core users unable to place orders").
- Understand the Occurrence Pattern of Issues: Records the first occurrence time, most recent occurrence time, and duration of an issue, clearly revealing "when it appeared and whether it is still spreading".
- Full Lifecycle Tracking: Supports categorized tracking of Crashes, ANRs, Lags, JS errors, and Custom Exceptions. By marking statuses (e.g., Open, Regressed, In Progress, Resolved, Ignored), it enables collaborative team tracking and prevents issues from being overlooked.
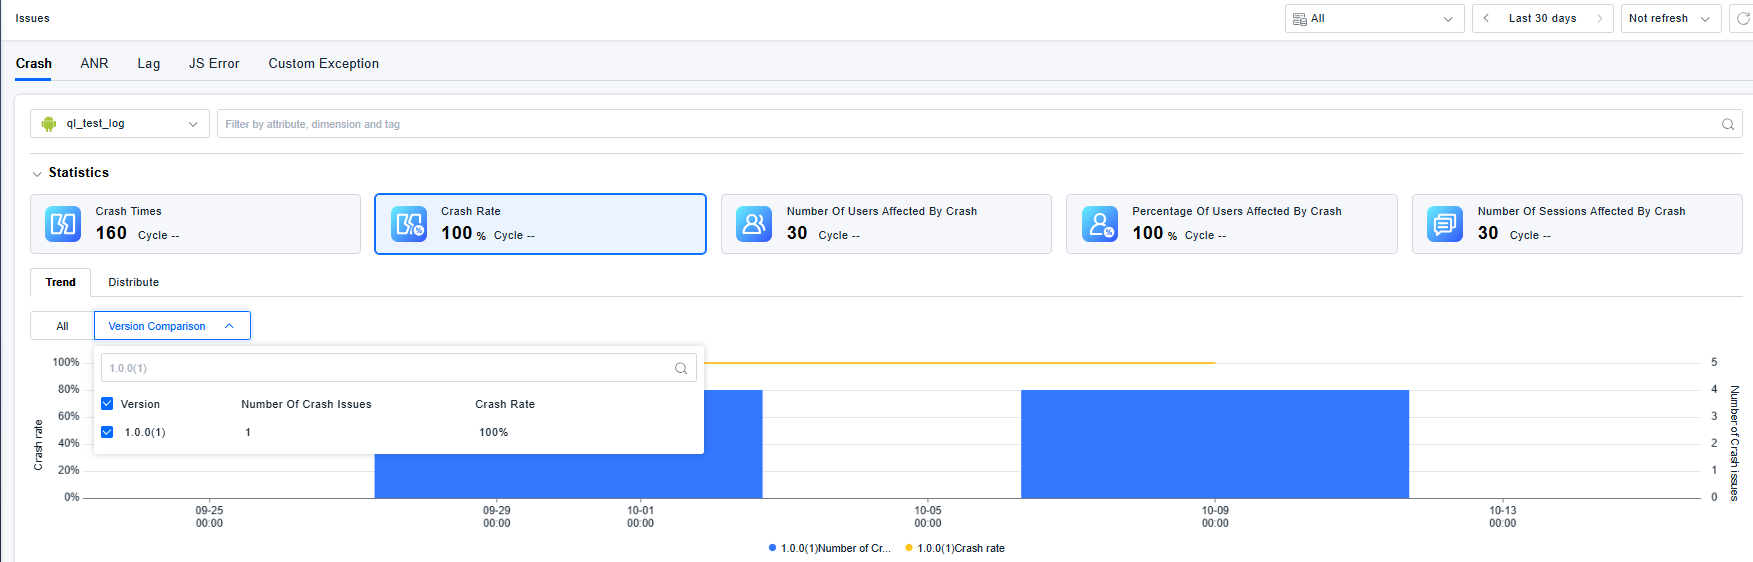
- Trend and Distribution Analysis: Tracks the evolution of an issue through trend charts, clearly showing "when the issue first appeared and peak occurrence periods". Version analysis helps determine if an issue disappeared with a version iteration, while also verifying the effectiveness of a fix, e.g., the issue occurrence rate dropping from 10% to 0.1% after resolution.
Getting Started
Currently, supported Issue types include Crash, ANR, Lag, JS error, and Custom Exception. The available types vary by application type as follows:
| Application Type | Issues |
|---|---|
| Android | Crash, ANR, Lag, JS error, Custom Exception |
| HarmonyOS NEXT | Crash, AppFreeze,Lag, JS error, Custom Exception |
| iOS | Crash, Lag, JS error, Custom Exception |
| Web Application | JS error, Custom Exception |
| WeChat MiniProgram | JS error, Custom Exception |
| TikTok MiniProgram | JS error, Custom Exception |
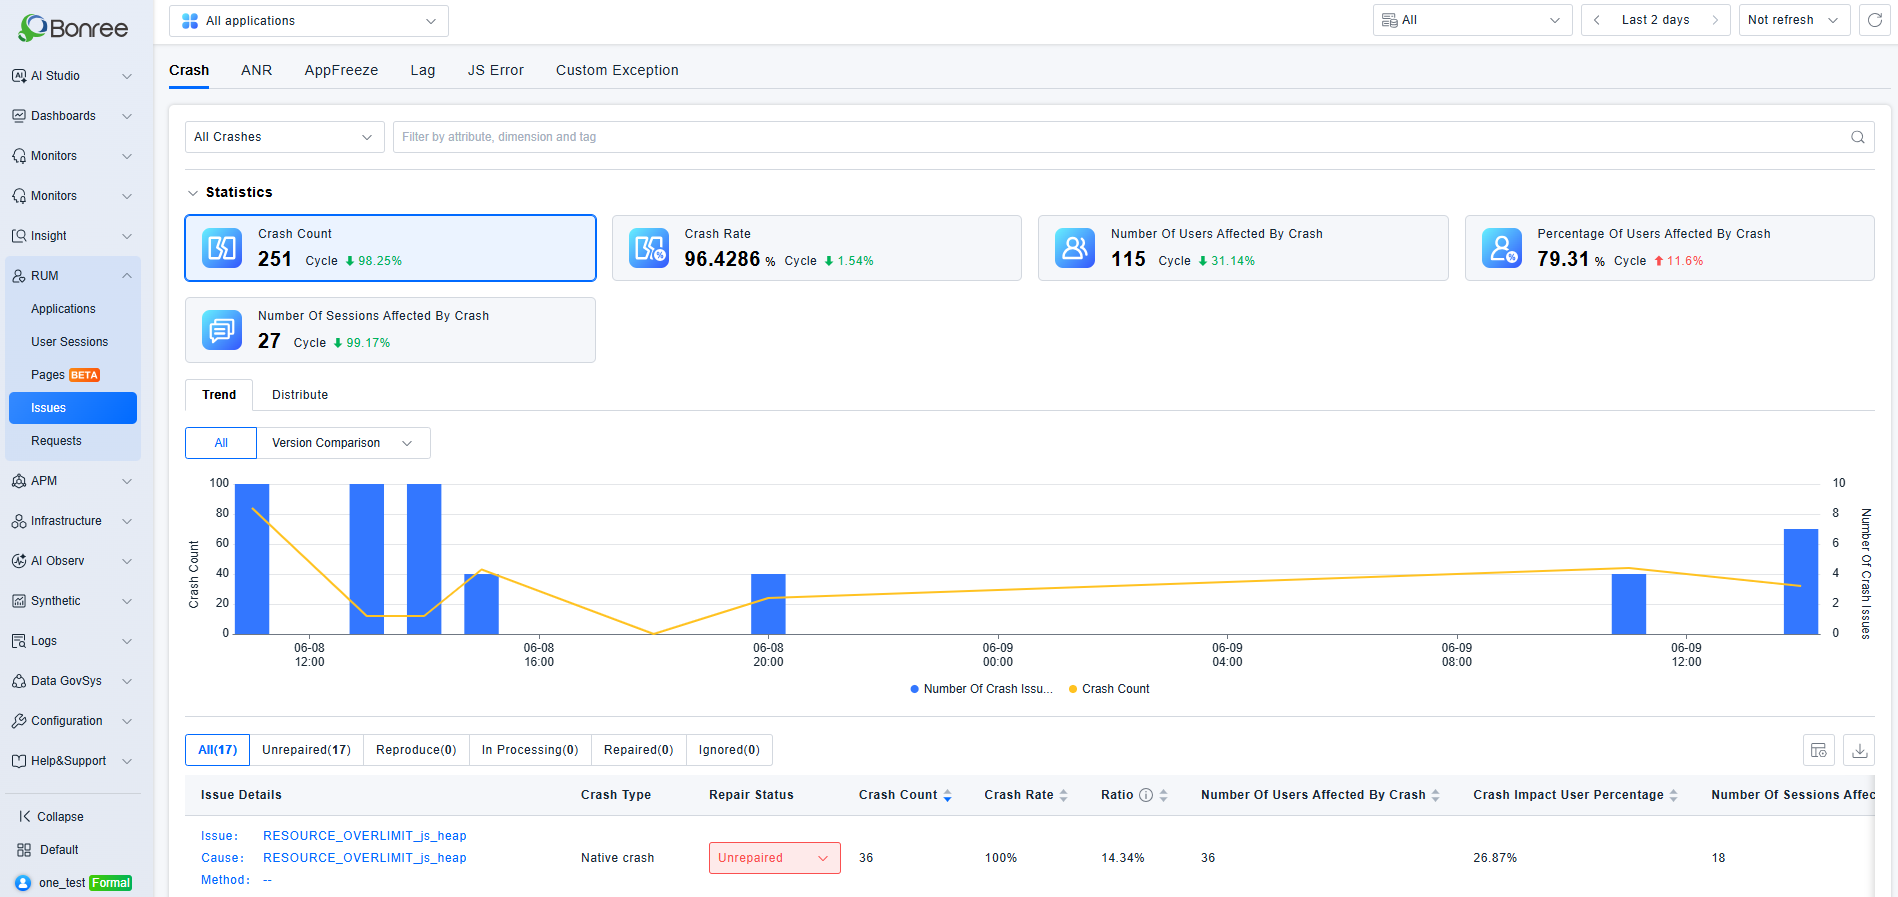
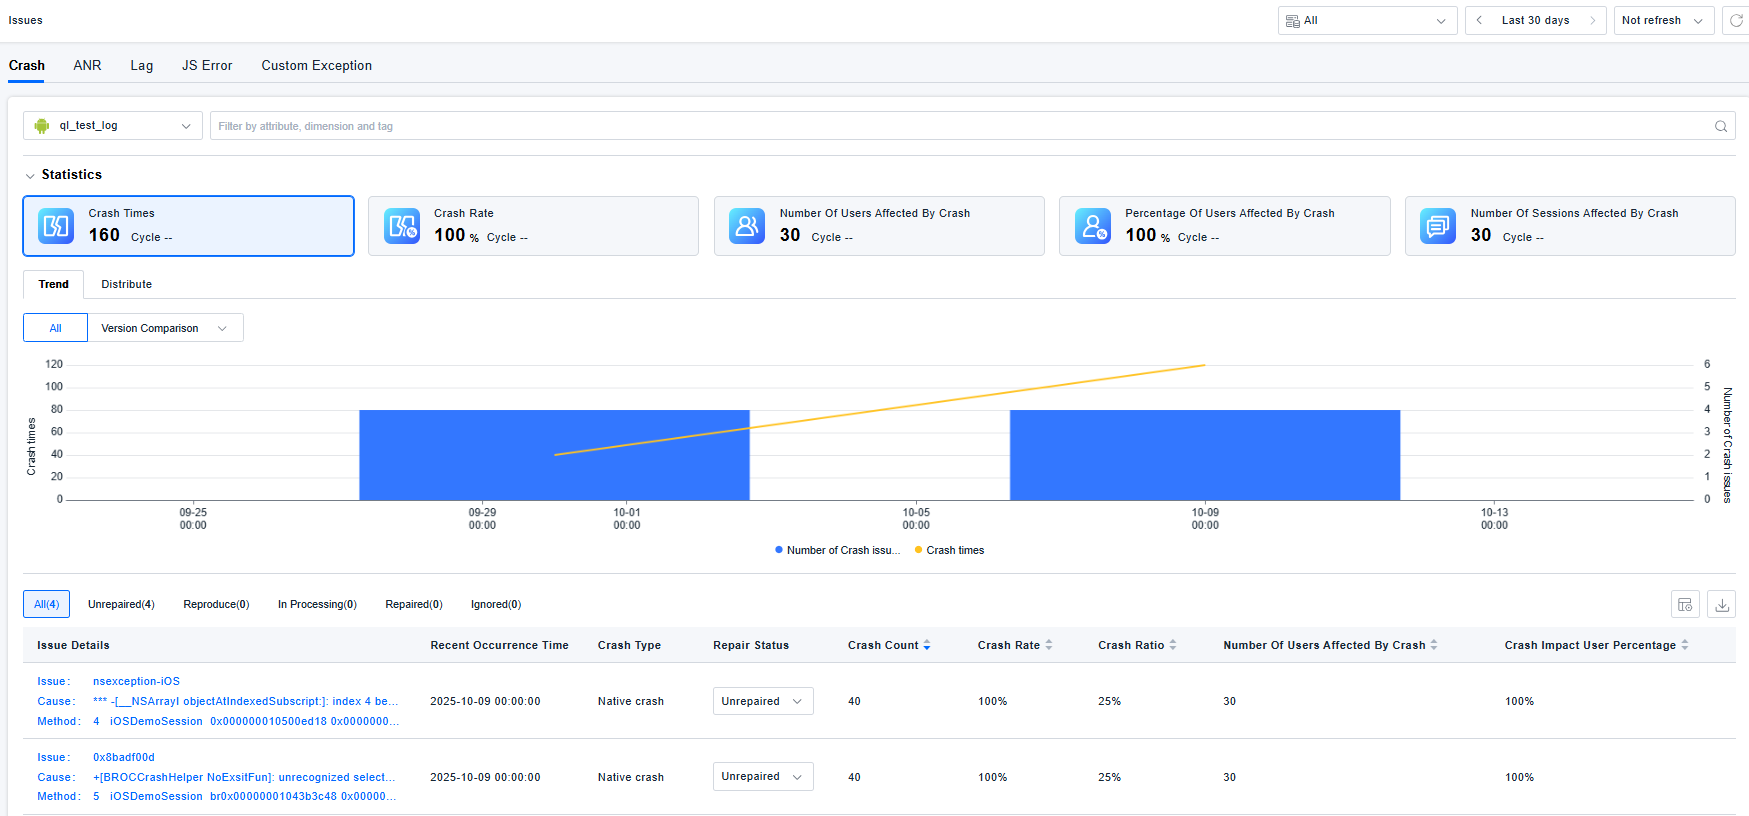
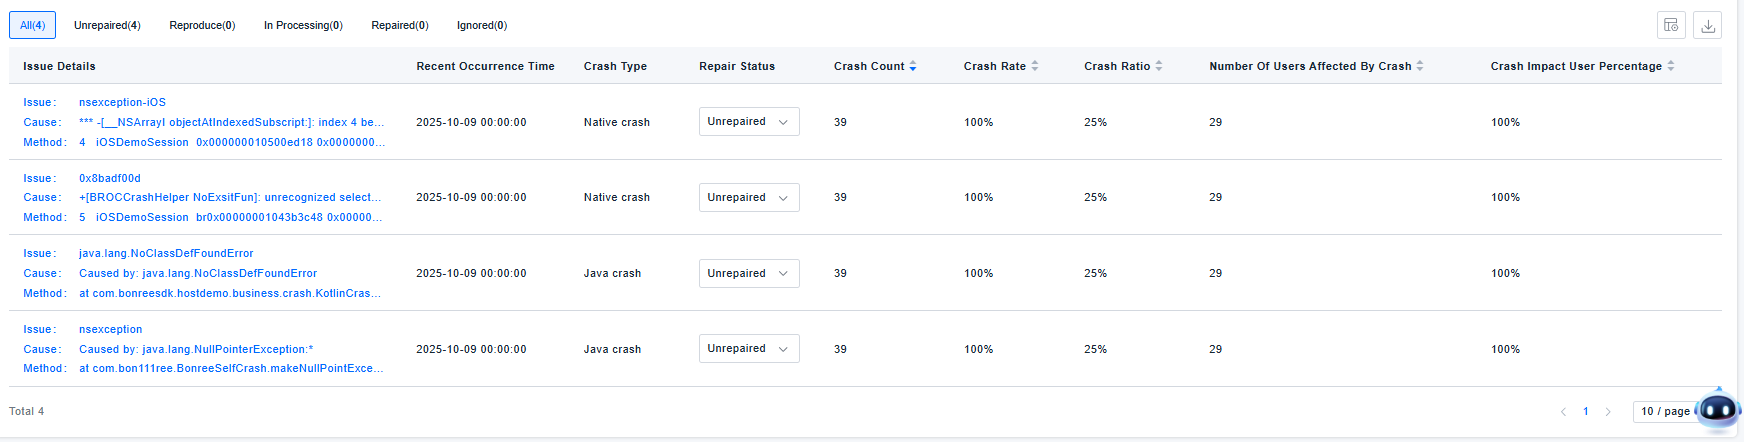
You can switch between tabs to view the corresponding Issue types. For example, under the Crash tab, you can view crash statistics, metric trends and distribution charts, and a list of specific crash issues for a selected application. You can filter crash issues based on attributes, dimensions, and tags.
Interaction Guide
-
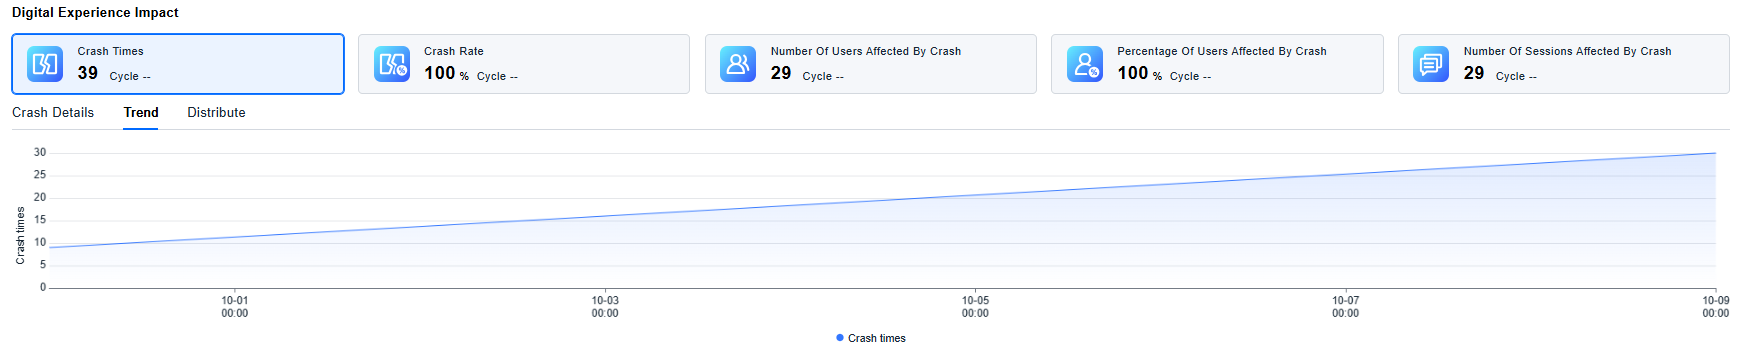
Trend Chart: Click on the metric cards above the chart to switch the displayed trend metric. Click and drag to select a specific time range on the trend chart; the view will update to show metrics for the selected period. Supports comparing trends across different versions.
-
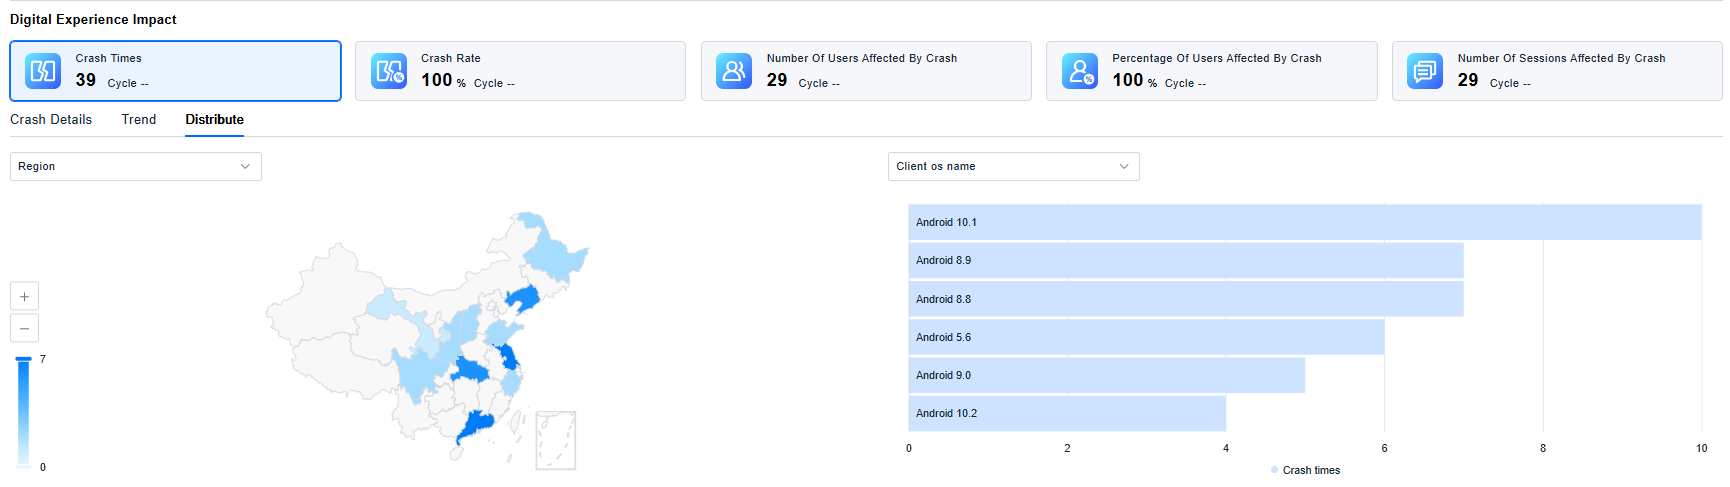
Distribute: Click on segments of the map or bars in the chart to add filter conditions, enabling more granular analysis and filtering of the issue list.
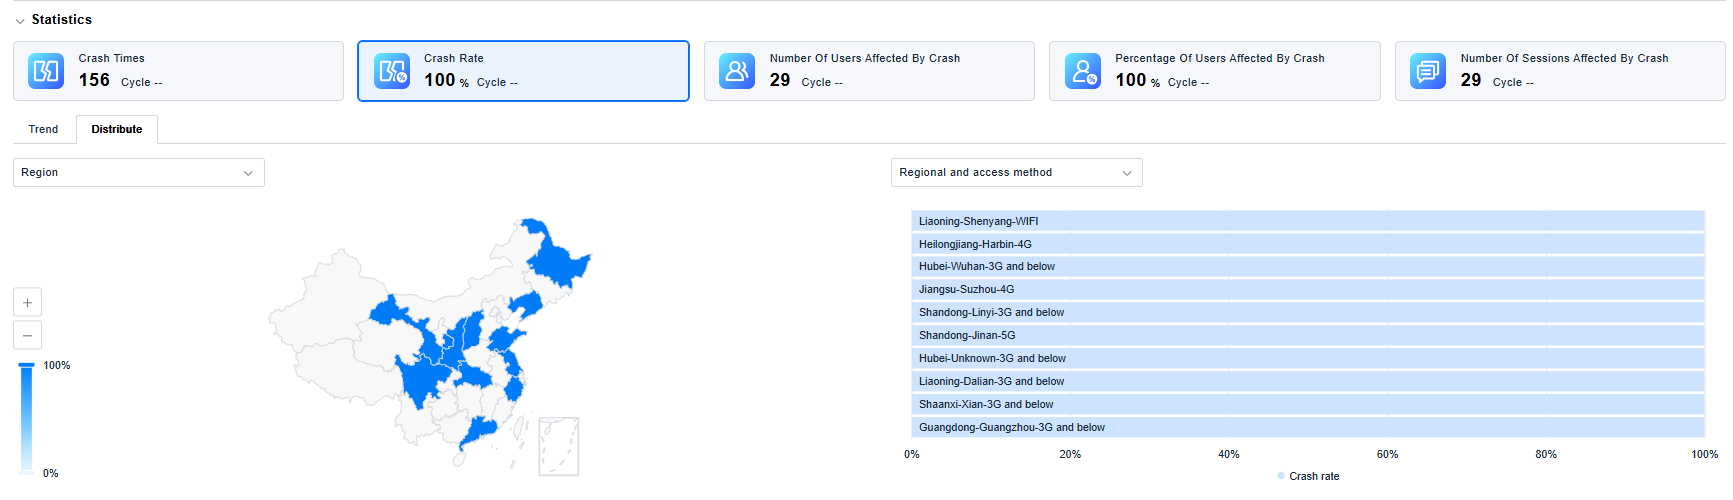
-
Issues List: Supports customizing visible columns and exporting data. Displays issue summary, crash type, status, occurrence count, crash rate, crash percentage, number of affected users, and percentage of affected users to determine the impact scope and severity.
Clicking on a specific issue leads to the Issue Details page. Here you can view the issue summary, characteristics, RUM impact details, and a list of individual crash instances, along with trends and distributions for this specific issue. This helps determine if the issue is concentrated under specific scenarios, aiding in root cause identification. Collaboration features like comments and action logs are available for team coordination.
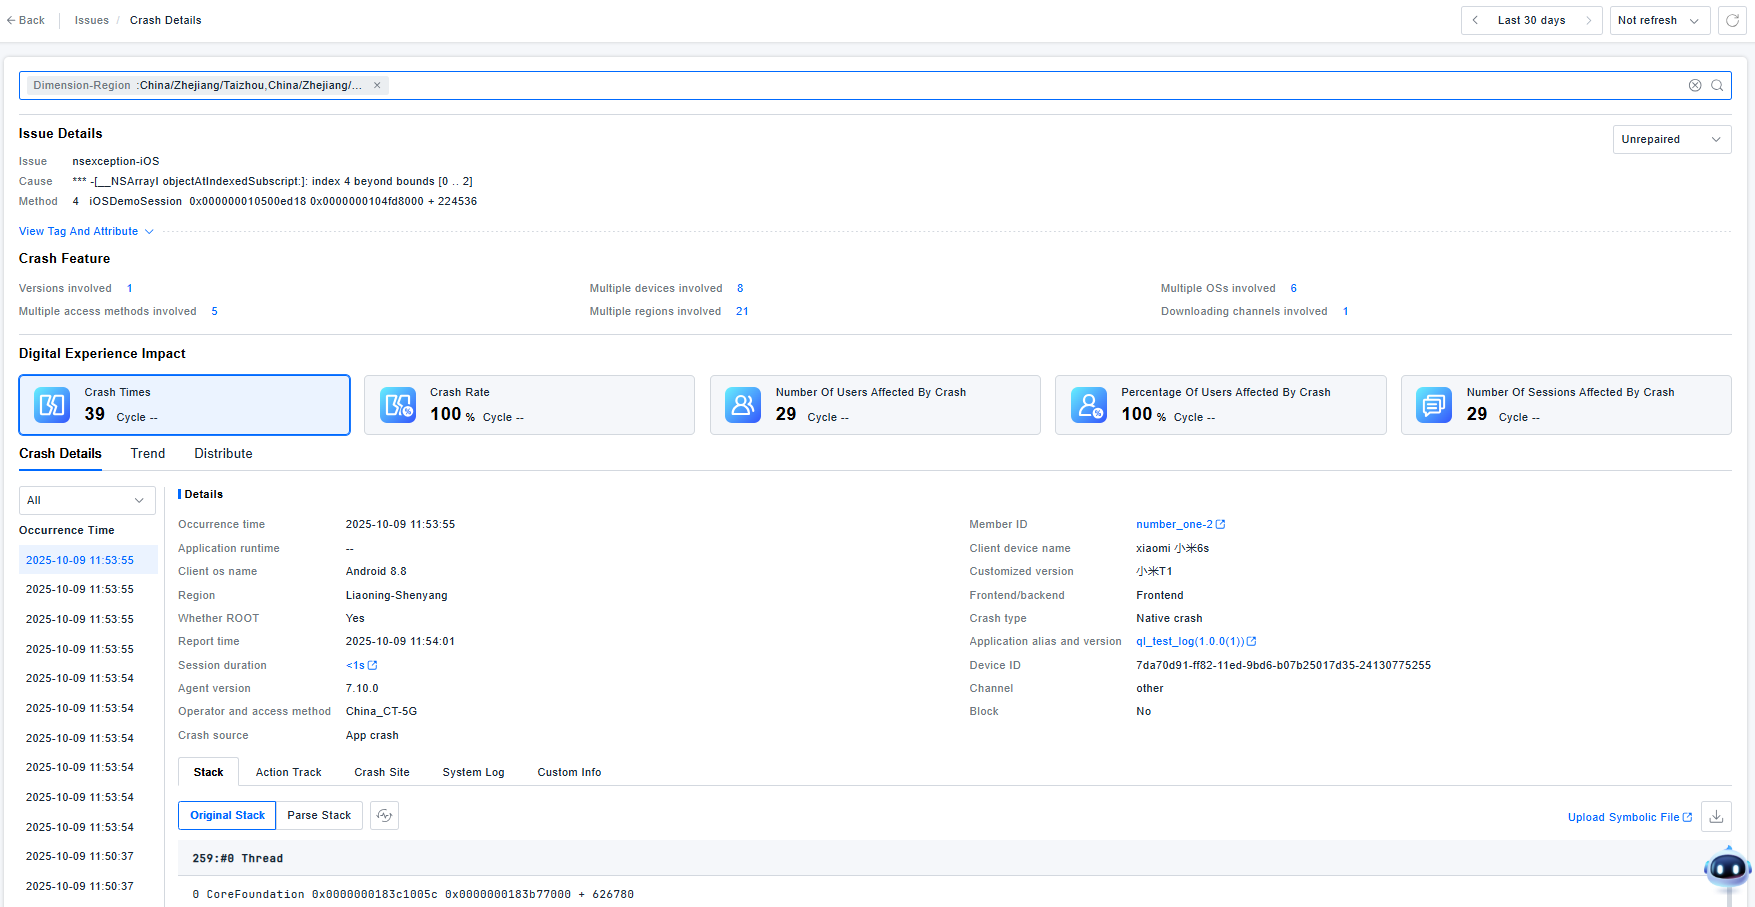
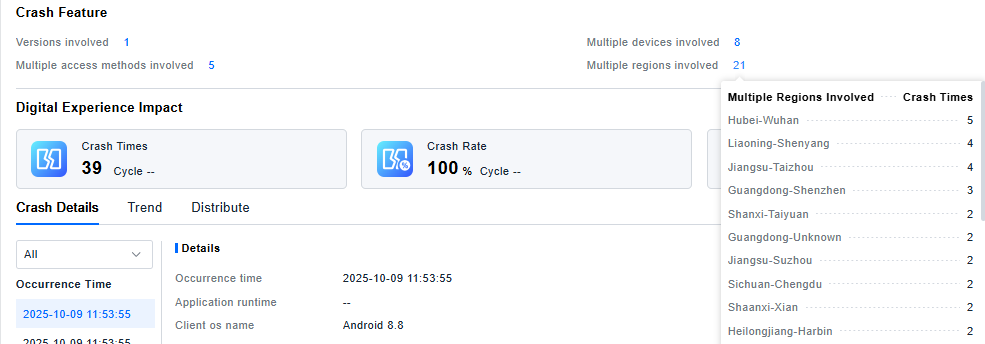
You can view the number of affected versions, devices, operating systems, access methods, regions, and download channels. Hovering over the numbers displays detailed statistics.
 The Crash Instances list shows all individual crash records for this specific issue. Supports viewing crash details, stack traces, user action paths, crash context, system logs, and custom information, consistent with the details available in Data Query.
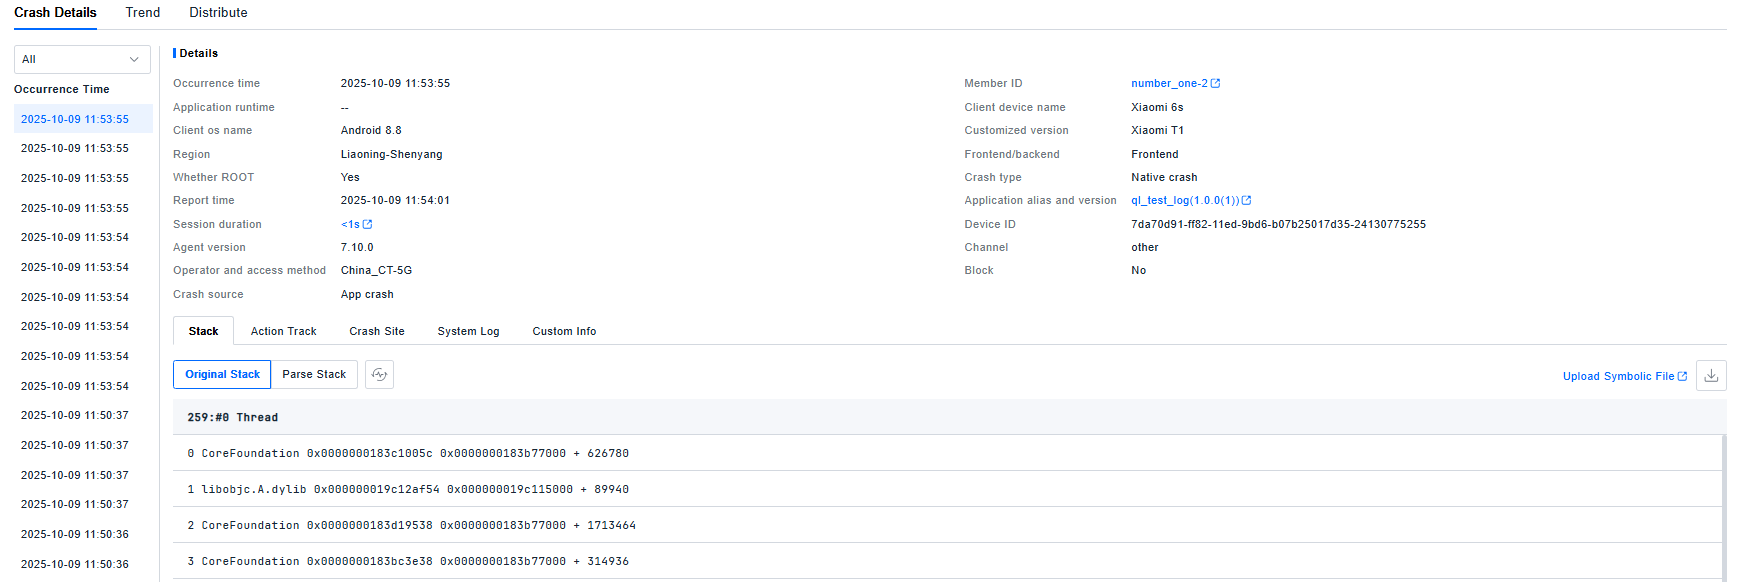
The Trends and Distributions section analyzes the selected RUM impact metrics. The interaction logic is the same as on the main Issues list page.
The usage and analysis flows for ANR, AppFreeze,Lag, JS Error, and Custom Exception are identical to those described for Crash, and therefore will not be repeated here.