Pages
Users' perception of digital products is essentially "the complete process of a page load/interaction." For example, opening an e-commerce homepage, submitting an order page, or viewing a payment result page - the "loading speed, presence of lag, and normal operability" of each page directly determine user satisfaction. Isolated metrics detached from the "page" context (e.g., "an API response time of 200ms") cannot directly reflect user experience. Only by using the "page" as the carrier and correlating technical metrics like API calls, resource loading, and frontend rendering with "user behavior on that page" (e.g., button clicks, dwell time) can we determine whether "technical issues are genuinely impacting users."
For details on page definition and identification, refer to Pages.
Usage Scenarios
- Page Performance Troubleshooting: Track metrics like First Screen Load Time, White Screen Duration, and Resource Load Delays to identify slow loading bottlenecks (e.g., uncompressed large images, slow API responses). Identify anomalies such as page lag, crashes, and JS errors, and reconstruct the user's action path and environmental context when errors occurred.
- User Experience Optimization: Monitor the loading sequence of page elements (e.g., whether critical content loads first), optimize loading strategies to improve perceived speed, and analyze UX differences across regions and browser types to resolve compatibility issues in specific areas or browsers.
- Business Scenario Implementation: Core business pages (e.g., e-commerce, payment): Monitor page response speed during checkout and payment processes to reduce drop-off rates caused by poor experience. Post feature launch: Compare page performance and user behavior data before and after deployment to verify if new features impact experience. Marketing campaign pages: Track page access stability and load success rates during campaigns to ensure smooth operation.
- Long-term Performance & Experience Monitoring: Establish page performance baselines and set alert thresholds (e.g., trigger alert if First Screen Load exceeds 3 seconds) for early warning of potential issues. Continuously track optimization effectiveness, using data trends to evaluate the impact of improvements (e.g., reduction percentage in White Screen Duration after optimization).
Page List
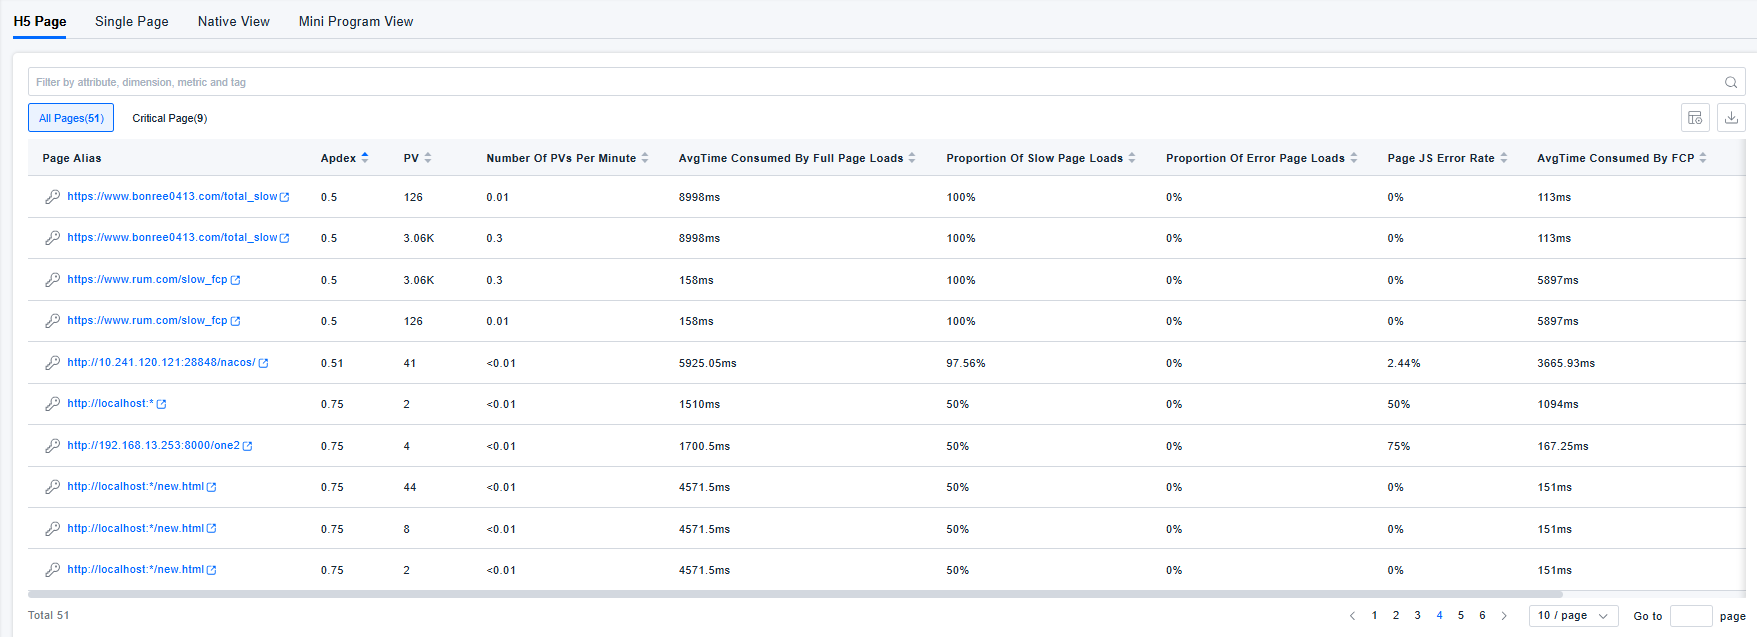
Display all pages that have reported metrics within the selected time range, filtered by application. Supports filtering by attributes, dimensions, and tags. Allows customizing table headers and exporting. For H5 pages, single-page applications, native views, and mini-program views, the business request error rate only includes requests triggered by the page itself.
Page Details
Displays the page's performance overview, actions, call relationships, metrics, and alerts.
- Alert-related content (including but not limited to the unresolved alert severity level on the Overview tab and the Alerts tab) is available only when the new alerting module is in use.
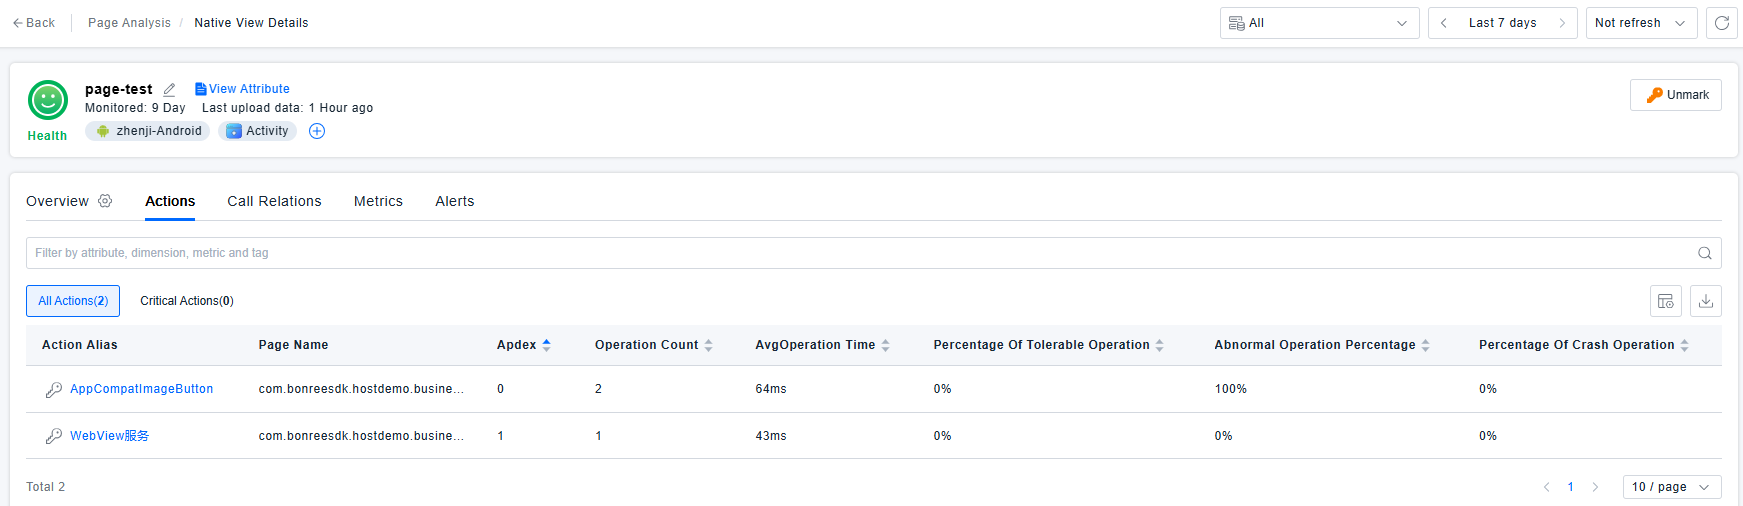
- The Actions tab is available only for native views and mini-program views.
- Navigation to related records is not supported for mini-program views and single-page application details.
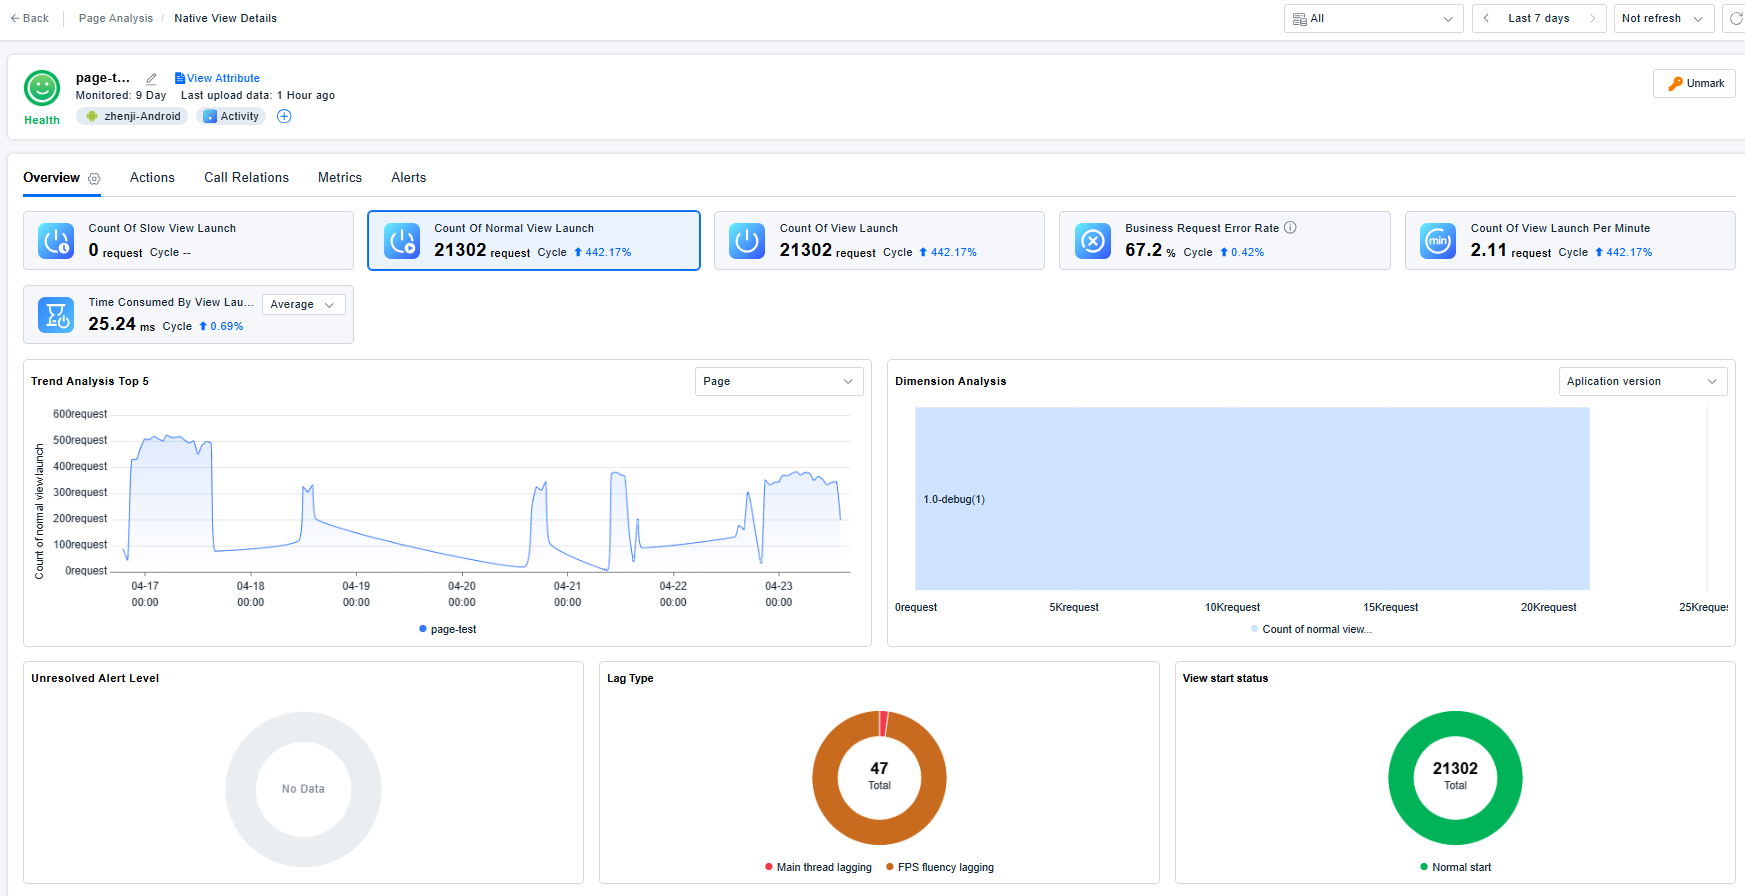
Overview
- Click the settings icon on the right side of the Overview section to configure which metric cards are displayed.
- After selecting a metric card, you can view its trend analysis and dimension analysis, and click to drill down to the corresponding records. In trend analysis and dimension analysis, for the dimensions of page, endpoint application, user group, and owning page, the alias is used if available; otherwise, the originally reported dimension value is used.
- Unresolved alert severity level: Displays the distribution of unresolved alert severity levels for the application and page. Click to drill down to the Alerts tab for more details.
- Freeze type / JS error type: Displays the distribution of different types. Click to drill down to code issues.
- View startup status / H5 page load status: Displays the distribution of different statuses. Click to drill down to the Query Center.
Actions
Actions associated with native views and mini-program views:
- Action B triggered on page A without navigating to a new page → Action B is attributed to page A.
- Action B triggered on page A that navigates to a new page C → Action B is still attributed to page A and will not be attributed to page C.
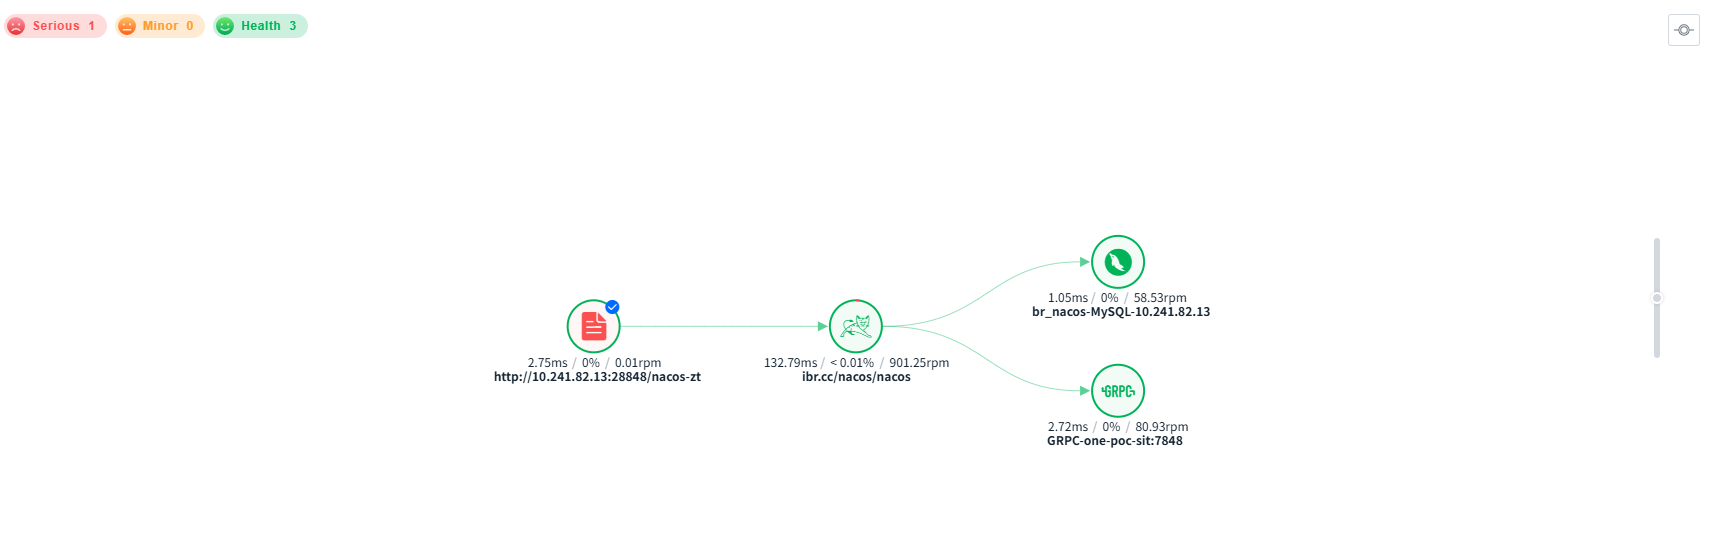
Call Relations
For H5 pages, single-page applications, native views, and mini-program views, the services displayed in the call relationship diagram are only those that are associated with requests triggered by the page itself and satisfy end-to-end monitoring (request tracing enabled).
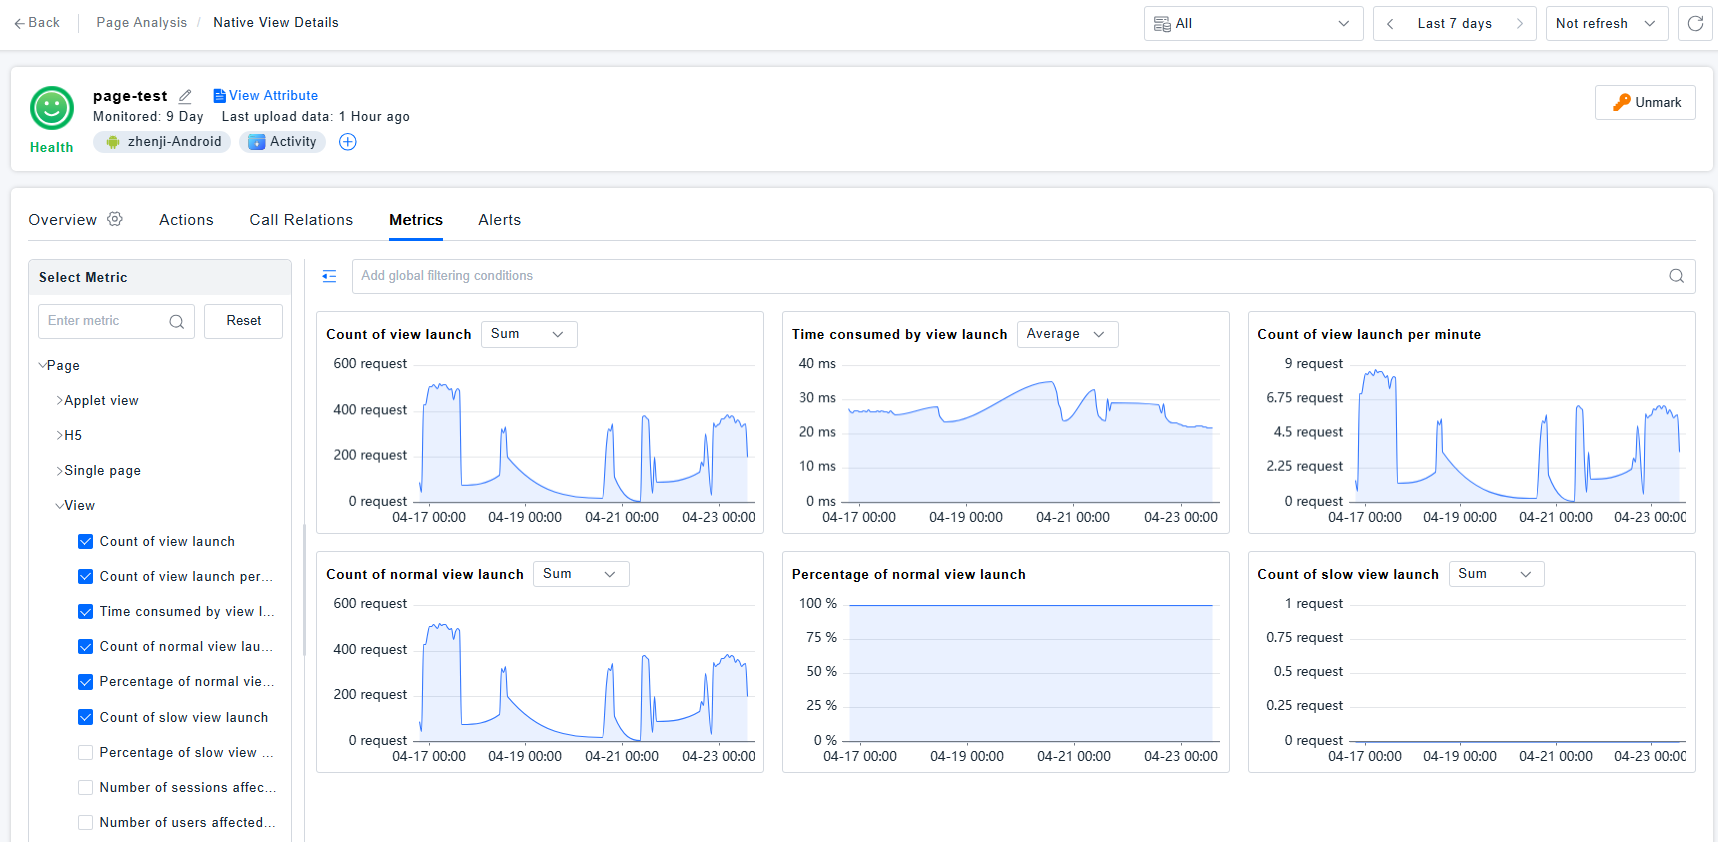
Metrics
- Preset metrics: The metric set is determined based on the preset metrics repository under the "page" category. The metrics displayed on the page details page are the intersection of that set with the metrics currently effective in the resource domain's metric system. Only existing metrics under the current metric system, along with their categories, are shown.
- Custom metrics: If the related entity has a page, custom metrics are displayed according to the currently effective metric system and its categories.
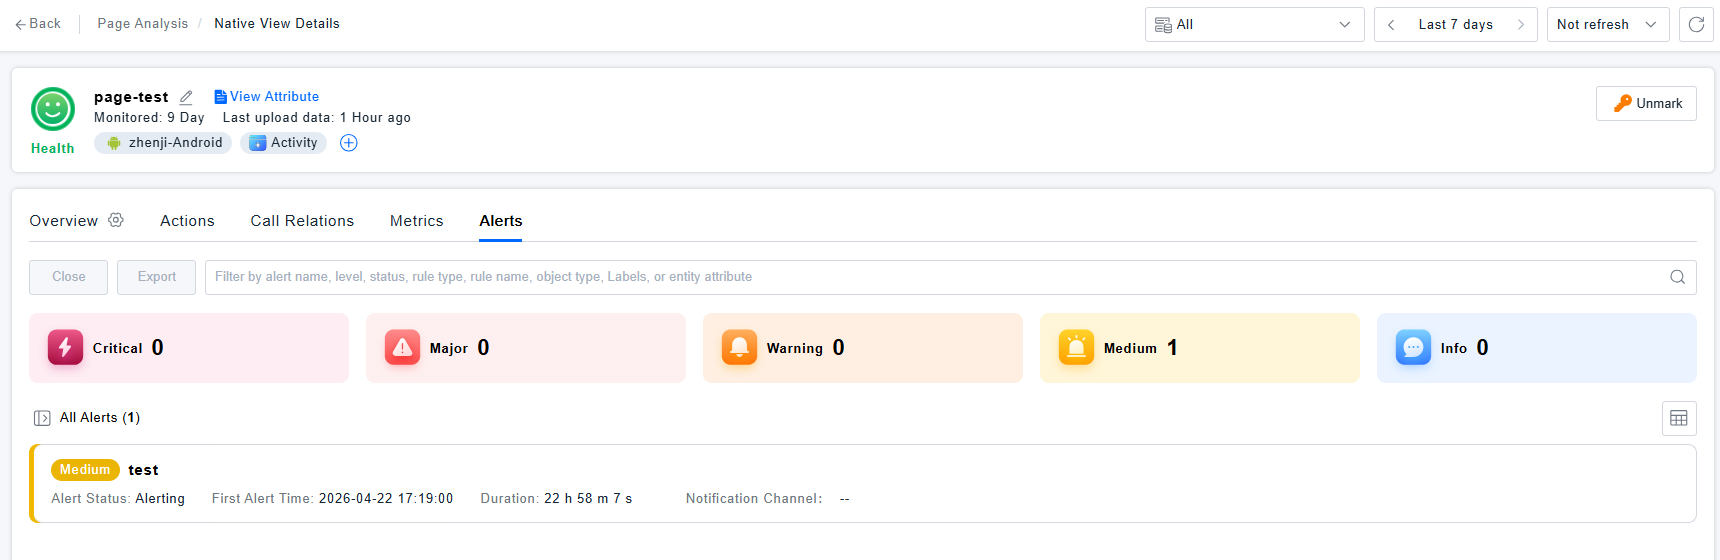
Alerts
Alerts for a page in Digital Experience refer to the following:
- If an alert rule selects a metric from the "page" category of the preset metrics system, and groups by "page" and "endpoint application" (with optional additional dimensions), then the alert is considered a page alert.
- If a non-page metric is selected, but grouping includes "page" and "endpoint application" (with optional additional dimensions), it is not counted as a page alert.
Supplementary Notes
Requests triggered by the page itself include:
- A network request triggered directly by page A itself. The request is associated with the page and is attributed to page A, marked as triggered by the page itself.
- Action A triggers page B, and page B triggers network request C. Network request C is associated with page B and marked as triggered by the page itself.