Traces
The integrated analysis of Application Performance Monitoring (APM) and Real User Monitoring (RUM) enables accurate association between frontend requests of web and mobile applications and corresponding backend traces. This integration capability allows you to view frontend user experience data and backend service performance data comprehensively from a unified perspective, without switching between multiple tools to grasp full-link information.
With frontend data provided by RUM (such as User Actions, Page loading delays) and backend service metrics and link tracing information obtained through Trace ID injection, you can quickly locate issues in any part of the technology stack and clearly restore the actual abnormal scenarios and experience bottlenecks encountered by users.
Usage Scenarios
- Full-link Localization of Slow Response Issues Reported by Users: For example, on the RUM side, it is identified that the network request
/api/order/submittriggered by clicking the "Submit Order" button takes 6.8 seconds, and the corresponding TraceID of this request is obtained. By associating the TraceID with the APM side, it is found that the order processing interface in the backend service calls the inventory verification service, and the inventory service takes 5.5 seconds due to database lock waiting. Finally, the root cause of the problem is located as "unreasonable indexing of the inventory table leading to lock contention". - End-to-end Performance Optimization of Core Business Processes: For the core process of "user browsing products to completing payment", full-link observability is achieved through Trace integration. For example, the RUM side finds that the average jump time from "order submission" to "payment completion" is 5 seconds. Through Trace, it is found on the APM side that the payment interface calls the risk control service, and the rule engine of the risk control service performs 12 redundant verifications when processing new user orders, taking 4.2 seconds, thereby optimizing the risk control rules.
- Rapid Attribution of Cross-end Issues: For example, after the application releases a new version, RUM detects that the Apdex index of the new user registration process drops from 0.9 to 0.6. By filtering new user sessions on the RUM side, it is found that the failure rate of the registration interface
/api/user/registerincreases from 0.1% to 8%. Through TraceID tracking, it is found that the newly added "mobile phone number risk verification" service in the backend of the new version calls a third-party interface, and this interface returns a format error due to version compatibility issues, resulting in blocking of the registration process.
Getting Started
Enable Frontend-backend Integration
Entry: Configuration/Settings/Data Collection/Request Tracing/Frontend Application
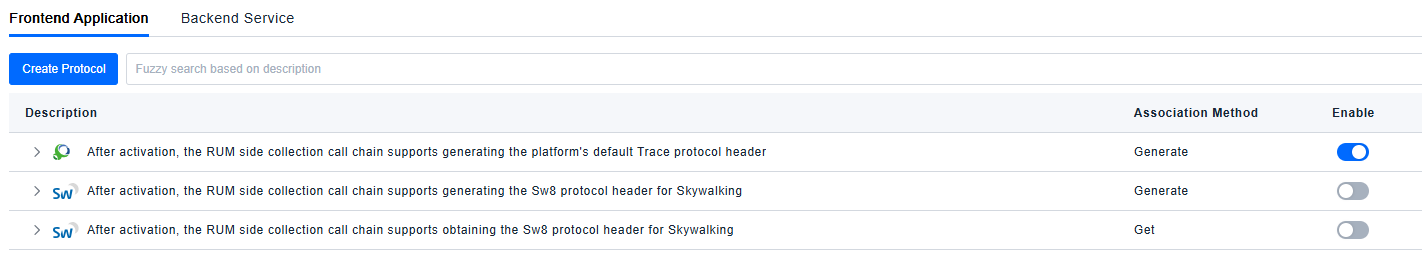
If end-to-end integration with Bonree APM is required, enable "After enabling, all Trace collected on the RUM side support generating the default Trace protocol header of the platform". At this time, whether to insert the request header information of Bonree in the Trace, the format is: version "-" trace-id "-" parent-id "-" trace-flags.
If end-to-end integration with Skywalking is required, enable "After enabling, all Trace collected on the RUM side support generating the Sw8 protocol header of Skywalking" and "After enabling, all Trace collected on the RUM side support obtaining the Sw8 protocol header of Skywalking". At this time, whether to insert the request header information of the Sw8 protocol in the Trace, the format is: "Sample"-"trace-id"-"segment-Id"-"Parent span Id"-"Parent service"-"Parent service instance"-"Parent endpoint"-"Peer". At the same time, when the Trace information of SkyWalking is transmitted to Bonree RUM, it supports obtaining the information of the Sw8 protocol header for mapping.
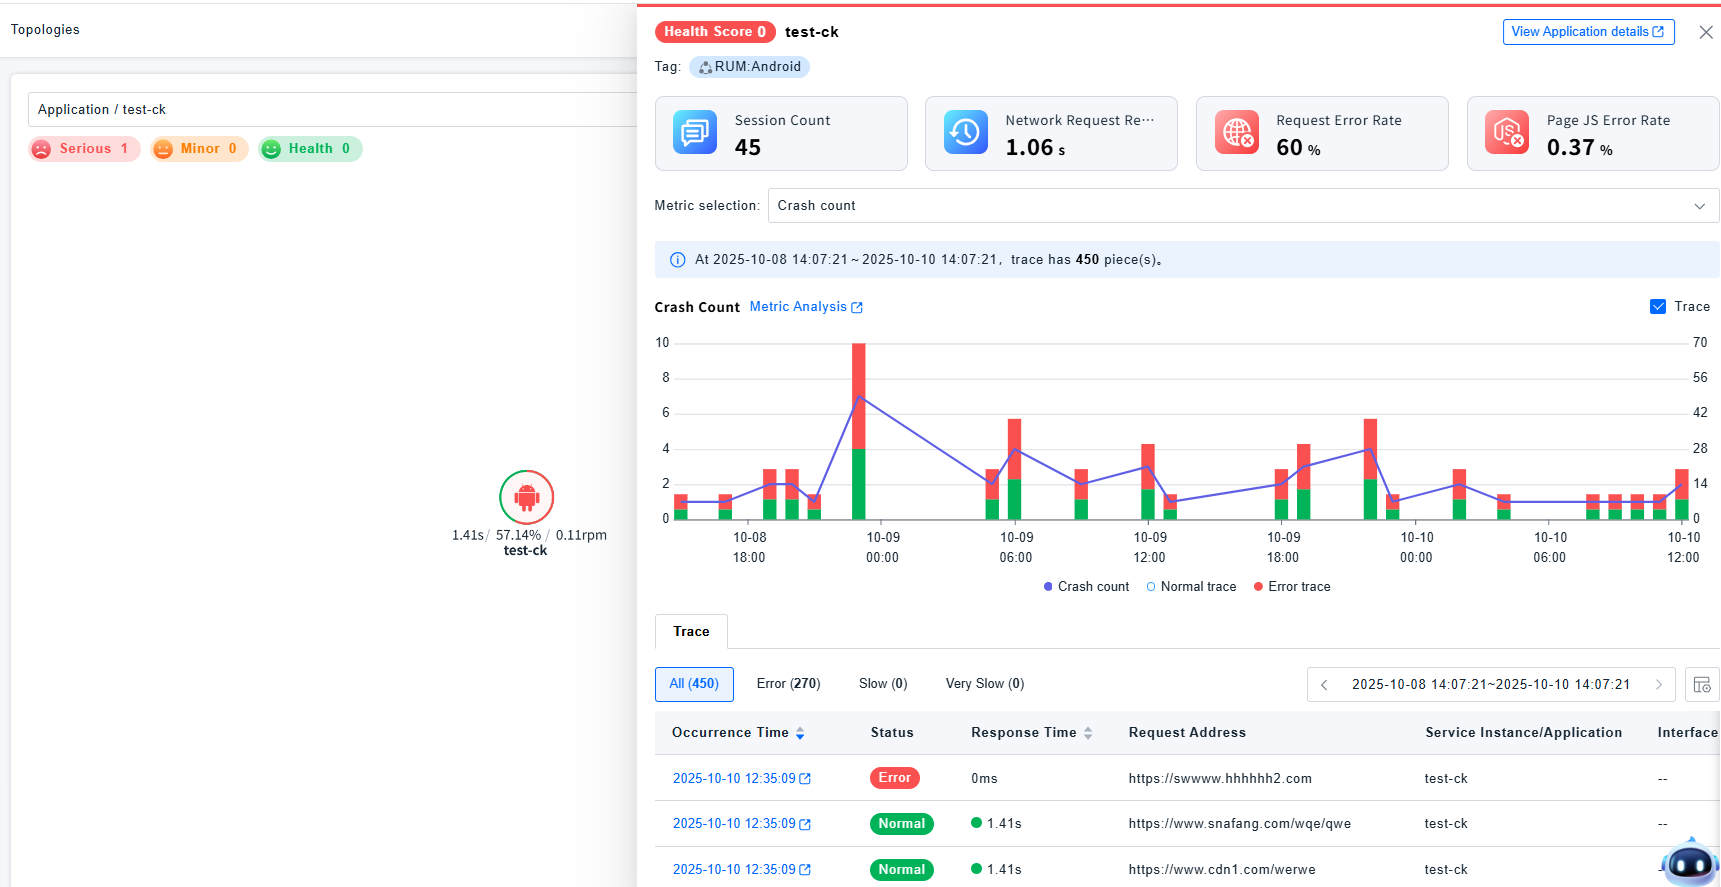
Global Topology
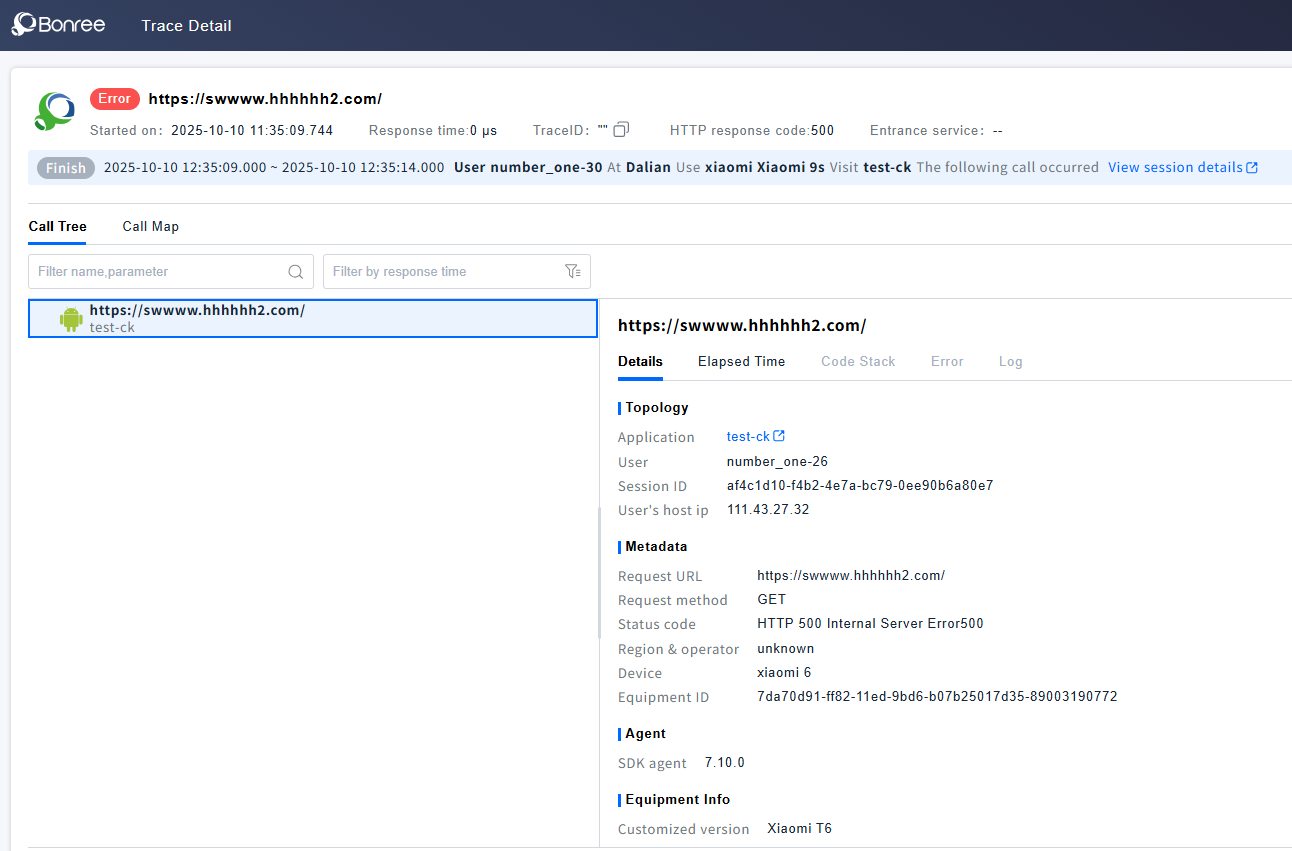
The global topology can display the call relationship between applications and backend service components. Clicking on an application node allows you to view the list of associated Traces. For detailed introduction of Traces, navigate to Trace.
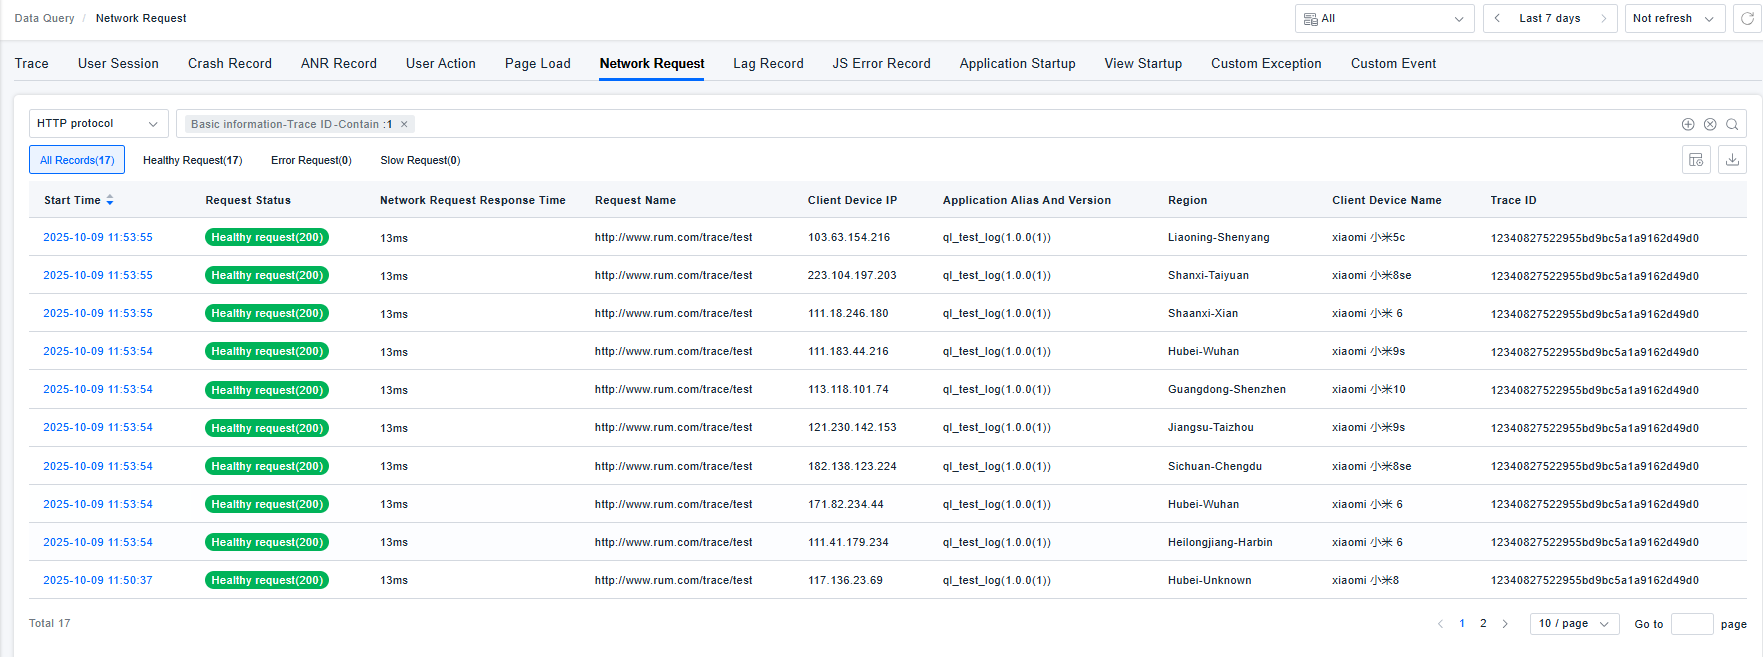
Network Request Associated with Trace
The TraceID can be viewed on the network request list and detail page. Clicking on it can jump to the Trace detail page.