trace
In the performance monitoring and fault troubleshooting of distributed systems, microservice architectures, and complex monolithic applications, Call Chains (also known as Trace Chains) are core technologies that connect all execution nodes of a user request throughout its entire lifecycle. By recording the complete call path, execution status, and latency of a request from "entry to exit", they solve the "call black box problem" in distributed environments. The core value of call chains lies in "breaking the information silos of call paths and enabling full-process observability", with specific roles summarized into 4 categories:
-
Visualization of full-link execution paths to solve the "path black box": In a microservice architecture, a single user request (e.g., "order placement") typically passes through multiple nodes such as "API Gateway → Order Service → Inventory Service → Payment Service → Database". Traditional logs can only record partial information of individual nodes and cannot connect the full process. Call chains visually present the entire request flow, making the end-to-end path clear at a glance.
-
Accurate localization of performance bottlenecks to break down the "latency black box": When an interface responds slowly (e.g., "order placement interface takes 500ms"), traditional monitoring can only show the "total latency" but cannot break down the "latency proportion of each node". Call chains record the execution latency of each call node (e.g., "Gateway forwarding: 10ms → Order Service processing: 100ms → Inventory Service call: 200ms → Payment Service call: 150ms → Database operation: 40ms") and quickly locate bottlenecks through "latency sorting" and "heat mapping" (e.g., marking nodes with latency exceeding thresholds in red).
-
Rapid tracing of fault root causes to solve the "fault black box": In distributed systems, faults often present as "chain reactions" (e.g., "Payment Service timeout → Order Service call failure → User order error"). Logs from a single service can only show "its own error" and cannot trace the fault source. Call chains use "link status association" (e.g., marking failed nodes in red and warning nodes in yellow) to trace backward from the "final error node" to the root cause.
-
Unified aggregation of call context to avoid "information silos": During the execution of a request, scattered information is generated, including "business context" (e.g., user ID, order number, request parameters), "system context" (e.g., server IP, service version, thread ID), and "exception context" (e.g., error code, exception stack). Traditional logs require splicing across services and files, which is extremely inefficient. Call chains aggregate this context into a unified view, enabling one-stop access to all relevant information of a request.
Usage Scenarios
-
Fault troubleshooting in microservice/distributed systems: Requests span multiple services and servers. When a fault occurs, multiple alerts are triggered simultaneously (e.g., "Order Service error" and "Inventory Service timeout"), making it impossible to quickly locate the source. Call chains connect scattered fault information to trace the root cause efficiently.
-
Optimization of performance bottlenecks for complex interfaces: Core business interfaces (e.g., "product detail query") respond slowly and involve multiple links such as "local cache → service call → database query → third-party interface". It is impossible to determine which step consumes the most time with traditional methods. Call chains break down latency at each link to identify optimization priorities.
-
Verification of cross-environment call consistency: Interfaces work normally in the test environment but fail occasionally in the production environment (e.g., "order placement works in testing, but some users fail to place orders in production"). The issue cannot be reproduced due to environment differences (data volume, concurrency, dependent service status). Call chains compare request contexts and execution paths across environments to identify environment-specific factors.
-
Sorting out service dependencies and call relationships: The number of microservices is large (e.g., 50+ services), and dependency relationships change continuously with business iterations. Operation and maintenance teams cannot clearly grasp "which services call each other", leading to missed dependent parties during changes. Call chains automatically sort out service call relationships to form an up-to-date dependency map.
-
Distributed tracing and compliance auditing: Industries such as finance and e-commerce need to meet compliance requirements for "request traceability" (e.g., "every payment must record a complete call path for post-event auditing") or track the "full-process operations of abnormal requests" (e.g., "a user complains 'no order received after payment' — need to verify whether the payment was successful and whether the order was created").
Get Started
-
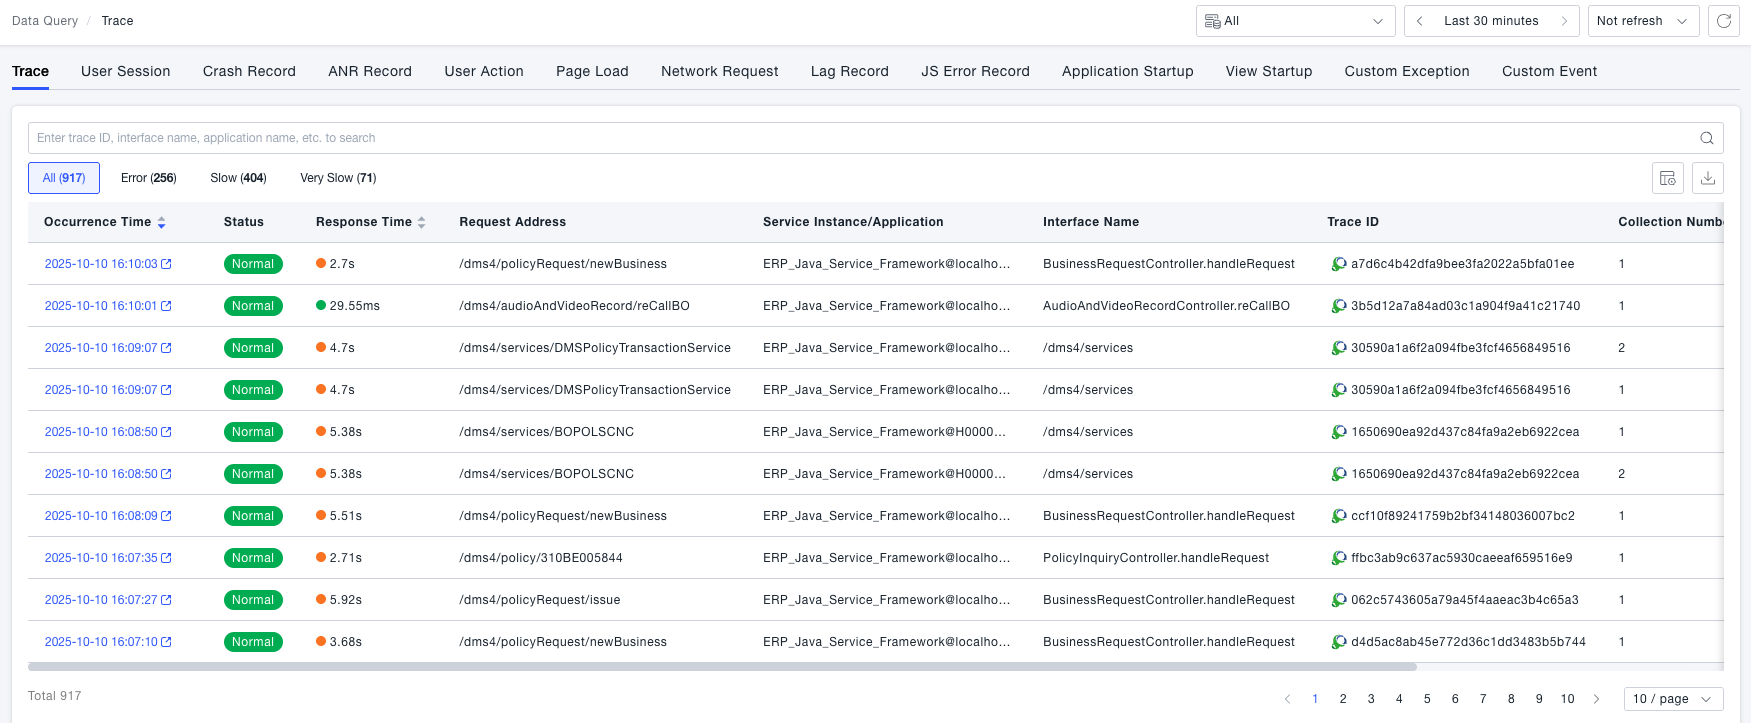
Navigate to the Observability Insights → Search Center → Call Chains page. This page displays the call chain list. Call chains are marked with statuses such as Error, Slow, and Very Slow to enable quick filtering of abnormal call chains.
-
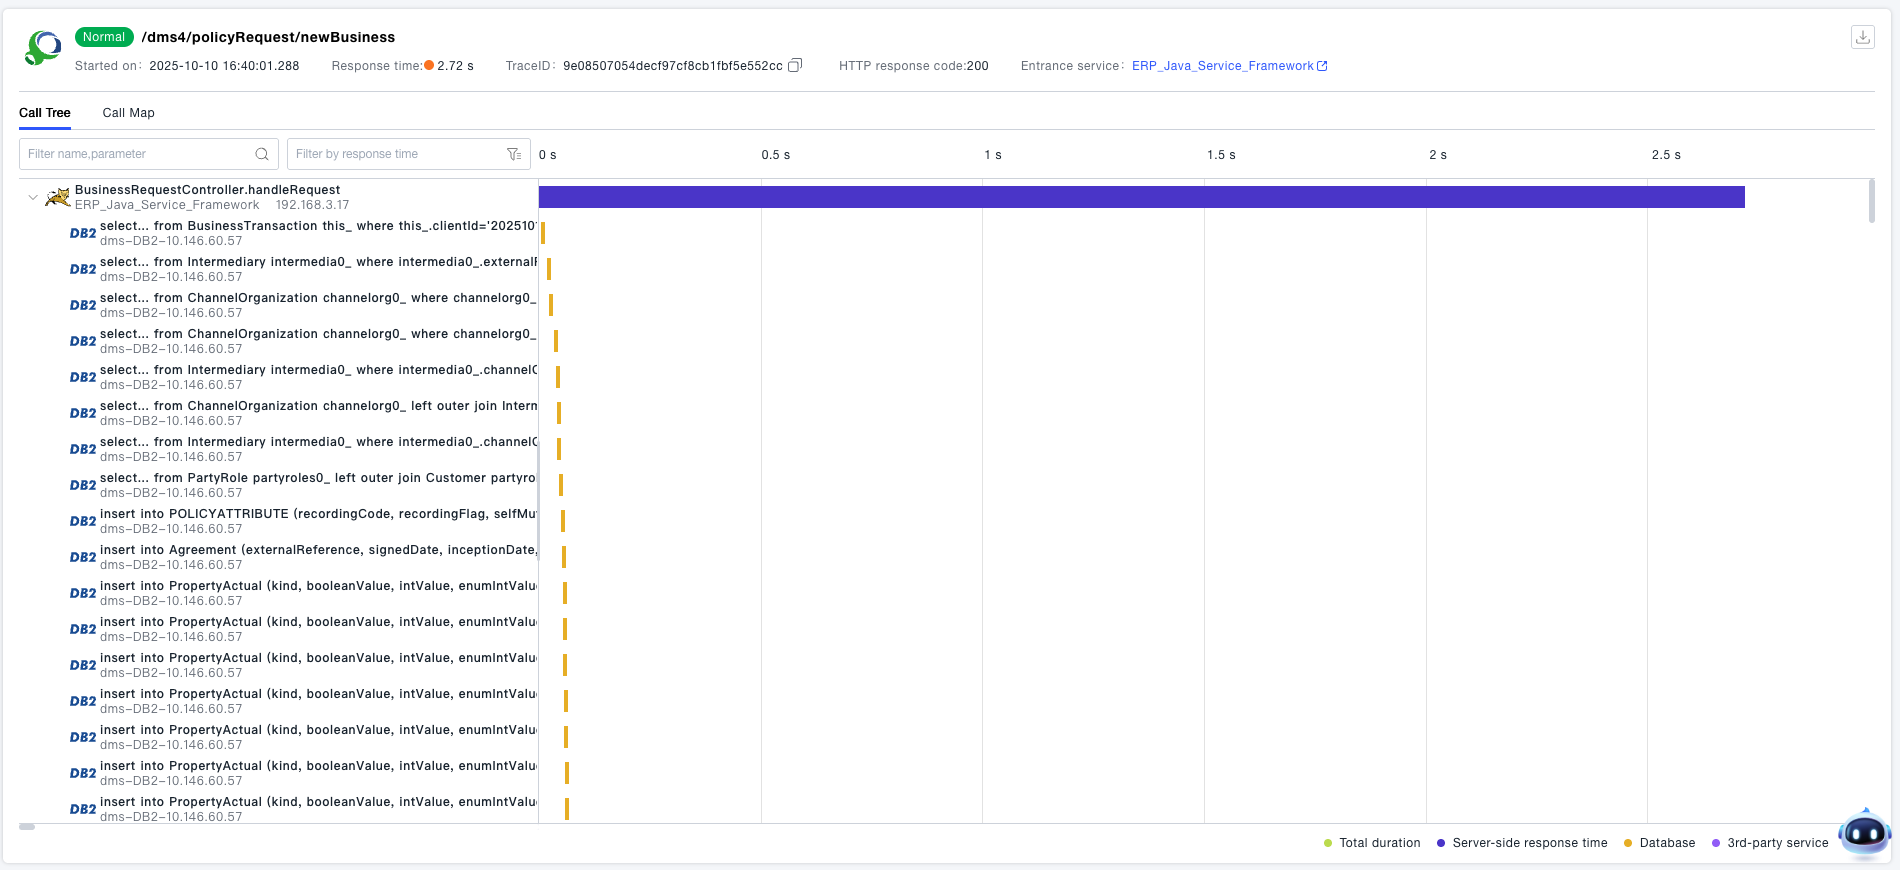
Click a specific call chain to view its details. Call chains support two viewing modes: Waterfall Chart and Tree Chart. The following content focuses on the information displayed in the Waterfall Chart.
Waterfall Chart
-
The call chain details provide an interface-level waterfall chart, which allows quick viewing of the call relationships between interfaces. The horizontal bars on the right side of the call chain clearly indicate the request order and response time of each interface.
-
For long call chains that are difficult to locate, the platform supports quick positioning and filtering. Using the search and filter component, you can quickly locate nodes in the call chain that have the longest self-execution latency, errors, synchronous calls, asynchronous calls, database operations, key methods, message queues, NoSQL operations, or third-party interface calls. You can switch between nodes (up/down) and search by name, URL, SQL, or parameters.
-
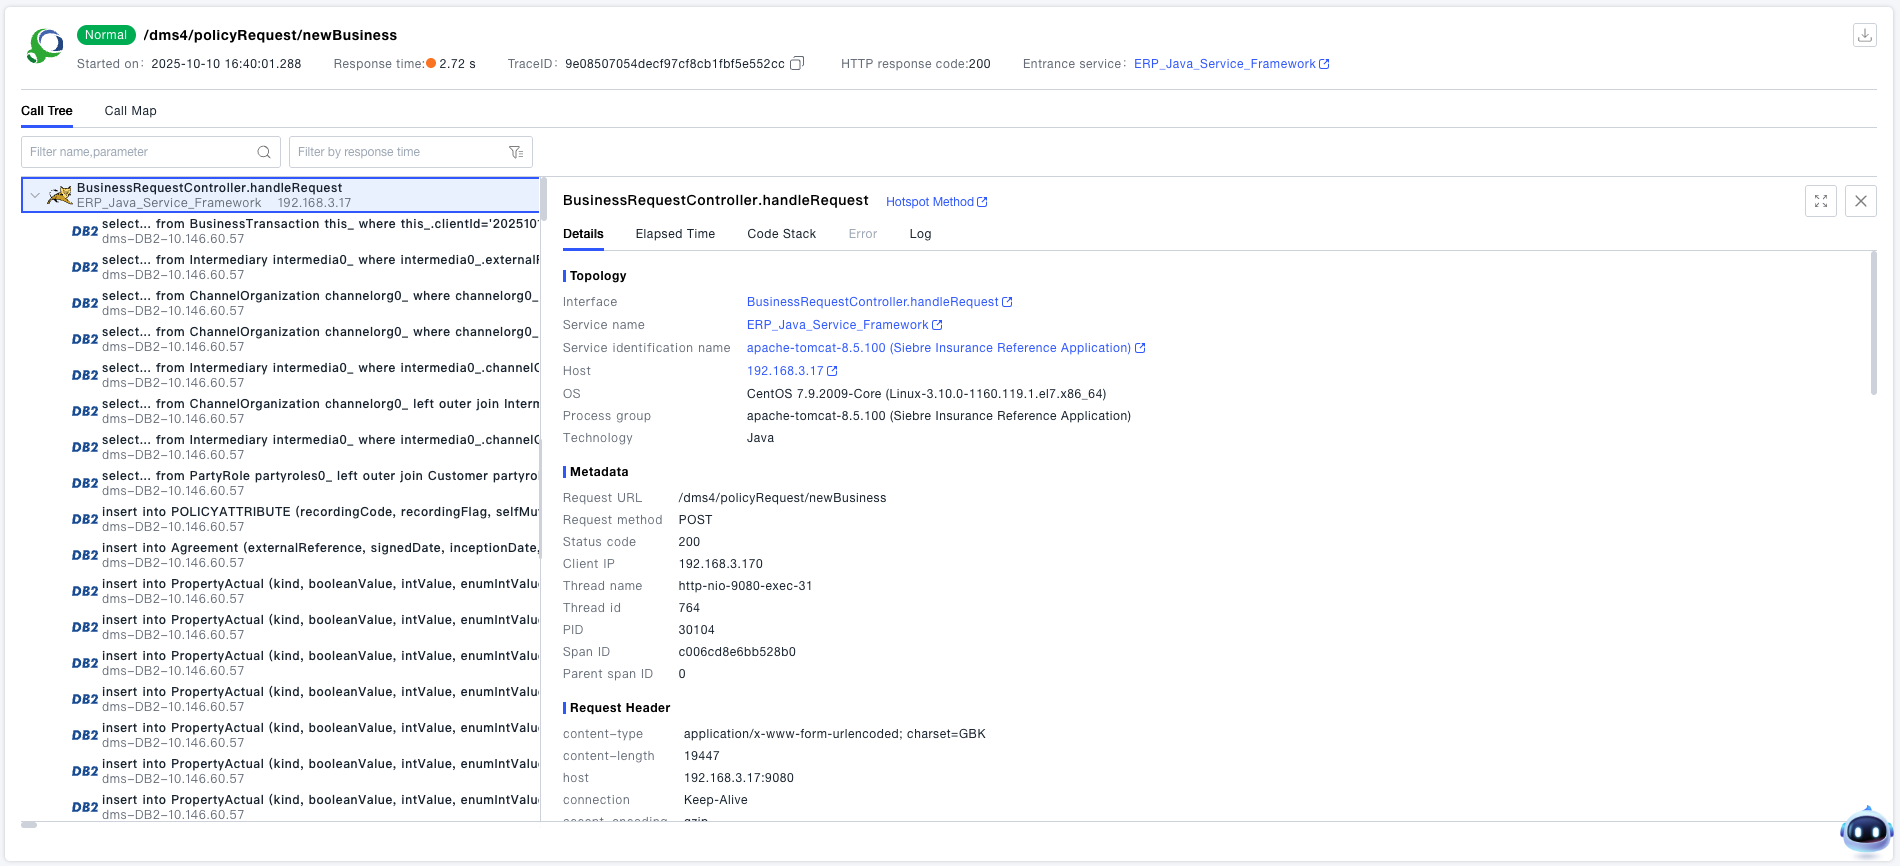
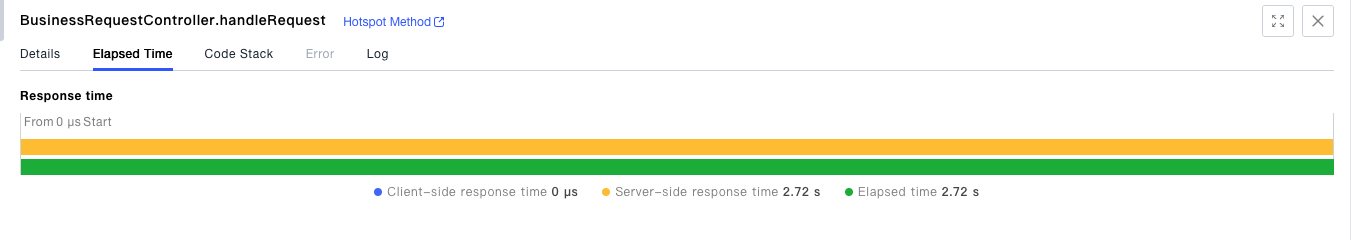
When DEM (Digital Experience Monitoring) and APM (Application Performance Monitoring) are integrated, the first piece of data in the call chain represents the terminal network request. By checking the time difference between the start time of the terminal network request bar and the start response time of the server-side interface, you can quickly determine whether the response latency originates from the server side or the client side:
- You can view detailed information about the object, such as metadata, request headers, response headers, and request parameters.
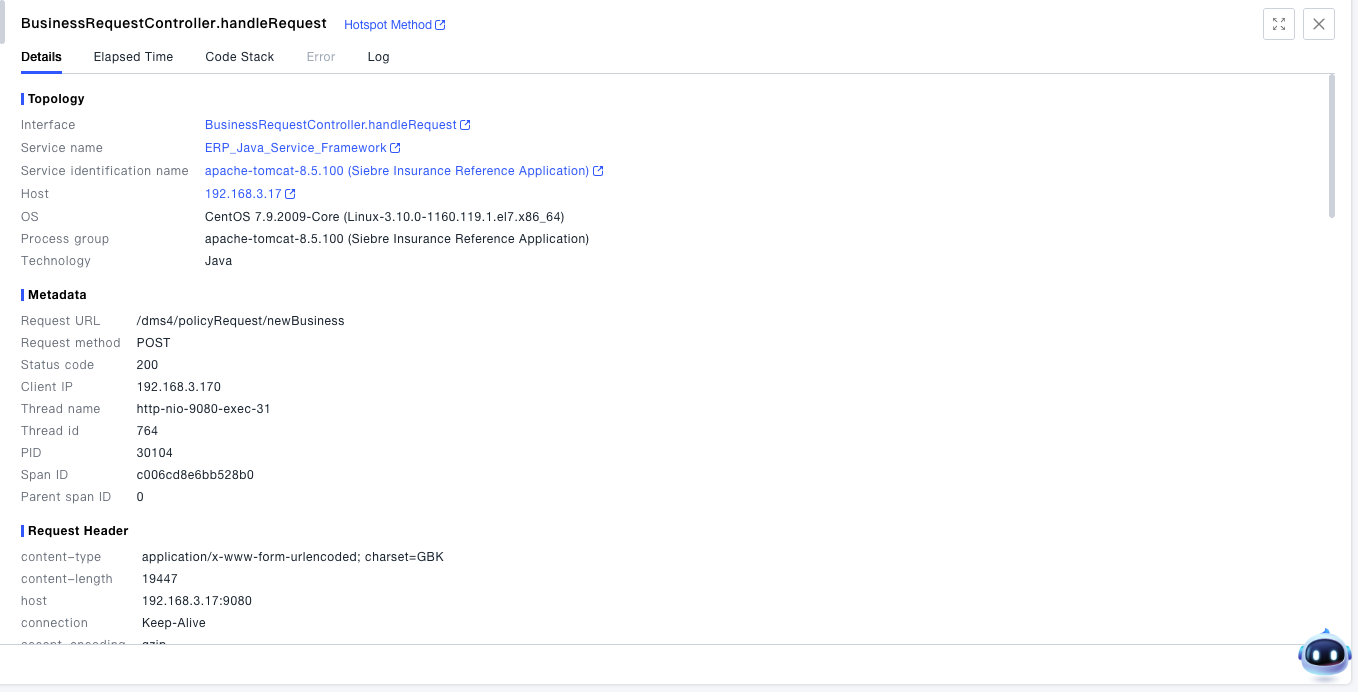
- You can view granular time information of the object: For terminal network requests, the latency is split into DNS time, TCP time, SSL time, server response time, and reception time. For server-side interfaces, the latency is split down to the CPU time granularity.
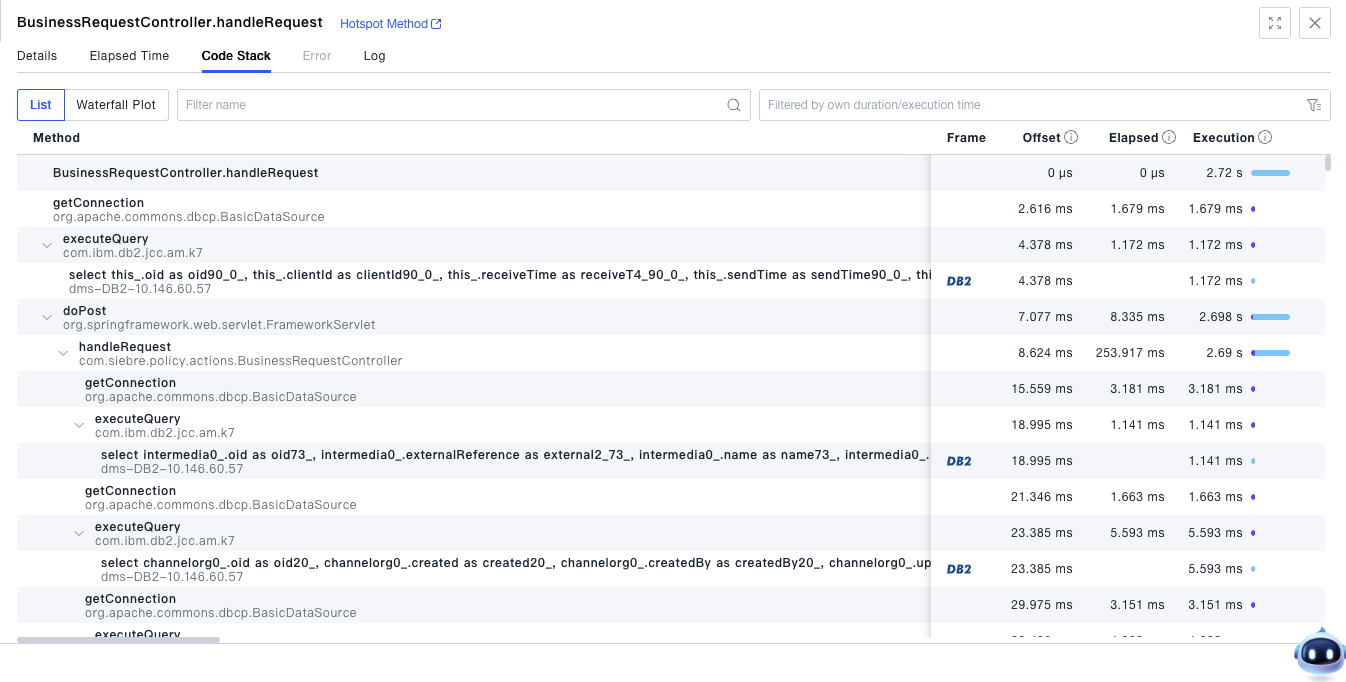
- The code stack displays the method call relationships under the interface. This code-level tracing and diagnostic tool helps the operation and maintenance team quickly locate the root cause of problems and reduce MTTR (Mean Time to Resolution). Detailed SQL statements and code performance profiling provide reliable data support for the R&D team to optimize business performance and achieve rapid iterations.
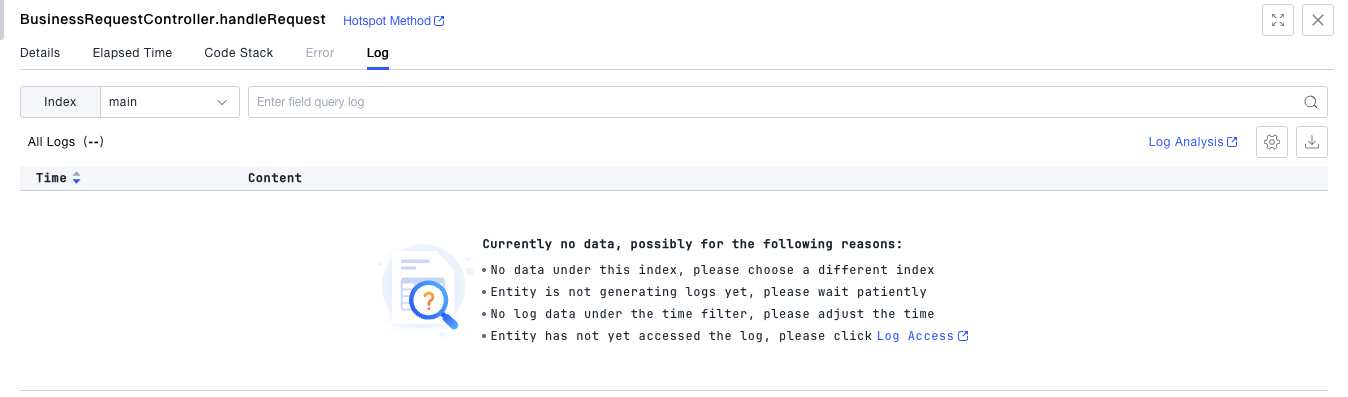
- You can view the log information of a single request.
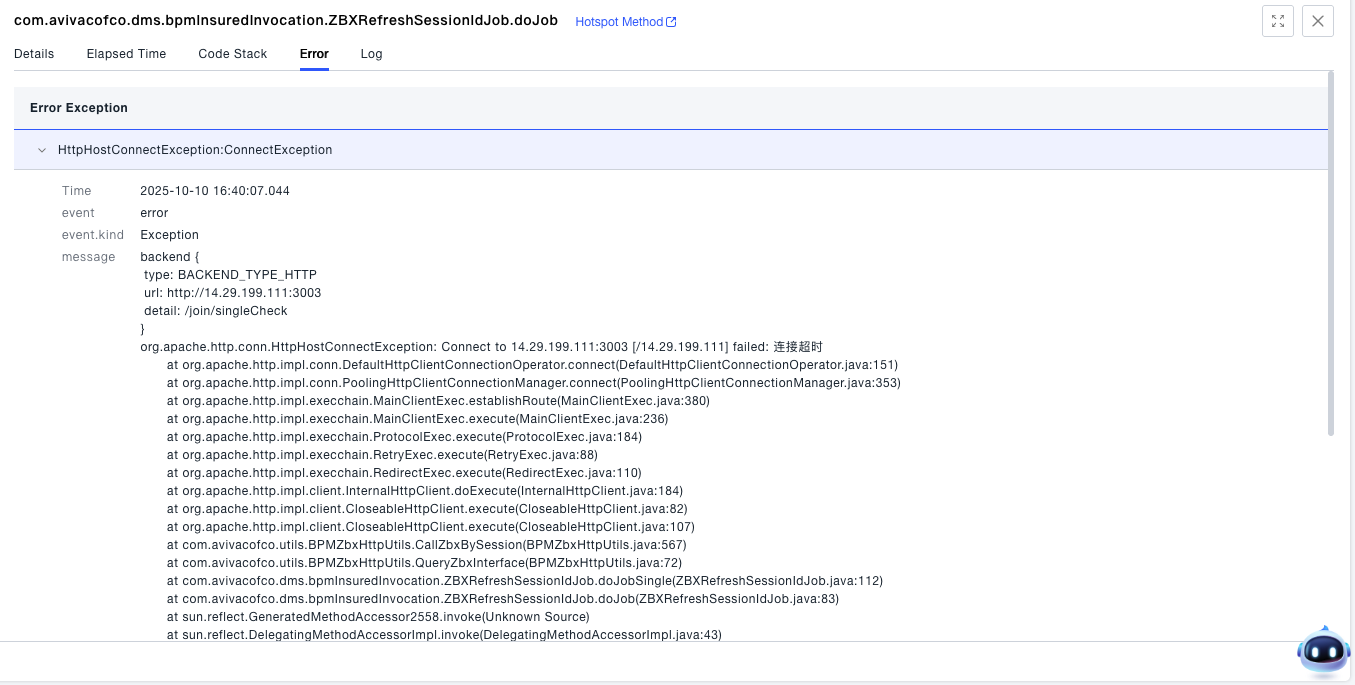
- You can view the error exceptions of a single request.
- You can view detailed information about the object, such as metadata, request headers, response headers, and request parameters.