threadprofiling
In the field of thread management and performance diagnosis, Thread Profiling is a specialized analytical technology for an application’s thread running status, scheduling behavior, and resource consumption. Its core functions focus on "resolving thread-level performance issues and ensuring the stability of multi-threaded programs", with specific capabilities including: full-dimensional monitoring of thread running status, accurate statistics of thread resource consumption, tracking of thread scheduling and interaction behavior, and assistance in visualization and problem localization.
Preconditions
The thread profiling function needs to be enabled during probe installation. For specific enabling operations, please refer to Probe Installation.
Usage Scenarios
- Localization of Multi-Threaded Concurrent Performance Bottlenecks: The application adopts a multi-threaded architecture (e.g., using a thread pool to process tasks), but overall throughput is low, response is slow, and CPU resources cannot be fully utilized.
- Troubleshooting of Thread Blocking and Deadlocks: The application experiences "freezes or unresponsiveness" during operation, with no clear error information in logs. The cause is presumably thread blocking or deadlock.
- Thread Resource Competition and Synchronization Optimization: The application contains a large number of threads sharing resources (e.g., shared caches, database connections), leading to frequent lock contention and excessively long thread waiting times.
Get Started
-
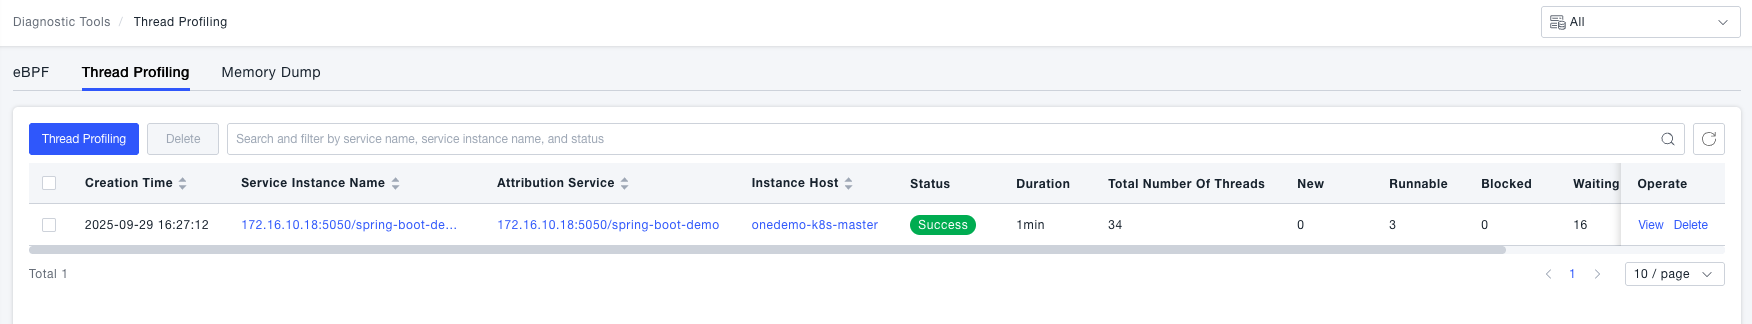
Navigate to the System Services -> Diagnostic Tools page, then select the Thread Profiling tab. On this page, you can create thread profiling tasks and view historical task data.
-
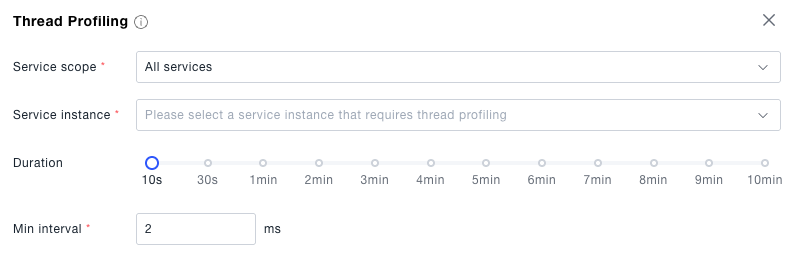
Create a Thread Profiling task: You need to select a specific service instance and set the duration before issuing the profiling task.
tip- When the probe executes a thread profiling task, it may cause all application threads to pause (Stop-The-World, STW), slowing down the application’s response.
- Only supports service instances of the Java technology type.
-
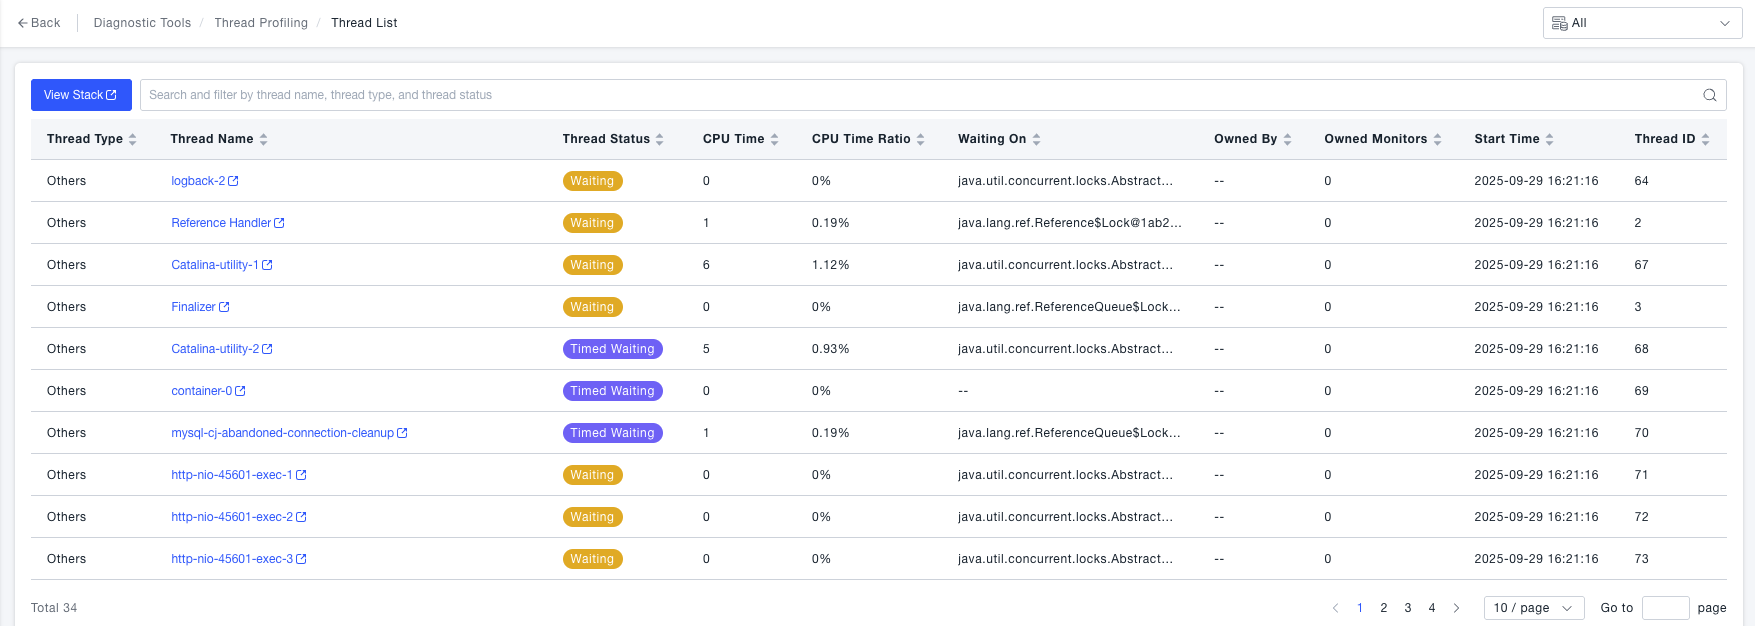
View profiling details: Supports analyzing information such as the status and CPU time of each thread from the thread dimension.
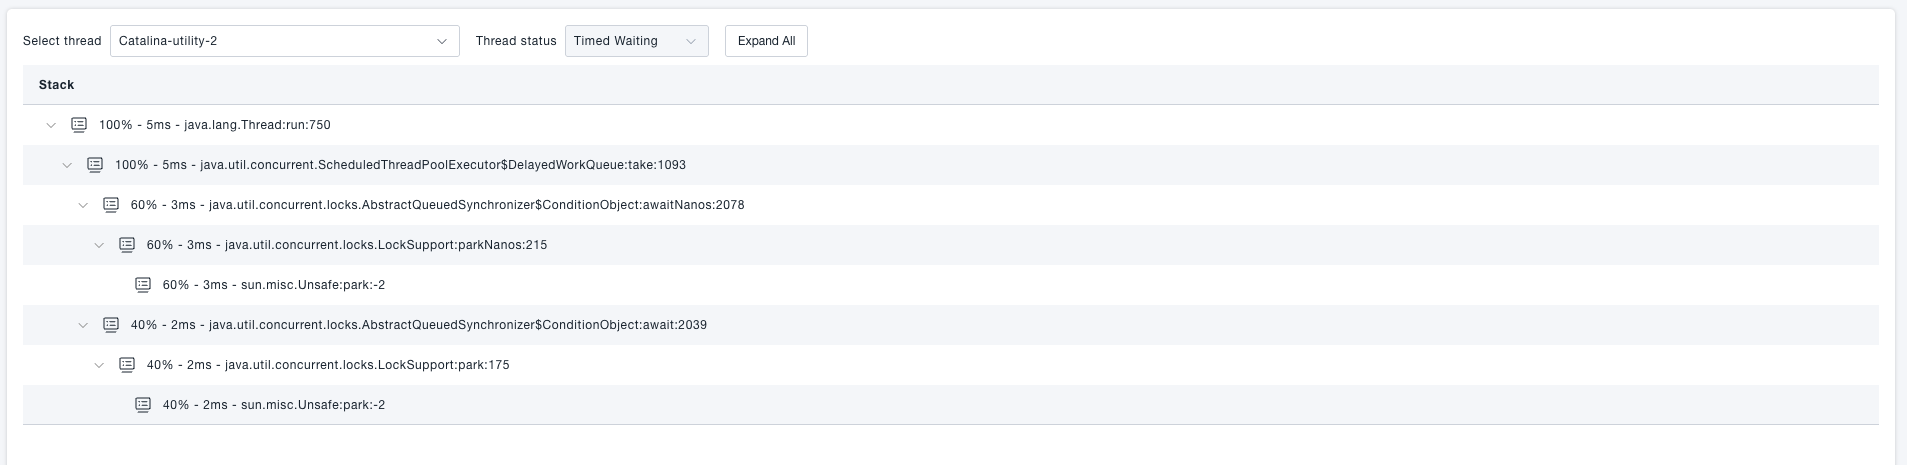
-
Click a row in the table to view stack details: Supports checking the method-level time consumption and proportion of threads according to the stack call order.