continuousanalysis
Continuous profiling is an advanced performance monitoring technology that enables performance insight into the entire lifecycle of an application through long-term, low-intrusive multi-dimensional data collection. Its core functions include:
- Real-time capture of key indicators such as function call stacks, resource consumption (CPU, memory, IO, etc.) and execution time
- Automatically identify hot methods and performance bottlenecks without manual triggering
- Generate visual reports (such as flame graphs, call chain graphs) to assist analysis
- Low resource overhead design, can be safely deployed in production environments
This function breaks through the limitations of traditional snapshot profiling, transforming performance management from passive troubleshooting to proactive problem discovery and prevention, providing development and operation teams with full-time performance monitoring capabilities.
Preconditions
The continuous profiling function needs to be enabled during probe installation. For specific enabling operations, please refer to Probe Installation.
Use Cases
- Complex system performance bottleneck location: In microservice and cloud-native architectures, identify performance bottlenecks in cross-service calls; locate resource competition and synchronization problems in high-concurrency scenarios;
- Intermittent and periodic problem troubleshooting: Capture intermittent performance failures that are difficult to reproduce; analyze periodic resource usage peaks (such as CPU spikes at specific times of the day);
- Production environment performance monitoring: Continuously track response time changes of key business interfaces; achieve 7*24 full-time monitoring without affecting business
Get Started
Profiling Details-Flame Graph Mode
-
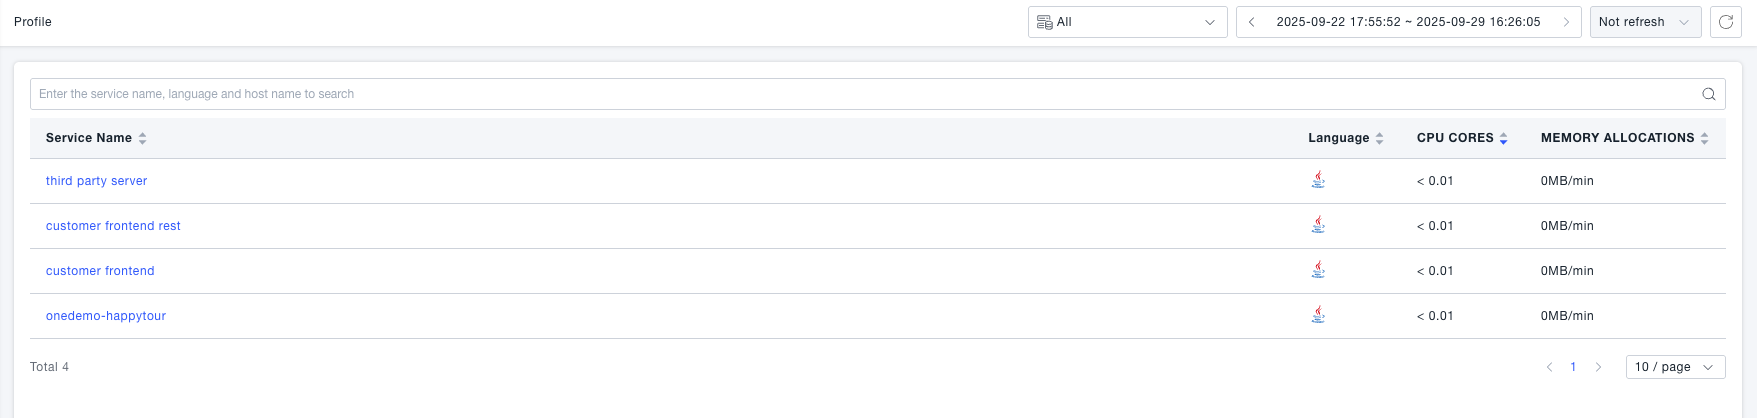
Enter the System Services -> Continuous Profiling page to see the continuous profiling list. When a problem occurs, it will automatically profile and record.
-
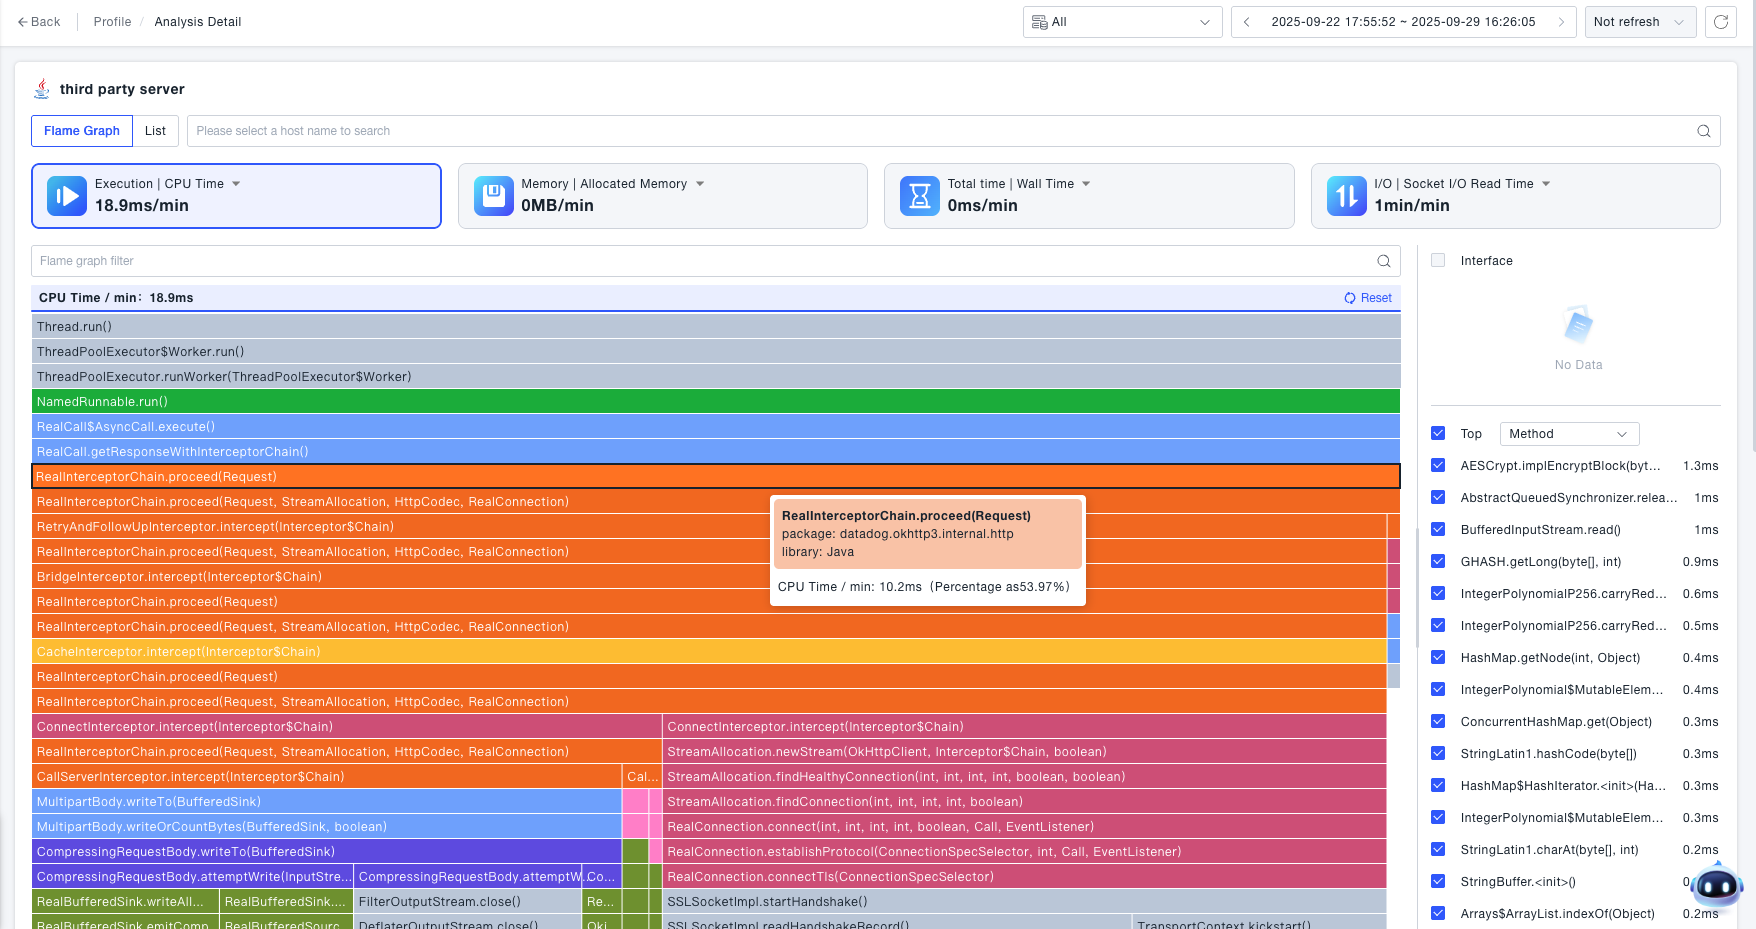
Click the service name to enter the profiling details, and you can perform detailed analysis through the flame graph.
- The flame graph displays the calling relationship between methods
- The length of each node corresponds to the indicator value on that node
- The node displays the corresponding method and function information
- The color of the node is distinguished according to the package name or file path
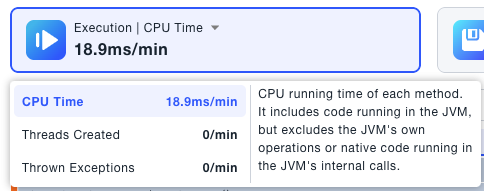
- When the mouse hovers over a node, the details of the node will be displayed, including node information and indicator values of the profiling type
- The right side of the flame graph displays statistical information from different dimensions, such as interfaces, methods, etc.
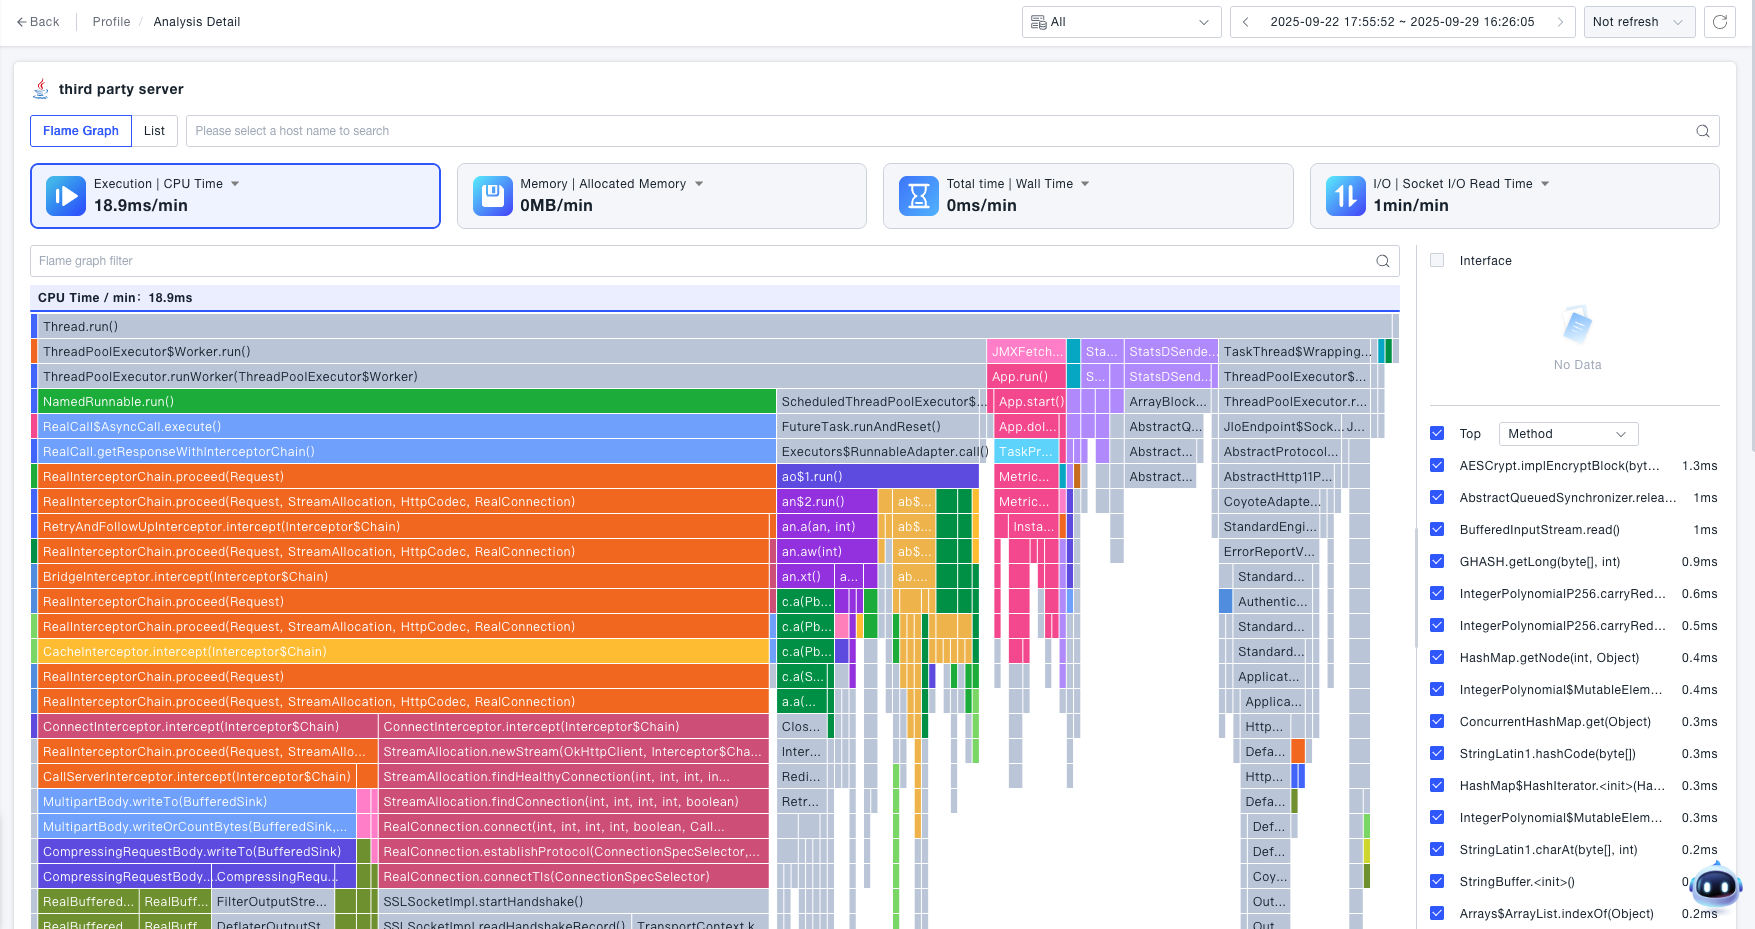
- Different types of indicator cards will be displayed in flame graph profiling, and different languages will display different indicator cards. You can click the indicators on the indicator card to select different profiling types
- By clicking a node on the flame graph, you can drill down on the flame graph and support continuous drilling down; clicking the same node or the reset button will return to the flame graph

Profiling Details-List Mode
- The continuous profiling details list mode supports switching between list mode and flame graph mode through the type button, and the system displays the flame graph by default
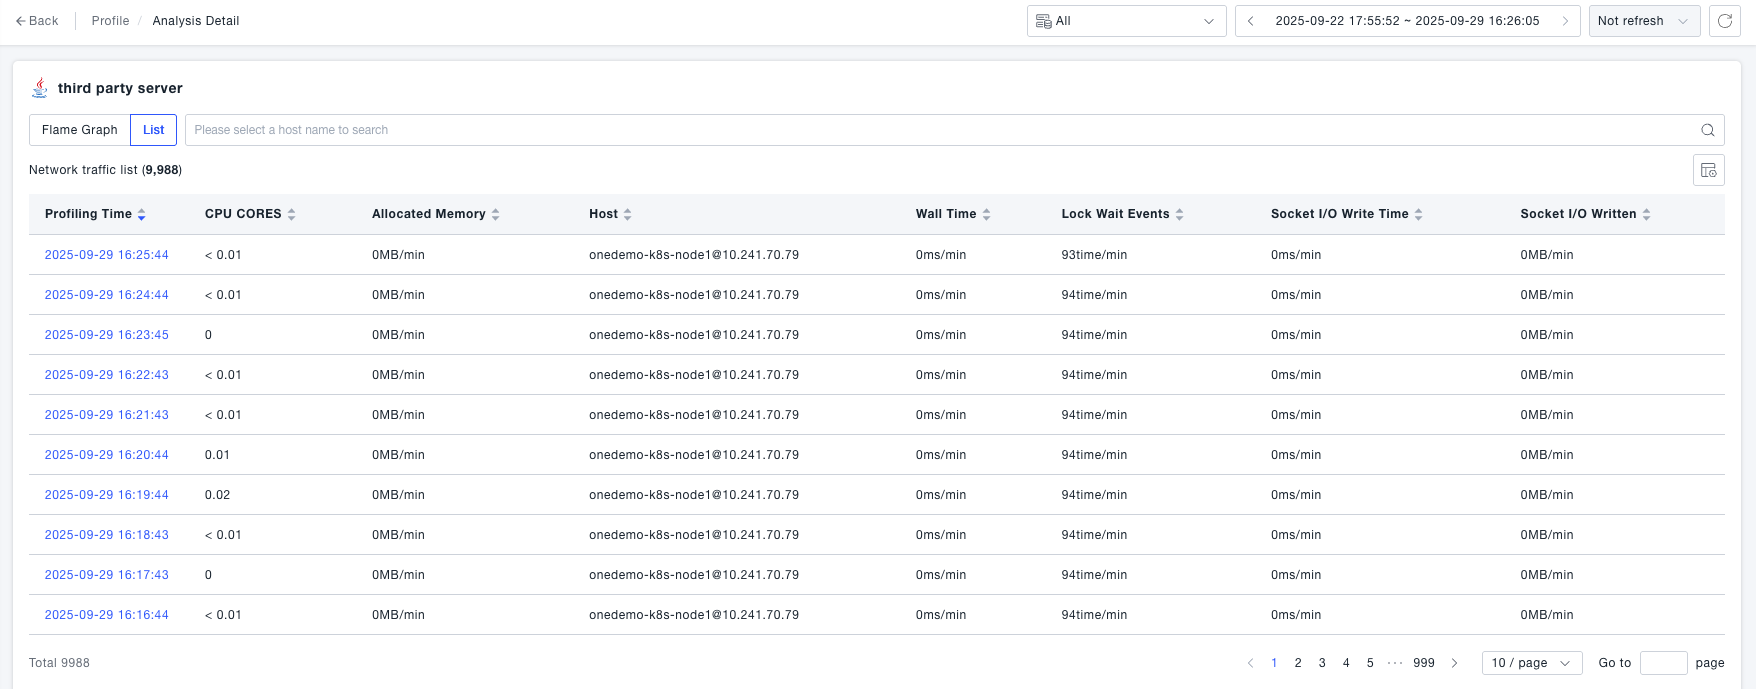
- In the list mode, click a row in the list to pop up the profiling details drawer to display the details of the profiling.
Click on the service name to enter the profiling details, where you can conduct detailed analysis through the flame graph.