ebpfprofiling
eBPF (extended Berkeley Packet Filter) is a virtual machine technology that enables packet filtering and system event observation by running sandboxed programs within the kernel—no need to modify kernel source code or load additional modules. It can directly capture details that are difficult for traditional tools to access, such as kernel scheduler behavior, system call latency, container network traffic, and process memory allocation. Fundamentally, it solves the problem of "invisibility in the interaction process between applications and the kernel".
Application Scenarios
Track metrics like network latency and system calls to optimize resource utilization in data centers.
Function Entry
-
Navigate to the System Services -> Diagnostic Tools page, then select the eBPF tab. On this page, you can create eBPF tasks and view historical task data.
-
Click the eBPF Profiling button to create a profiling task. A prompt message will appear; after confirming the information is correct, proceed to the task creation page.
- Long-term execution of eBPF profiling by the agent may significantly increase CPU overhead and occupy CPU resources of applications.
- Only one profiling task can run on the same host at a time.
- Only one profiling task can be executed for the same process at a time; otherwise, the task will fail.
- Profiling Duration: The duration of process profiling ranges from 1 to 20 minutes.
-
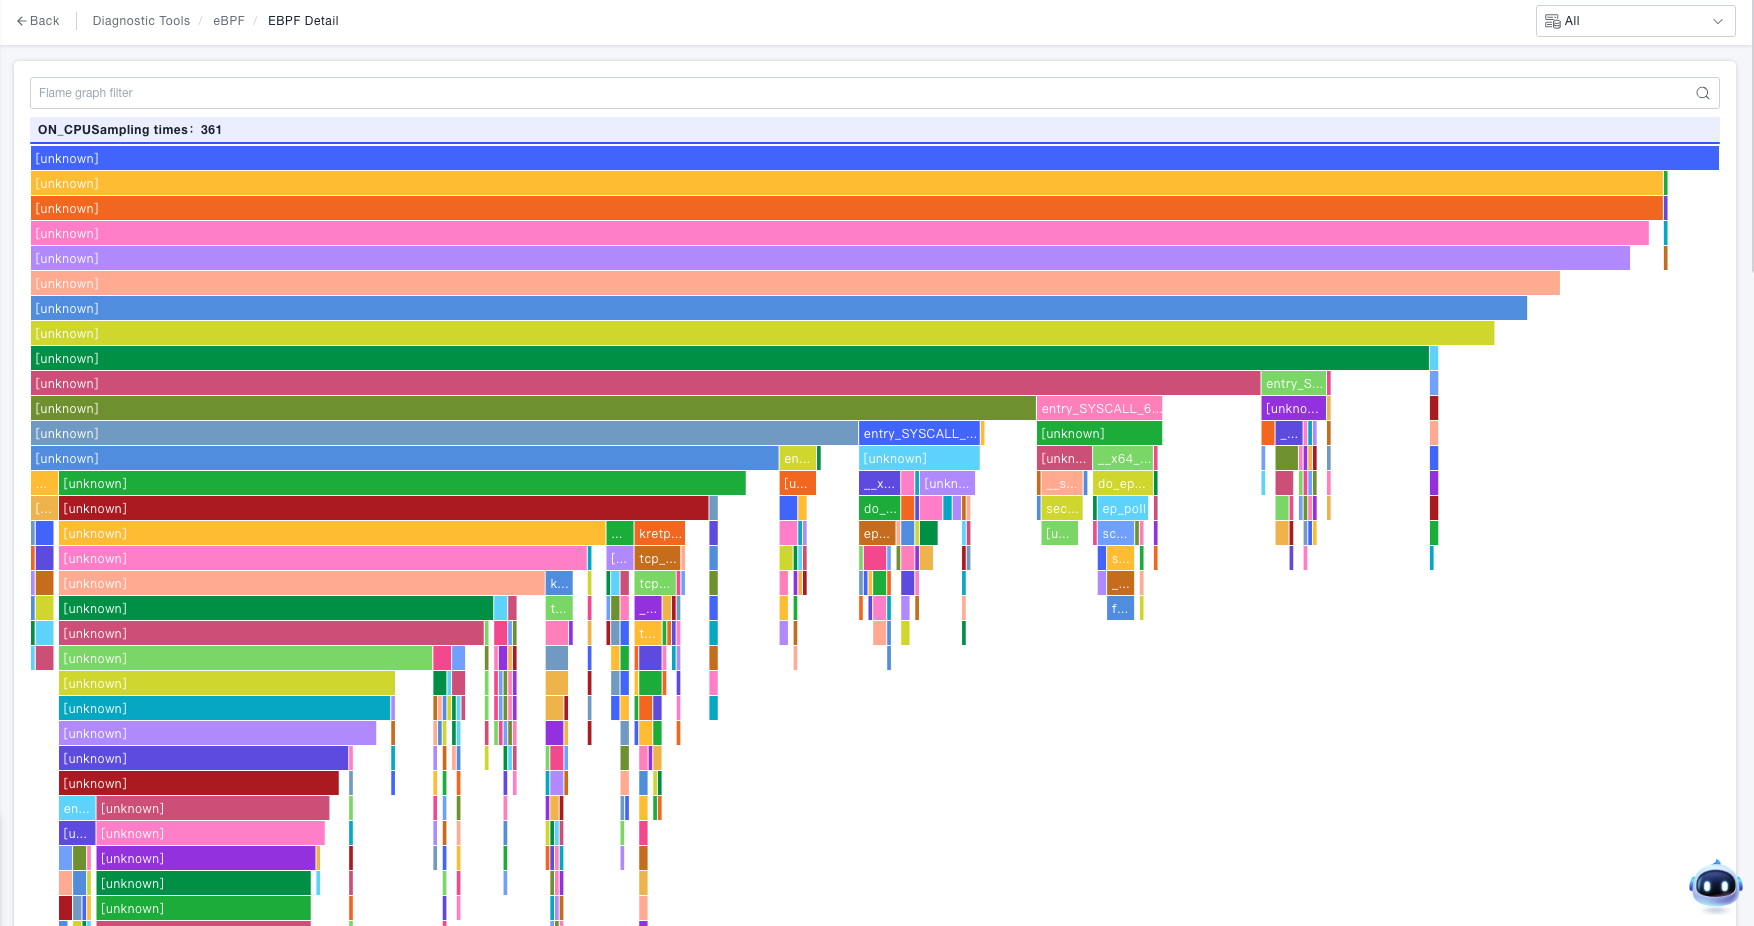
Click the View button to check the detailed eBPF analysis data:
- Displays the flame graph corresponding to the selected process and profiling type.
- The flame graph shows the call relationships between methods/functions.
- Hovering over a node displays the following information:
- The method/function of the node.
- The value of the profiling type (e.g., ON_CPU Sampling Count: 66 times (accounting for 50%)).