memorydump
In the field of memory diagnosis and fault troubleshooting, Memory Dump refers to a technology that "completely captures and stores the memory data (including variables, objects, function call stacks, register states, etc.) of an application or operating system at a specific moment into a file". Its core functions focus on "freezing memory snapshots, preserving fault scenes, and supporting in-depth root cause analysis", with specific capabilities including: completely retaining memory scenes to enable "fault reproduction"; supporting offline in-depth analysis to locate hidden memory issues; and correlating multi-dimensional data to restore the fault cause-effect chain.
Usage Scenarios
- Root Cause Localization of Application Crashes/Abnormal Exits: When an application crashes without warning (e.g., Java OOM (Out-of-Memory) crash, C/C++ segment fault), logs only record the "crash event" without key context, making it impossible to determine whether the cause is memory leak, null pointer access, or resource exhaustion.
- Diagnosis of Memory Leak Issues: The memory usage of an application continues to increase during operation (e.g., Java heap memory rises from 2GB to 8GB). The issue is temporarily resolved after a restart but recurs repeatedly, and the leak source cannot be located via real-time monitoring (e.g., the leaked objects grow slowly, with no obvious anomalies in real-time metrics).
- Memory Analysis Correlated with Performance Bottlenecks: An application interface responds slowly (e.g., the latency of a query interface increases from 50ms to 500ms). Real-time monitoring shows "low CPU usage and no IO bottlenecks", leading to the speculation that the issue lies in inefficient memory operations (e.g., frequent creation of temporary objects causing frequent GC (Garbage Collection), or time-consuming loading of large objects).
Get Started
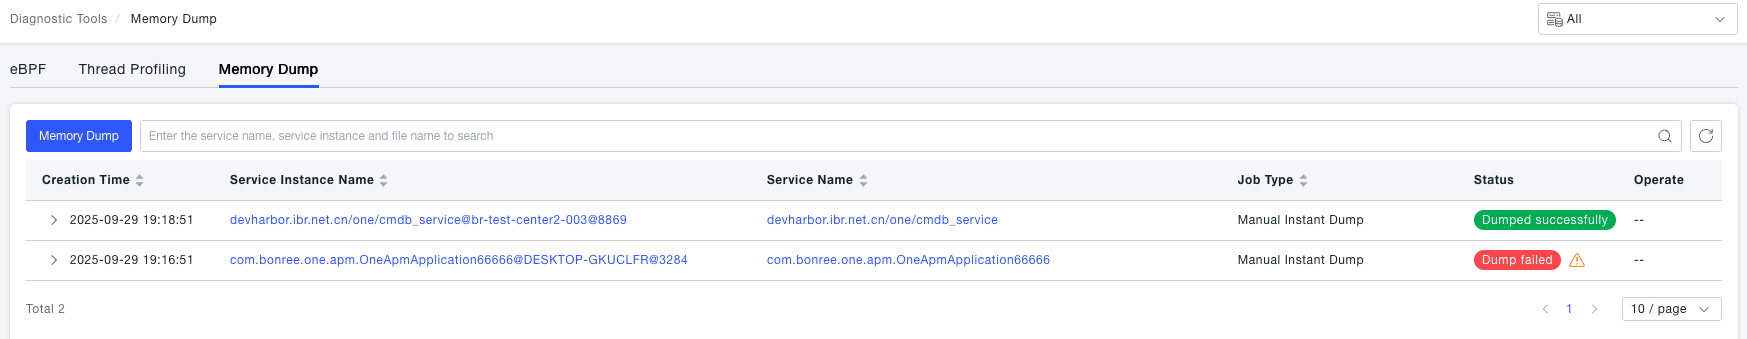
- Navigate to the System Services -> Diagnostic Tools page, then select the Memory Dump tab. On this page, you can create memory dump tasks and view historical task data.
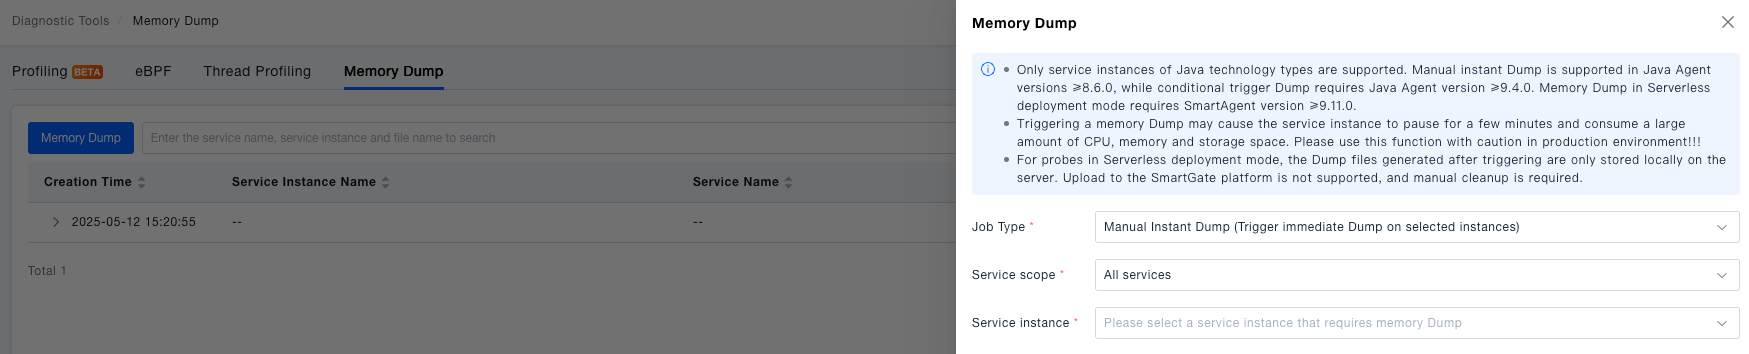
- Create a Memory Dump task. The platform supports two types of tasks: manual immediate dump and condition-triggered dump. When creating a memory dump, users need to select the appropriate type of dump task based on their usage requirements.
tip
- Memory dump saves the data and program states in the computer's memory to a file.
- It may have a certain impact on system performance: during the memory dump process, the system needs to write a large amount of data to the disk, which may increase disk I/O load and occupy a large amount of disk space.
- During memory dump, the system may pause some processes or services for a few minutes to ensure the consistency of the memory state. Therefore, system performance may decrease during the memory dump.
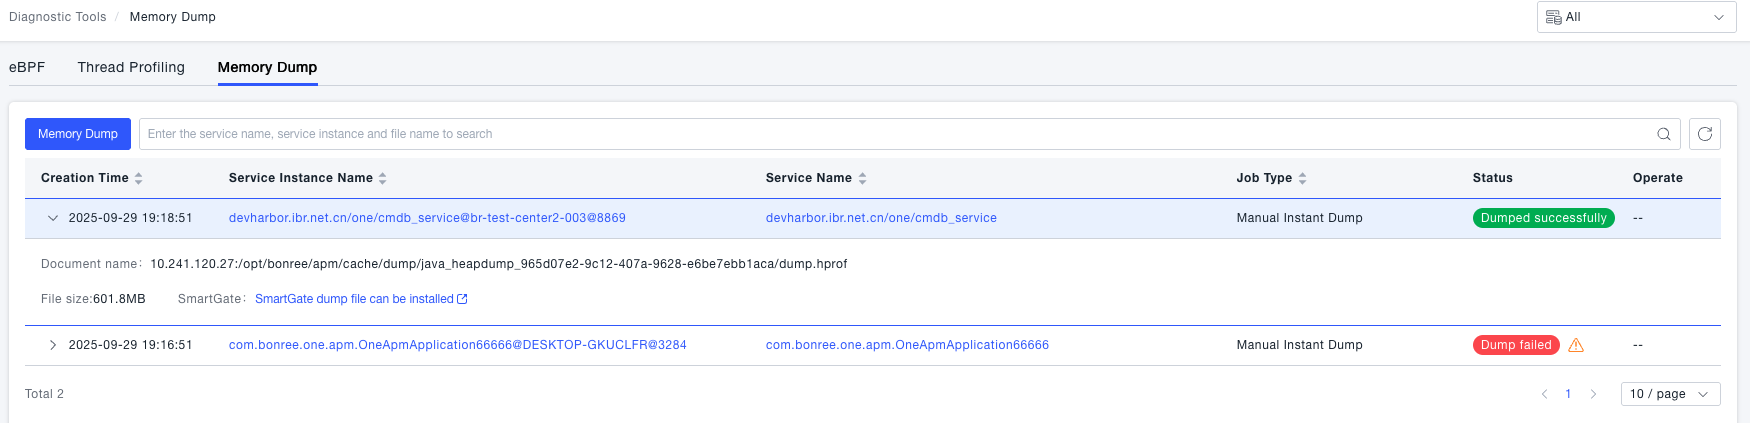
- View dump details. After creating a dump task, users can view the created dump tasks and their execution status in the dump list. Once the dump is completed, users can view the generated dump file to analyze the cause of system anomalies.
warning
- Only service instances of Java technology types are supported. Manual instant Dump is supported in Java Agent versions ≥8.6.0, while conditional trigger Dump requires Java Agent version ≥9.4.0. Memory Dump in Serverless deployment mode requires SmartAgent version ≥9.11.0.
- Triggering a memory Dump may cause the service instance to pause for a few minutes and consume a large amount of CPU, memory and storage space. Please use this function with caution in production environment!!!
- For probes in Serverless deployment mode, the Dump files generated after triggering are only stored locally on the server. Upload to the SmartGate platform is not supported, and manual cleanup is required.