hotspotmethod
In the field of application performance monitoring and optimization, Hotspot Methods are not independent tools, but refer to "core functions/interfaces that are frequently called, consume large amounts of system resources (CPU/memory/IO), or take too long to execute". Their core "function" lies in serving as a key entry point for performance analysis — by identifying, locating, and optimizing hotspot methods, system performance bottlenecks can be efficiently resolved, resource consumption reduced, and business stability ensured.
Preconditions
- The continuous profiling function needs to be enabled during probe installation. For specific enabling operations, please refer to the relevant documentation.
- Before using the hotspot methods function, you need to enable the hotspot method identification configuration first. For specific operations, please refer to Entity Identification -> Hotspot Methods.
Usage Scenarios
- Performance Assurance for High-Concurrency Businesses: Locate core methods that are "frequently called + time-consuming", such as the "inventory deduction method" in flash sale scenarios (call frequency of 5,000 times/second, single execution time of 80ms);
- Troubleshooting of Intermittent/Periodic Faults: Through continuous monitoring, capture temporary hotspots during fault periods. For example, "at 19:00, the dynamic loading method’s call frequency surged from 100 times/second to 2,000 times/second due to a sharp increase in user-published content, and the internal sensitive word filtering logic was inefficient".
Get Started
-
Navigate to the System Services -> Services -> Service Details -> Analysis page, where you can find the entry to Hotspot Methods.
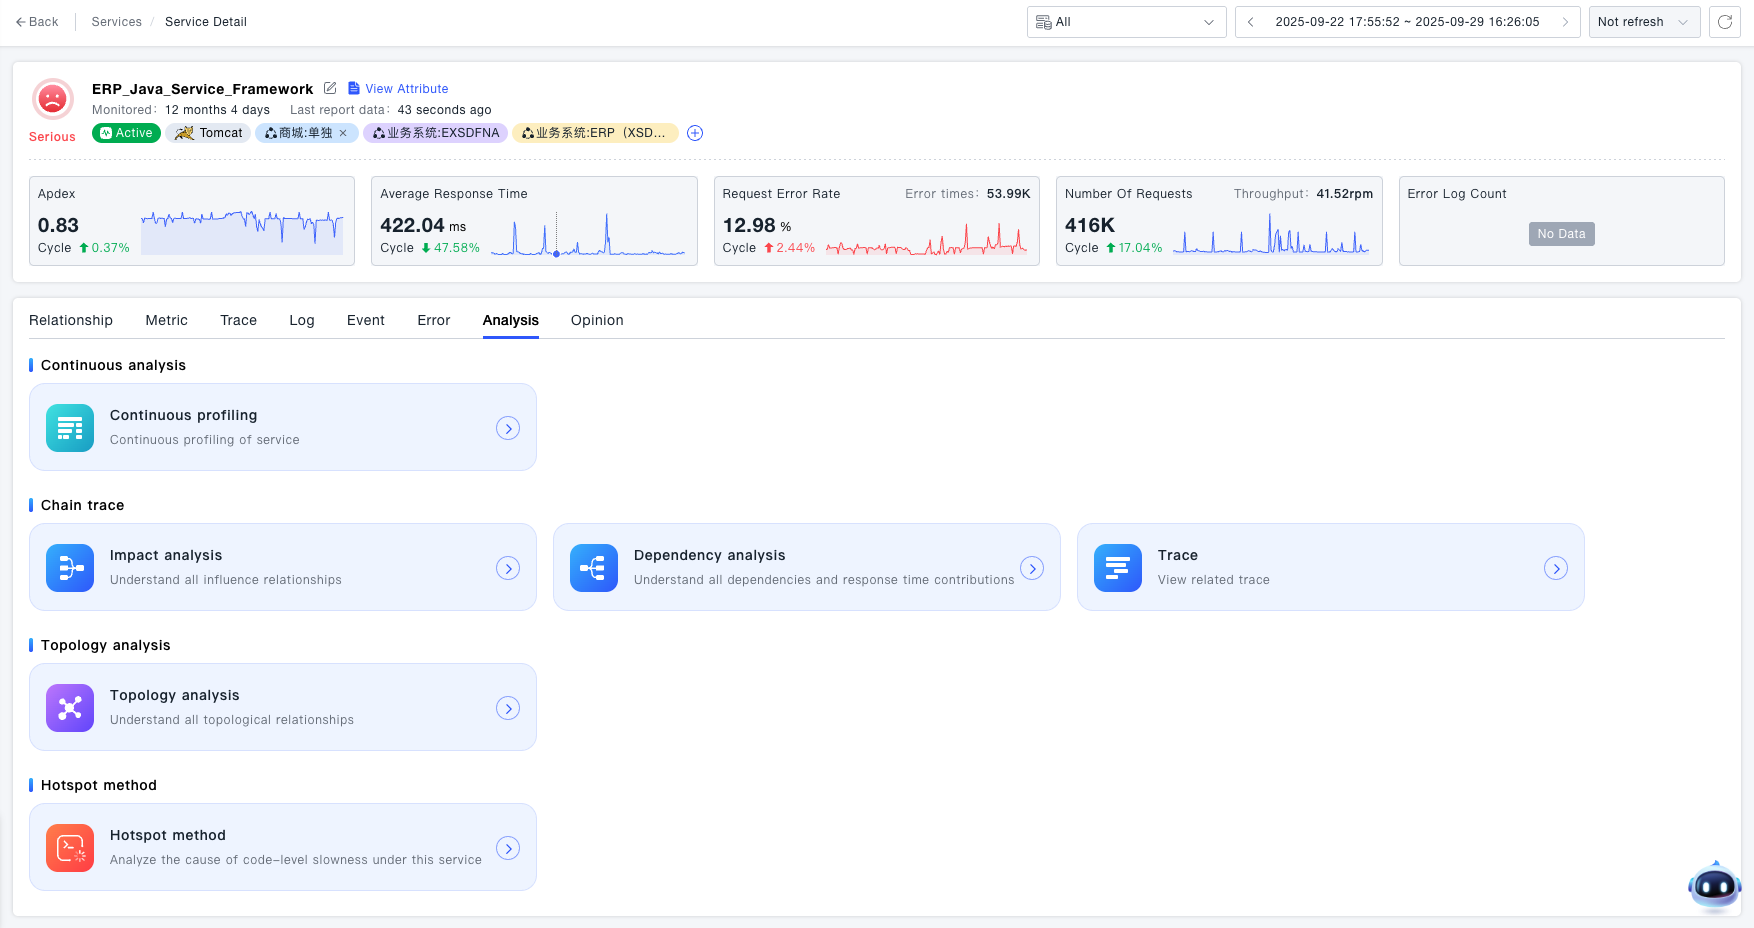
-
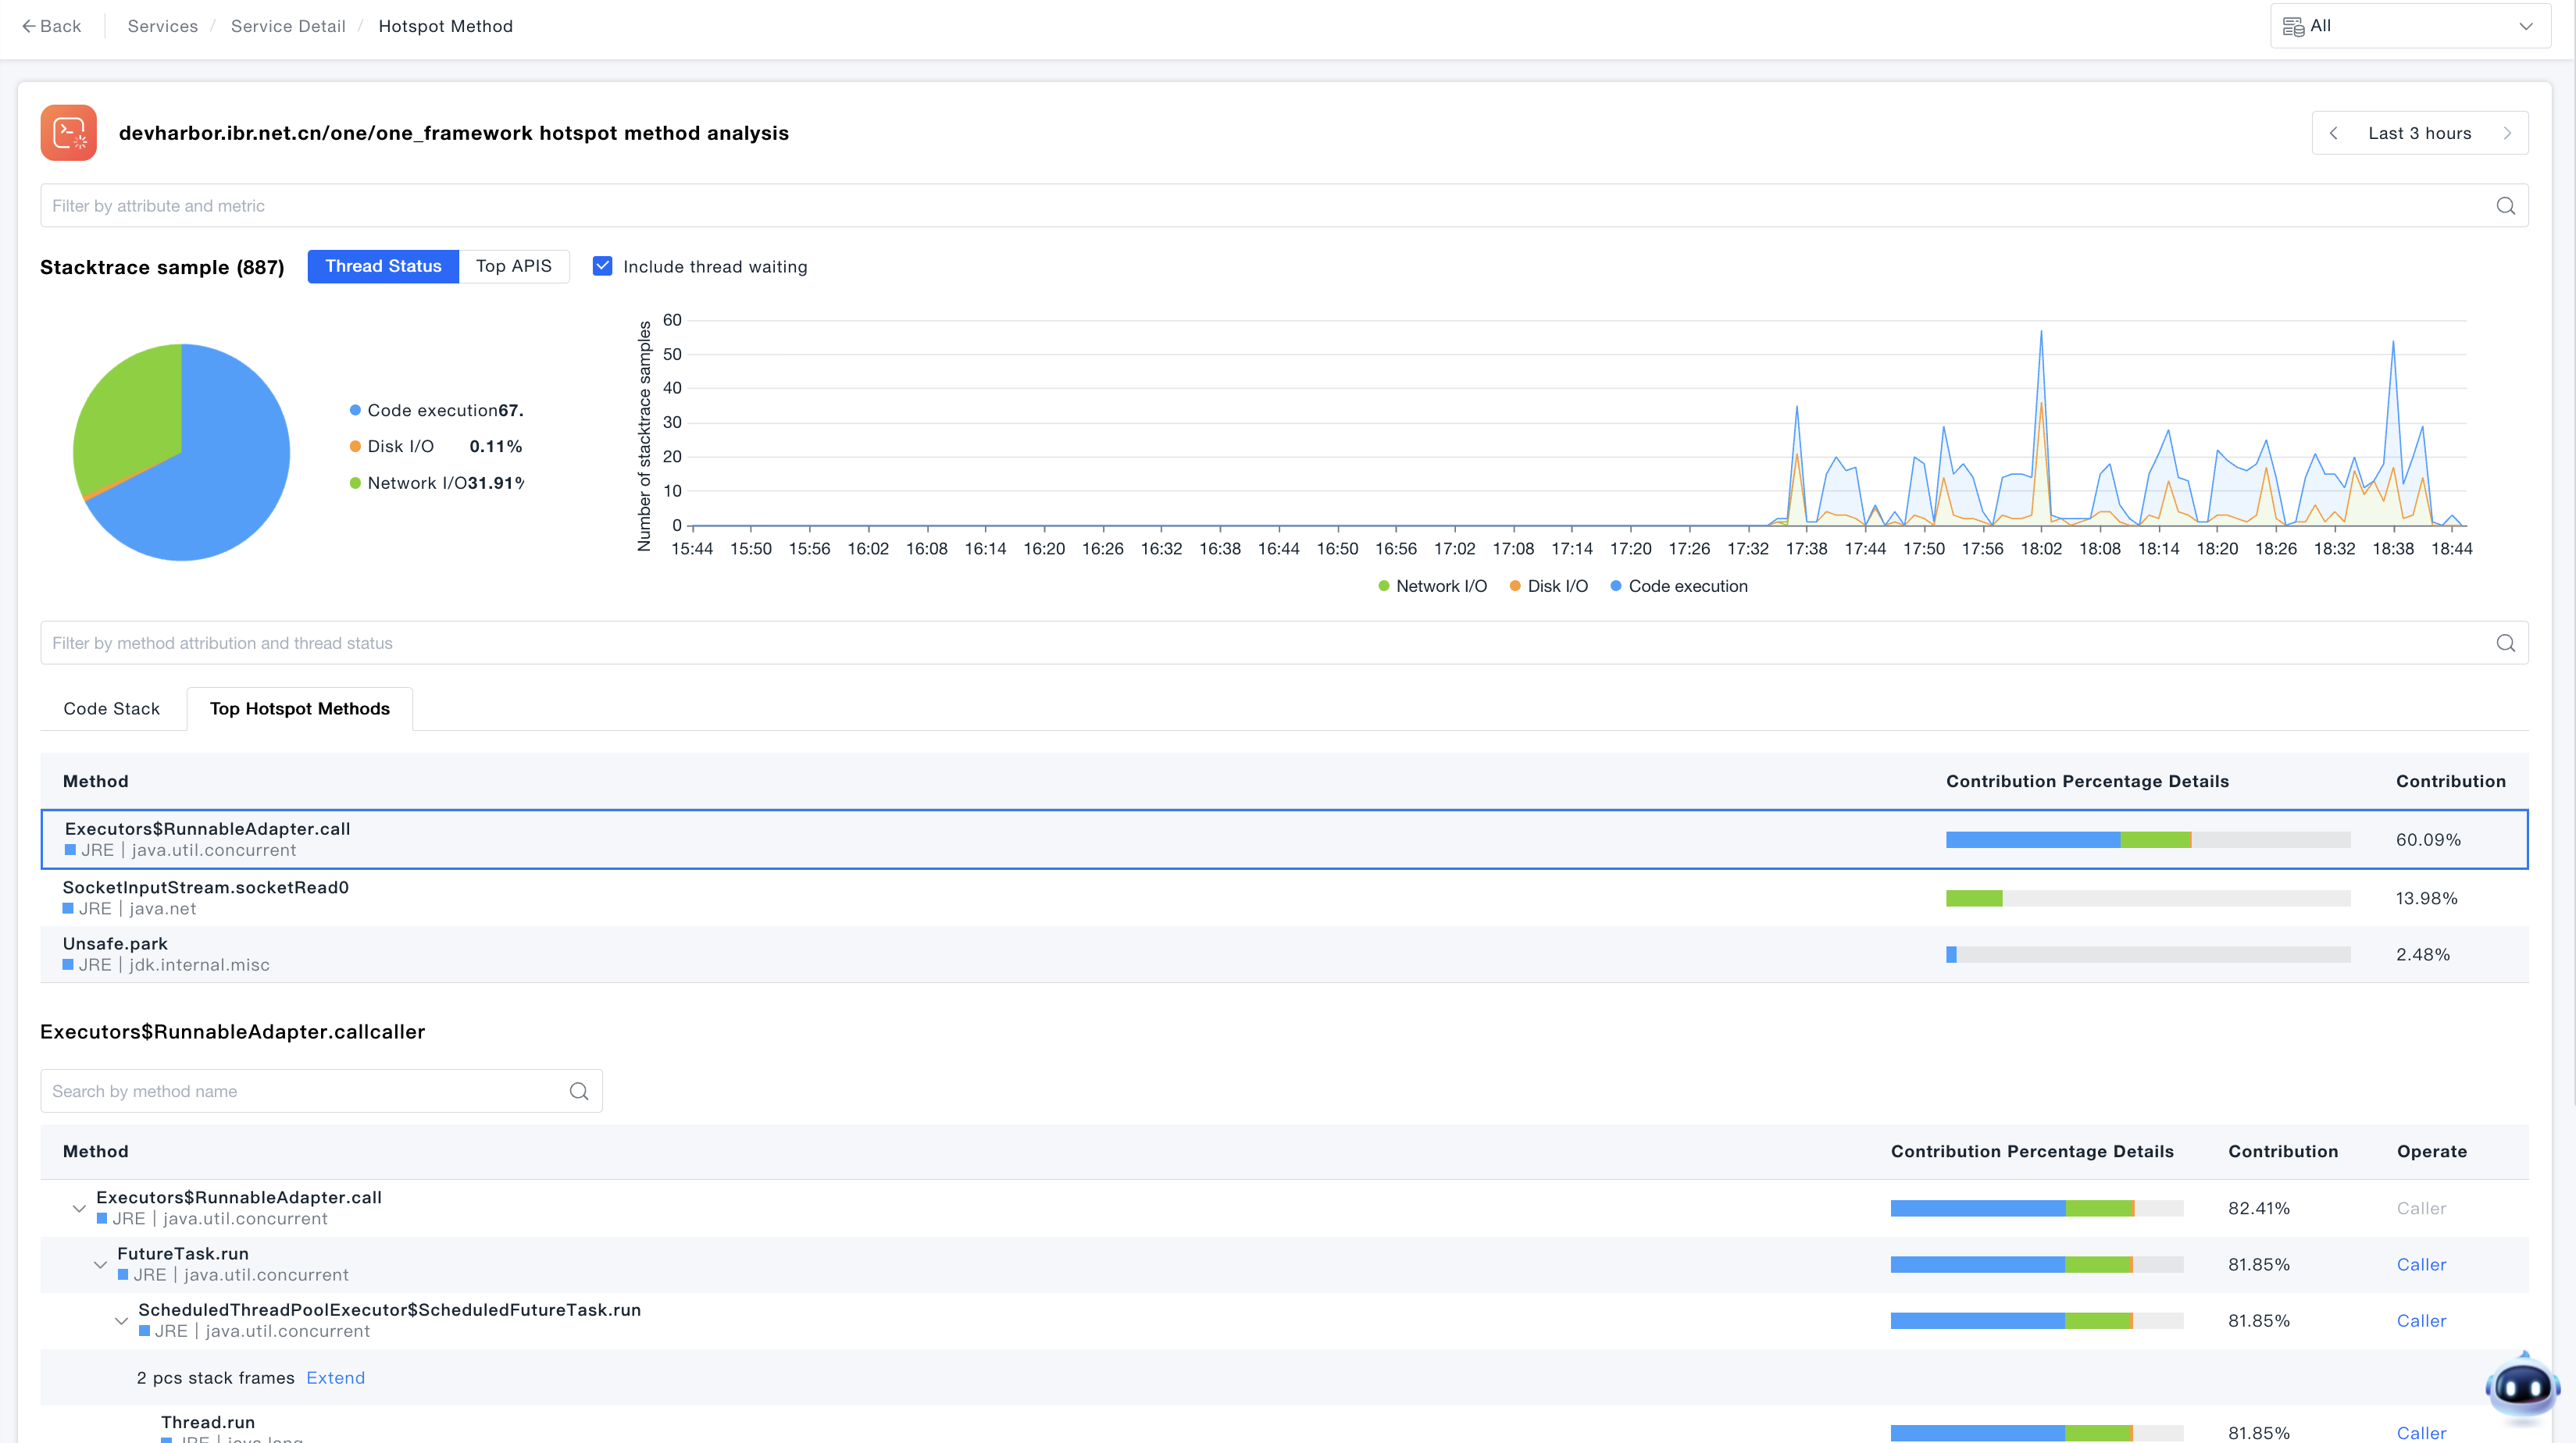
The Hotspot Methods Details page supports statistics of Stacktrace samples, trend statistics, and display of code stack data.
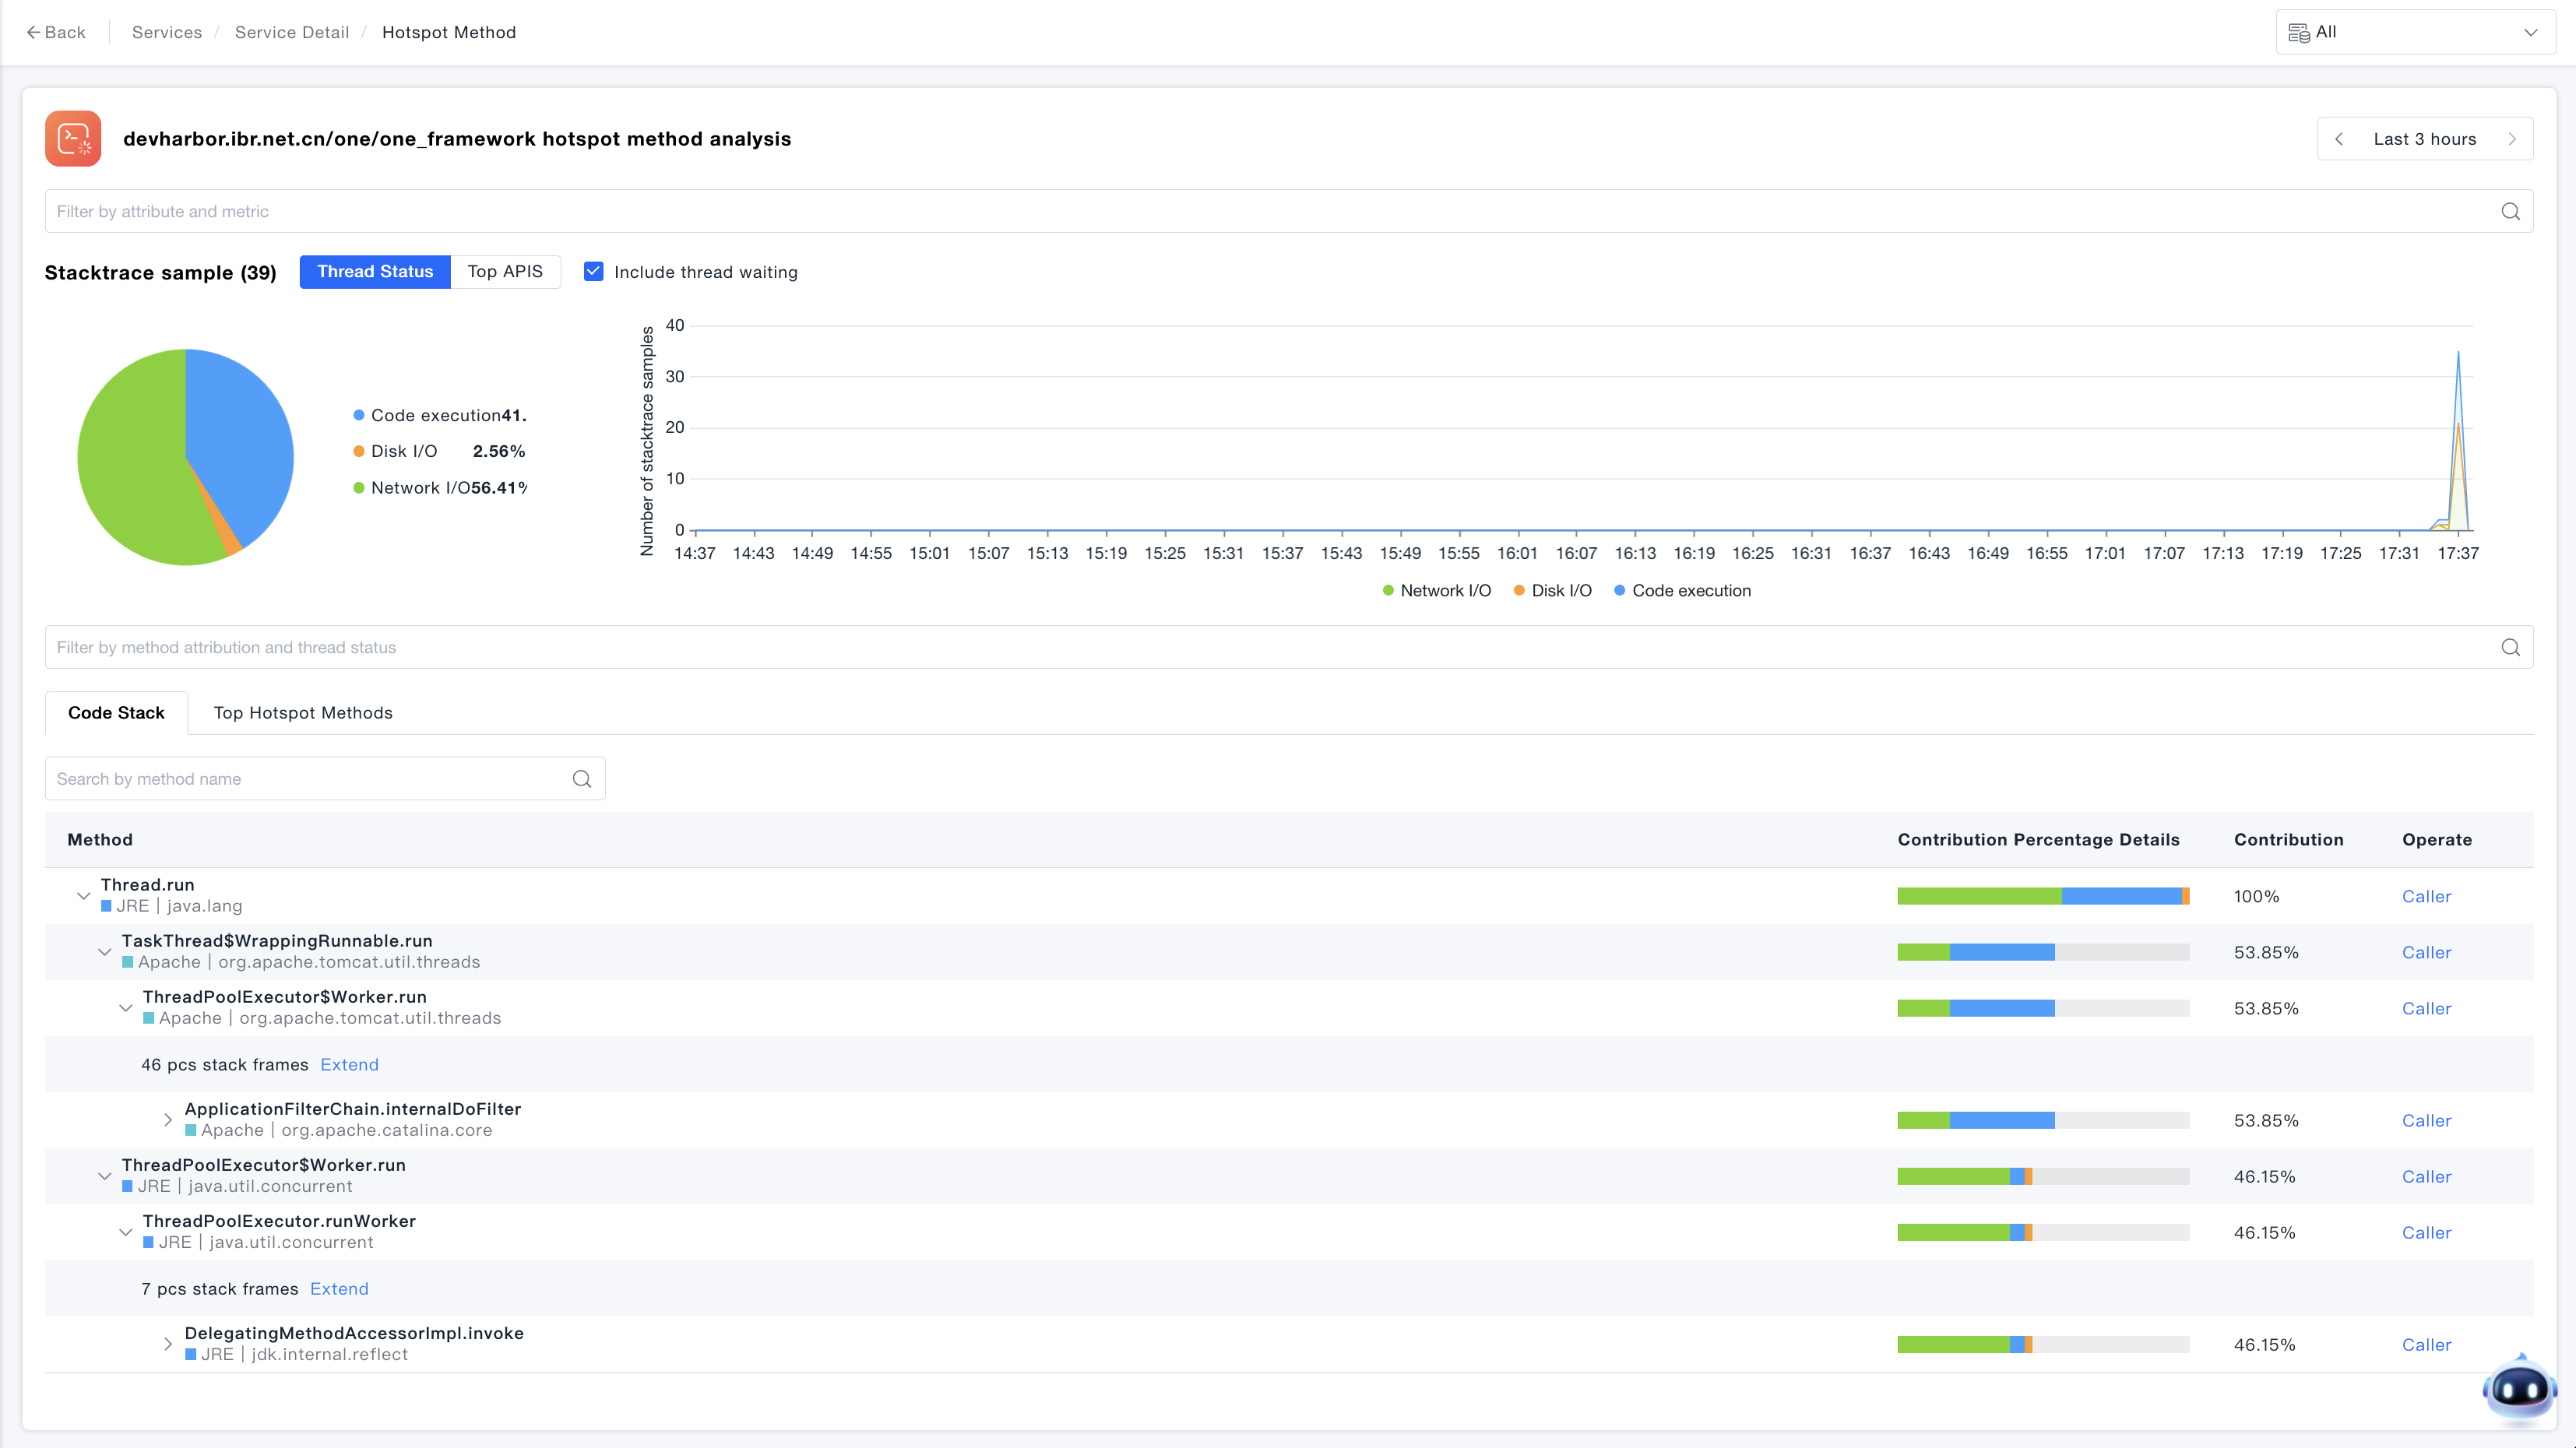
-
For Hotspot Methods Top statistics, switch to the Hotspot Methods Top tab to view the high-frequency methods in the current analysis.