erroranalysis
In the fields of software quality assurance and fault troubleshooting, Error Analysis is a specialized diagnostic technology for "exceptions, errors, and crashes occurring during application operation". Its core functions focus on "quick error capture, error scene restoration, root cause location, and recurrence prevention", covering the entire process from "error discovery" to "problem resolution". Specific functions include: error capture and classification; complete restoration of error scenes; error trend monitoring, etc.
Usage Scenarios
- Emergency Fault Troubleshooting in Production Environment: A large number of errors (error rate > 10%) suddenly occur in core business interfaces (such as user login, order payment), and users report abnormalities. It is necessary to locate and fix the problem within minutes to avoid business losses.
- Diagnosis of Intermittent/Low-Frequency Errors: Errors occur infrequently (e.g., once a day) and irregularly (not triggered at fixed times). Logs only record the "error type" (such as "NullPointerException") without detailed context, making manual troubleshooting and reproduction difficult.
- Long-Term Error Management: The application has a large number of "high-frequency but low-risk errors" (such as "occasional timeout of the log interface with an error rate of 0.5%, which does not affect core business"). If left unhandled for a long time, these errors may accumulate into serious problems (e.g., "the error rate of the log interface gradually rises to 5%, occupying thread pool resources and causing delays in other interfaces").
Get Started
-
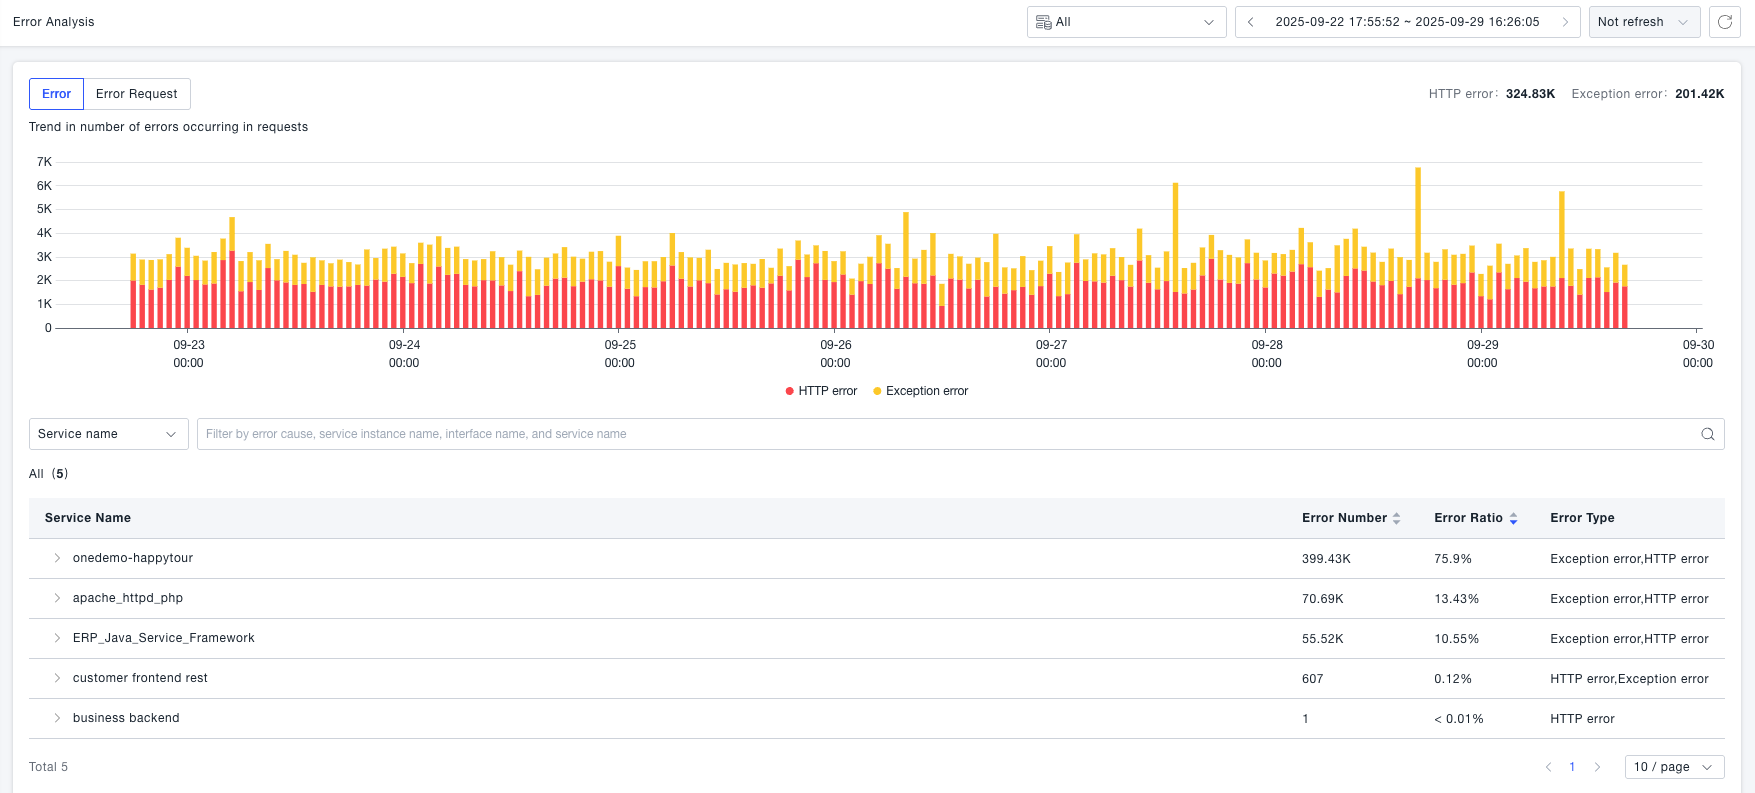
Navigate to the System Services -> Error Analysis page. Here, you can view error statistics and classified data, and support drilling down to jump to error details, etc.
- Error request trends: You can view the trends of successful requests, error requests, and error rates.
- Errors: Statistics on the trends of error HTTP statuses.
- The error list supports quick switching of statistical dimensions (e.g., viewing errors by error cause, service, service instance, and interface dimensions) to quickly find entities with a high error proportion.
-
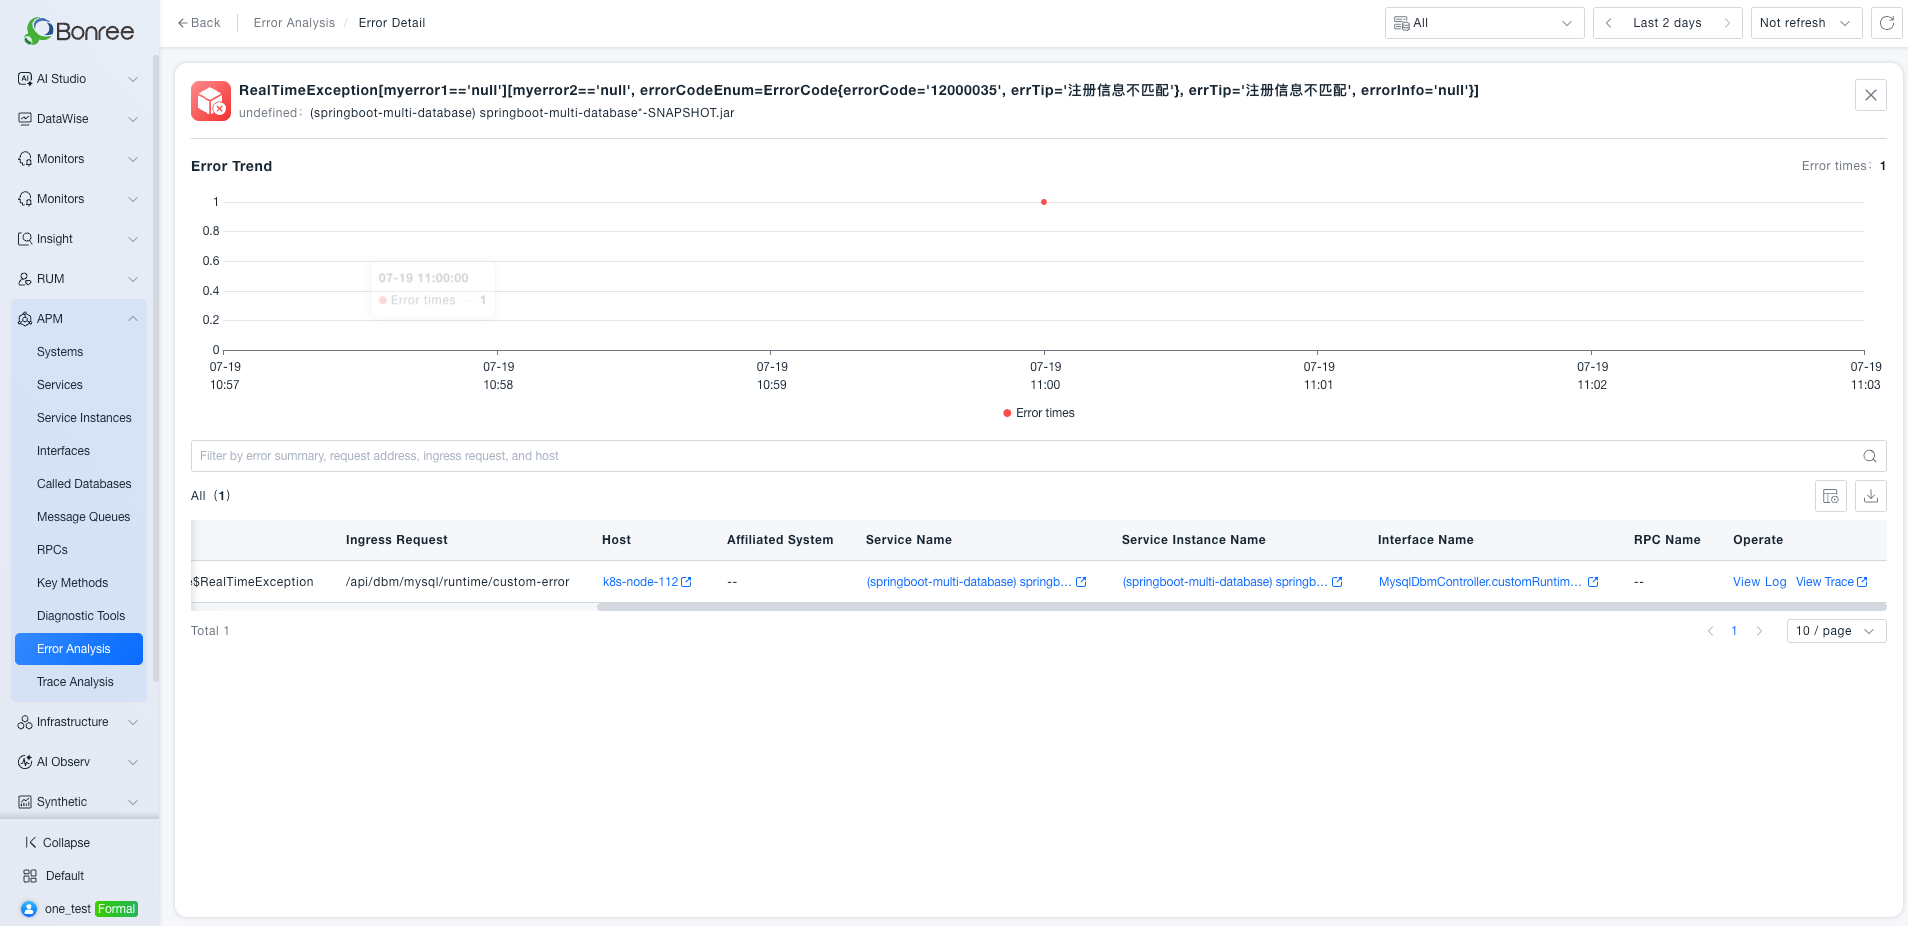
To view a specific error, open the error details page. The page shows the error summary, associated service, error trend, and the full error list. The list adds business attribution fields—Belonging System, Service, Service Instance, Interface, and Remote Call—with search and one-click navigation to help you quickly locate business ownership from an error instance and shorten the troubleshooting path.
Error Details Page
The error details page consists of the error overview, error trend, and the all-errors list. Use it for in-depth analysis of a specific error type.
Error Overview and Trend
- Error Summary: Displays full exception information of the current error (such as exception type, error code, error prompt, etc.) and its affiliated entity dimension.
- Error Trend: A line chart showing how often this error occurred in the selected time range, helping you judge whether the error is bursting or persistent.
All Errors List
The list shows all occurrences of this error in the selected time range. Main fields are as follows:
| Field | Description |
|---|---|
| Error Type / Error Summary | Exception type or summary of a single error occurrence |
| Entry Request | Entry request path that triggered the error |
| Host | Host where the error occurred; click to open host details |
| Belonging System | System that the error belongs to, for quick business attribution |
| Service Name | Service where the error occurred; one-click jump to service details |
| Service Instance Name | Service instance where the error occurred; one-click jump to instance details |
| Interface Name | Interface (method) where the error occurred; one-click jump to interface details |
| Remote Call Name | Associated remote call name, if any; shows -- when none |
| Actions | ProvidesView Logs and View Trace |
Search and One-Click Location
- Search and filter: Filter by error summary, request address, entry request, and host, as well as belonging system, service, service instance, interface, and remote call, to quickly find target error instances.
- One-click navigation: Click host, service, service instance, or interface in the list to open the corresponding entity details and drill from the error scene to the business owner.
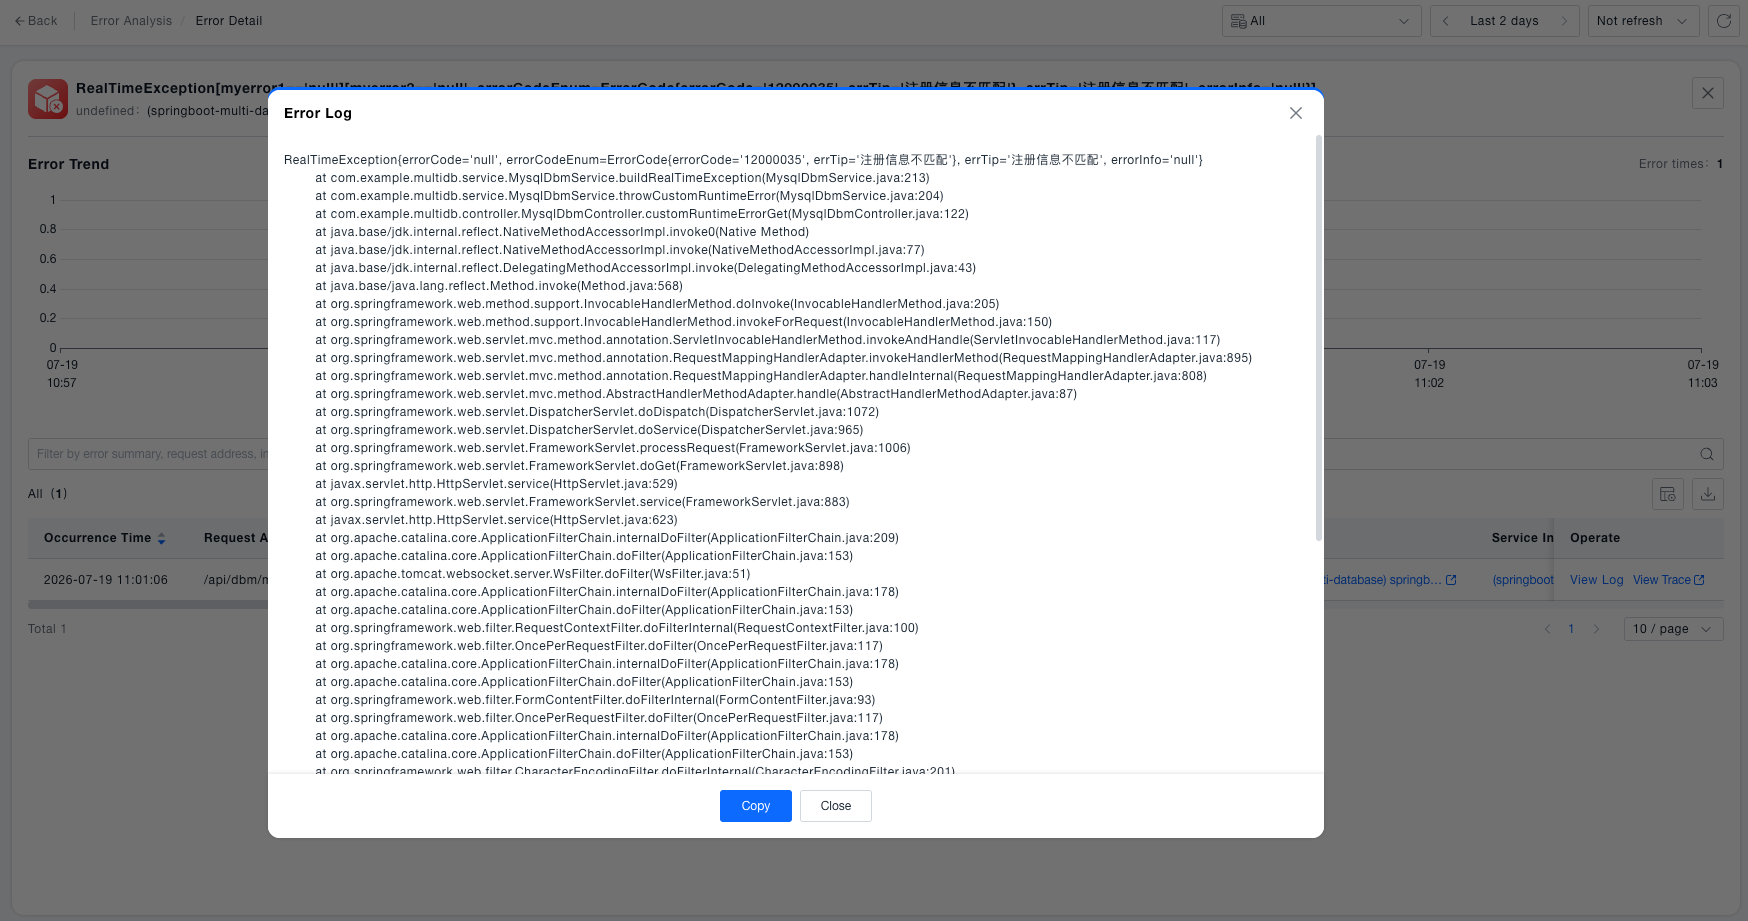
- View Logs: Open the detailed log and stack trace for that error occurrence to restore the error scene.
- View Trace: Jump to the related trace to review the full request path and upstream/downstream calls.
-
For a single error record, use View Logs to inspect detailed error logs, or View Trace to restore the full call path. You can also click business attribution fields such as host and service for one-click navigation to quickly locate the error instance and root cause.