Log Query
The log service supports second-level querying of billions to hundreds of billions of log data entries. Through log querying, you can troubleshoot issues based on logs and analyze business data using field information parsed from logs. The log query feature supports the following capabilities:
- View detailed information of individual logs in a list format.
- Discover valuable information through aggregated statistics and display it via visual charts.
- Group logs with similar structures for display, significantly facilitating your analysis process by eliminating the need to examine all detailed logs.
Prerequisites
Logs have been processed through built-in or custom parsing pipelines, with relevant attributes or tags successfully parsed.
Getting Started
Navigate to Log Analysis > Log Query to enter the log query interface.
The platform supports three query methods: List, Chart, and Pattern Recognition. Switch between these modes using the toggle buttons for different analysis scenarios.
Log List
View logs in a list format. Click any log entry to access its detailed page.
Search Bar & Quick Filters
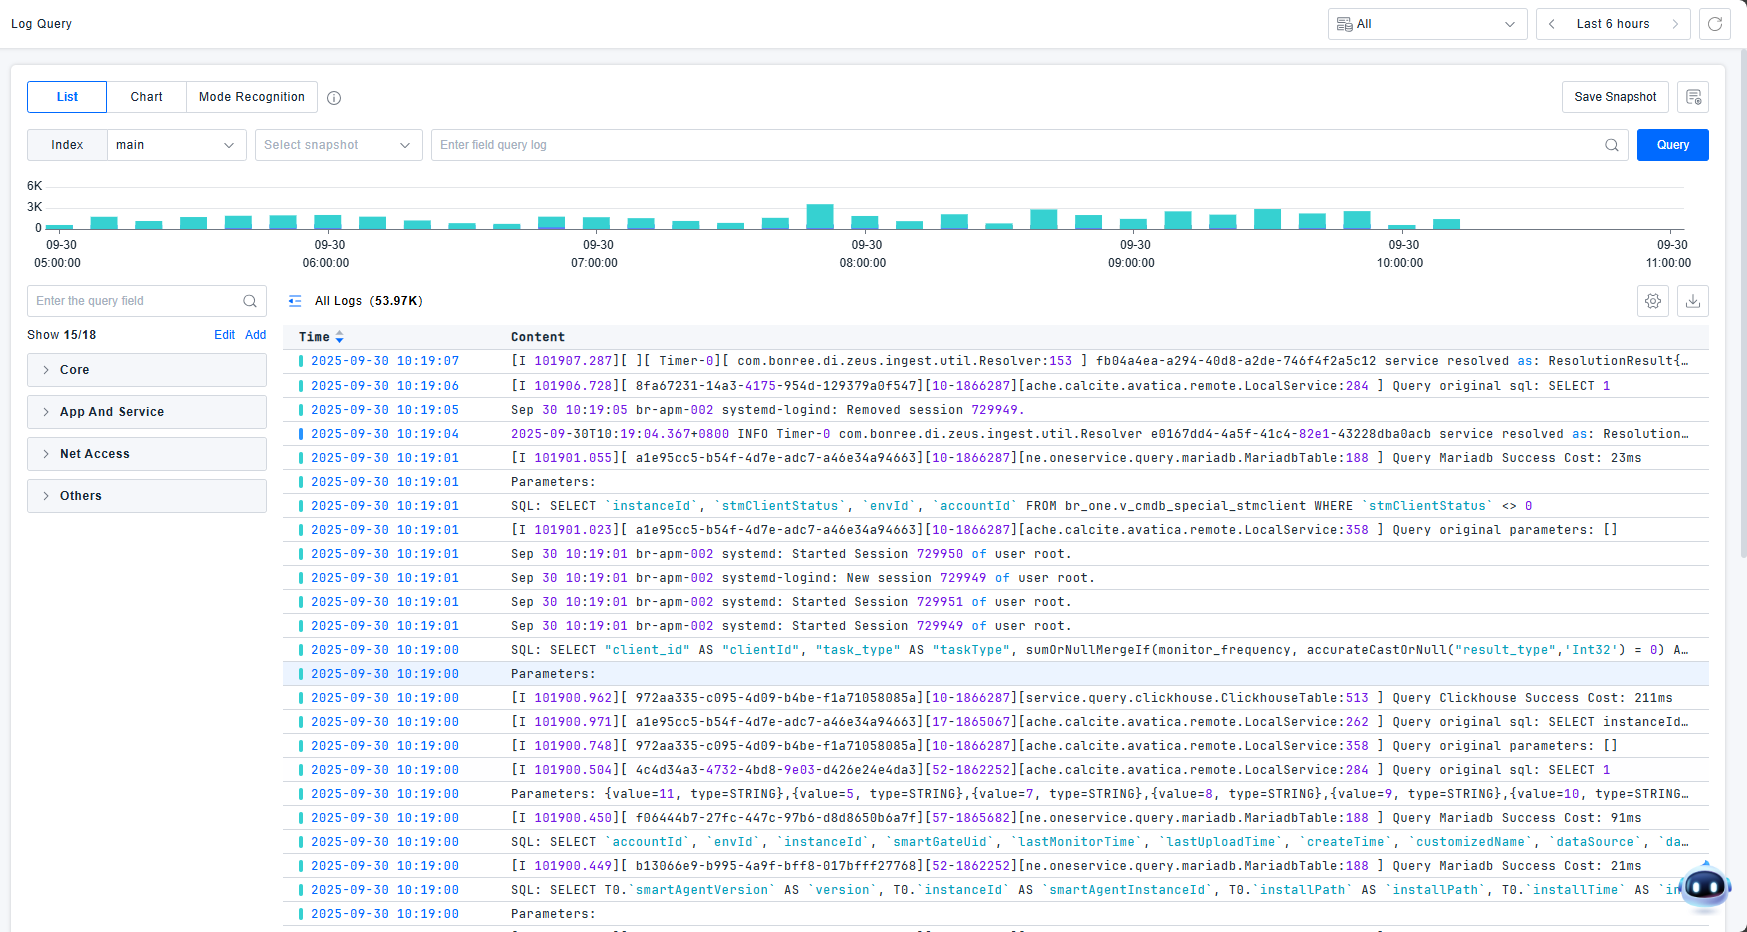
Use the search bar or quick filters to input query conditions and search logs. Click the query button to execute log data searches.
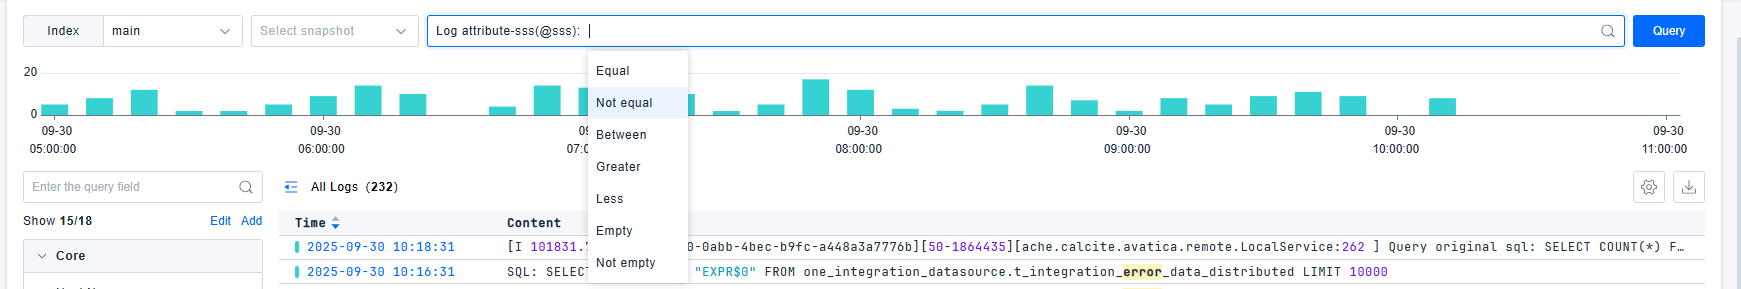
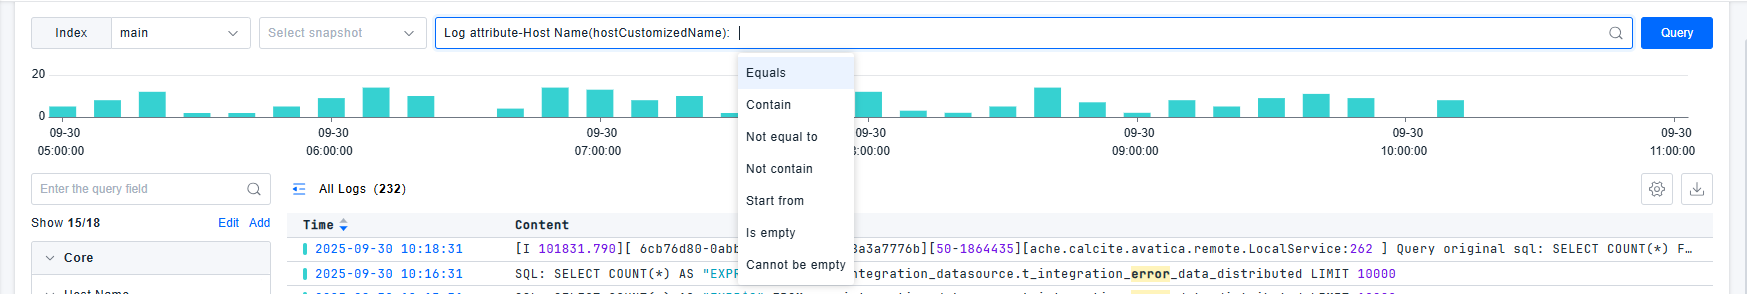
The platform provides powerful filtering components that allow you to narrow, expand, or adjust query scope using keywords, attributes, and tag information to pinpoint issues. Flexible query conditions are supported:
- Numerical values: Equal to, Not equal to, Between, Greater than, Less than, Is empty, Is not empty
- Text values: Equal to, Contains, Not equal to, Starts with, Is empty, Is not empty
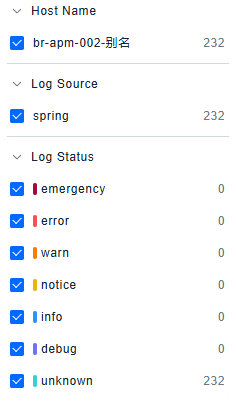
The platform includes built-in common filter fields such as Index, Host, Source, Status, and other core fields to facilitate quick log filtering.
Quick filters provide statistical information about log data under current filter conditions, supporting View Only, View All, and Toggle Options buttons for convenient field selection.
The platform supports one-click viewing of corresponding chart visualizations.
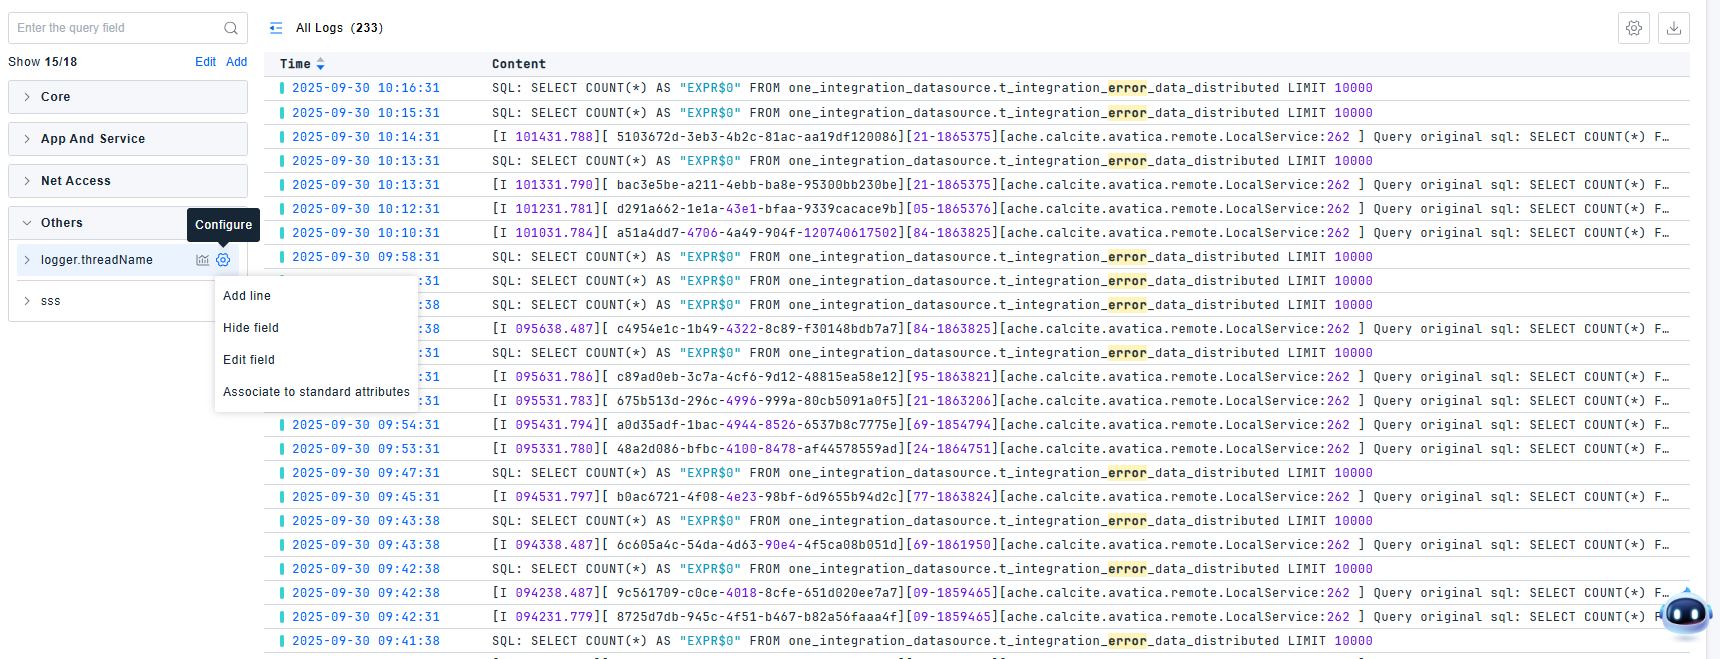
For fields in quick filters, operations such as Show/Hide Column, Delete Column, Hide Field, and Associate with Standard Attributes are supported.
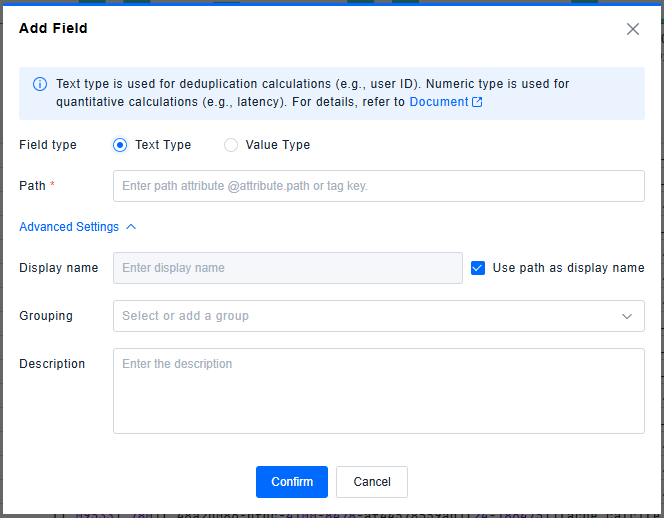
Defining Fields
When built-in filter fields are insufficient, add new fields by clicking the Add button or directly through attributes in the log detail page.
Added fields support both text and numerical types.
Text Type Fields
Text type fields have two data sources: attributes and tags.
- To search specific attributes, prefix with
@to specify attribute search. Attribute search is case-sensitive. Escape special characters or use quotes for attribute values containing special characters.- Example: For attribute
my_attributewith valuehello:world, use:@my_attribute:hello\:worldor@my_attribute:"hello:world". Use?wildcard to match single special characters or spaces.
- Example: For attribute
- Special characters requiring escape with
\:+ - = && || > < ! ( ) { } [ ] ^ " " " ~ * ? : \ - For tags, use the tag key directly.
Advanced settings support configuring display name, grouping, and description.
- By default, Use path as display name (excluding
@) is enabled. Uncheck to modify the display name. This only affects filter panel display, not log parsing fields. - Grouping (optional): Select from dropdown or create new group. Ungrouped fields are categorized as "Other".
- Description (optional).
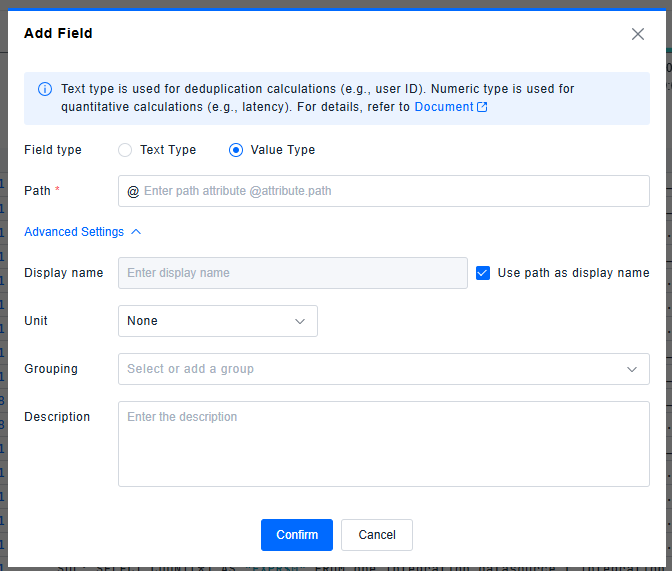
Numerical Type Fields
- To search numerical attributes, first add them as fields. Then use numerical operators (greater than, less than, between) to perform searches.
Advanced settings support configuring display name, unit, grouping, and description.
- By default, Use path as display name (excluding
@) is enabled. Uncheck to modify the display name. - Unit configuration: Ensures query consistency. Default: None. Options: None/B/KB/MB/GB/TB/PB/μs/ms/s/min/h/day/week. Ensure unit consistency across different data sources through arithmetic processor configuration.
- Grouping (optional)
- Description (optional)
Query Results
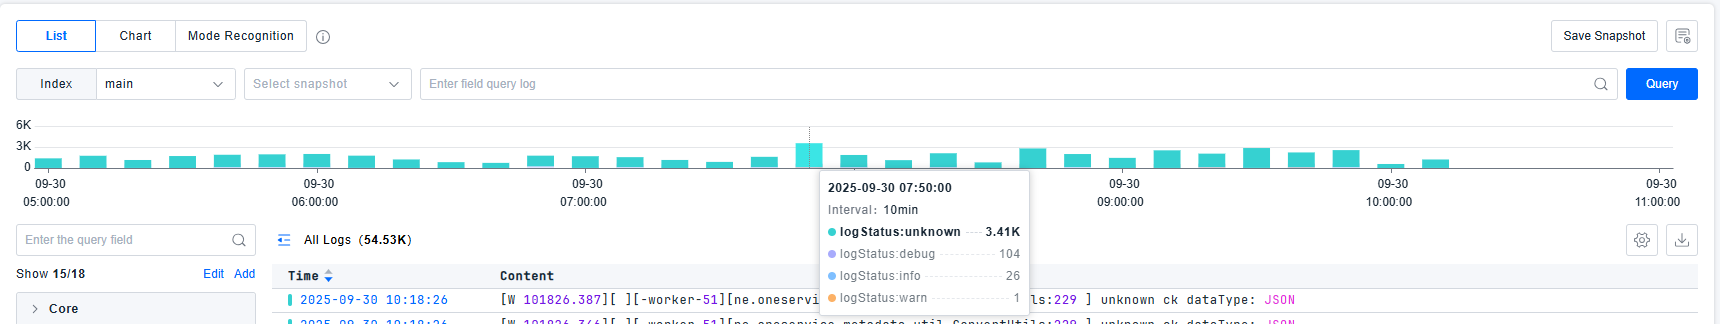
For optimal search efficiency with large log volumes, select precise time ranges. Matched search fields are highlighted.
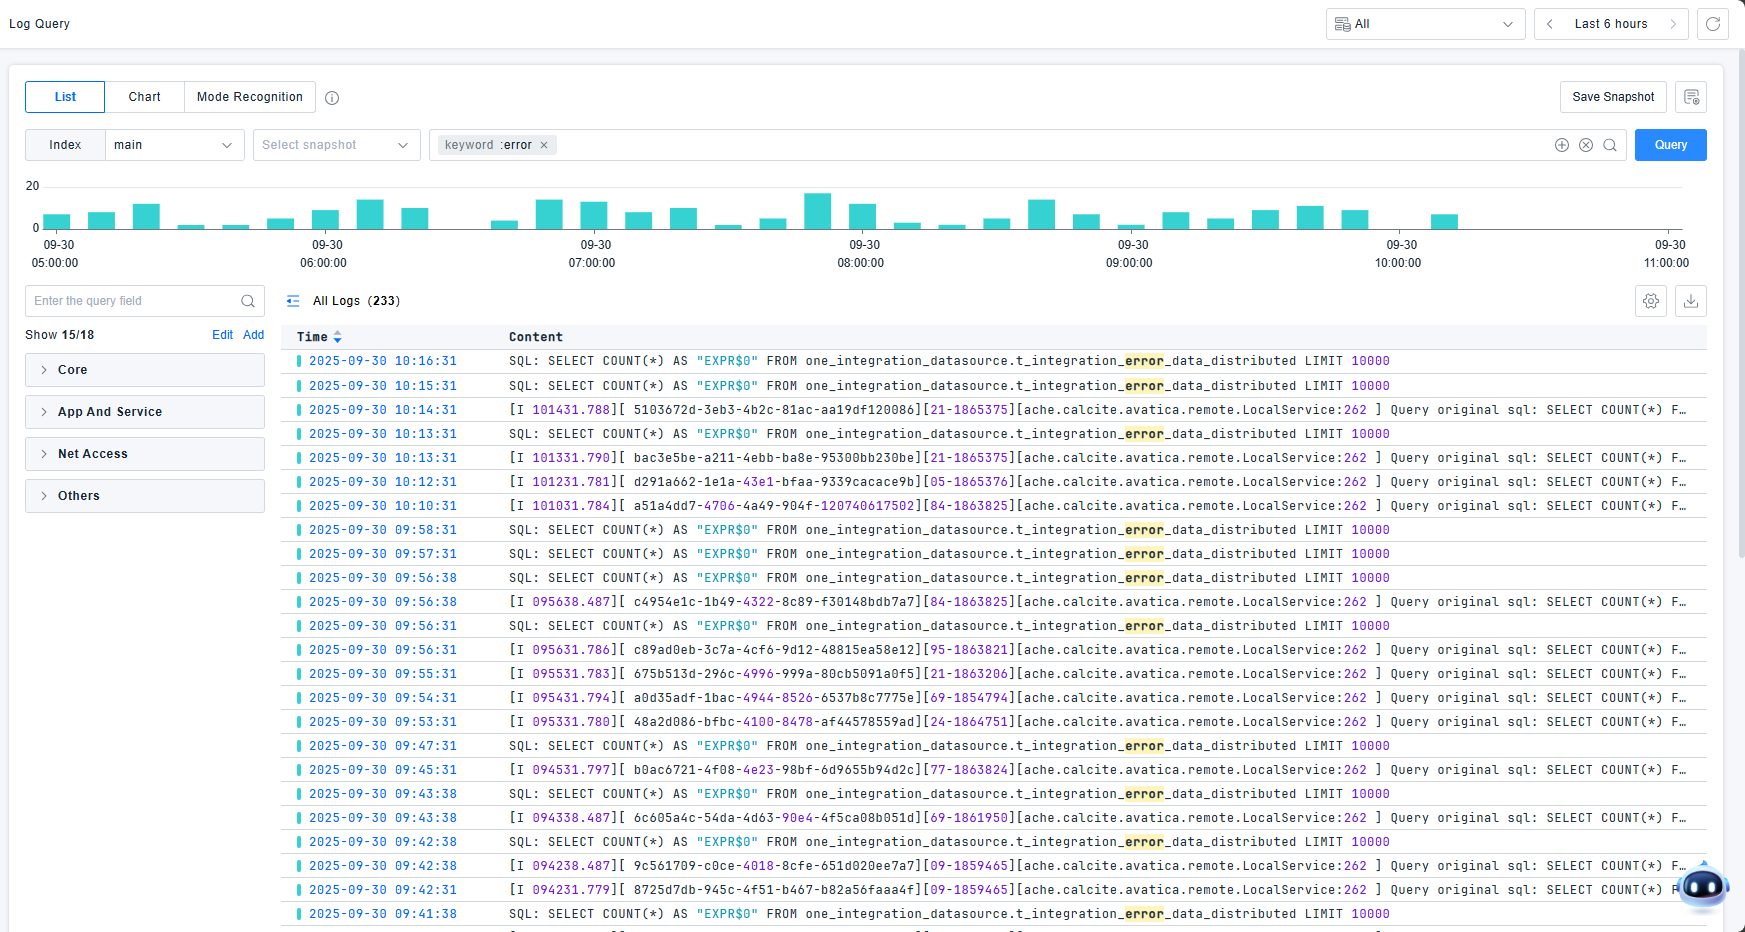
The platform provides status distribution charts to view log counts by status dimension. Click or drag to filter logs within specific time ranges.
Log Detail Page
The log detail page displays all detailed information collected for the specific log entry.
Key information is presented in card format, including Host, Service, Process, Source, etc.
Tags include:
- Built-in tags from the original log
- Automatically appended tags based on collection logic
- Tags configured in your collection settings
Original log content is stored, and event parsing attributes display structured information extracted or enhanced through processing pipelines.
Context Viewing: View contextual information based on collection path, host information, and log unique identifiers, simulating the experience of remotely accessing hosts and opening log files without the繁琐 steps.
Correlation Analysis: View metric trends from the host, container, or Pod entity where abnormal logs occurred, and examine entity attributes to assist with decisions like capacity expansion.
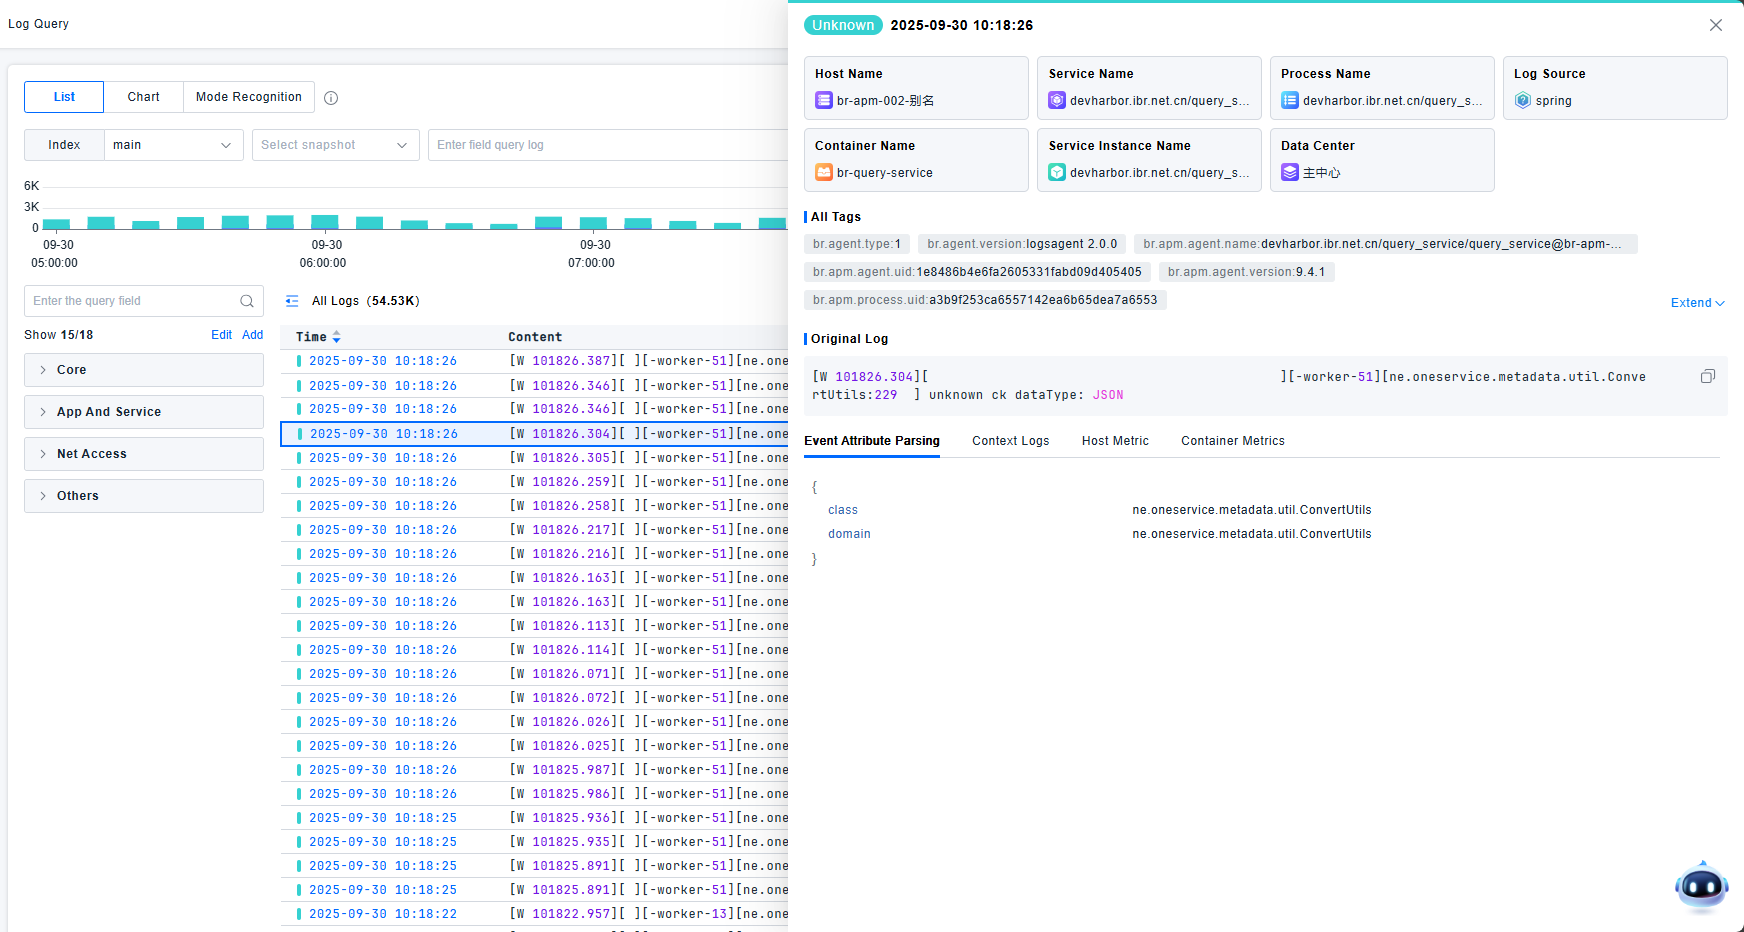
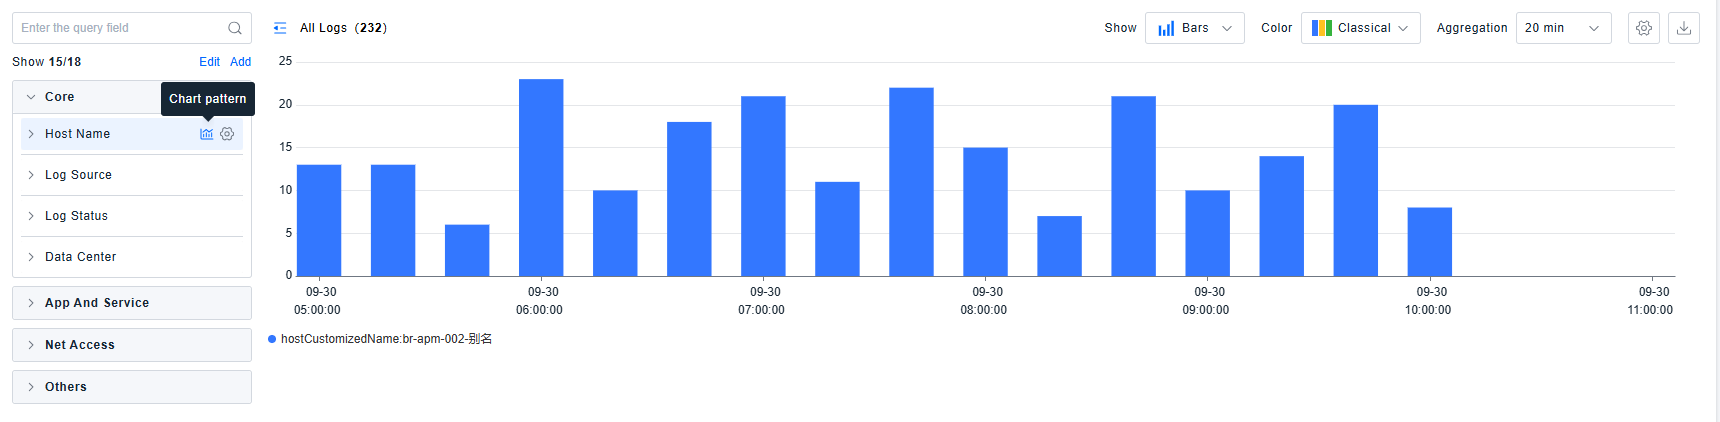
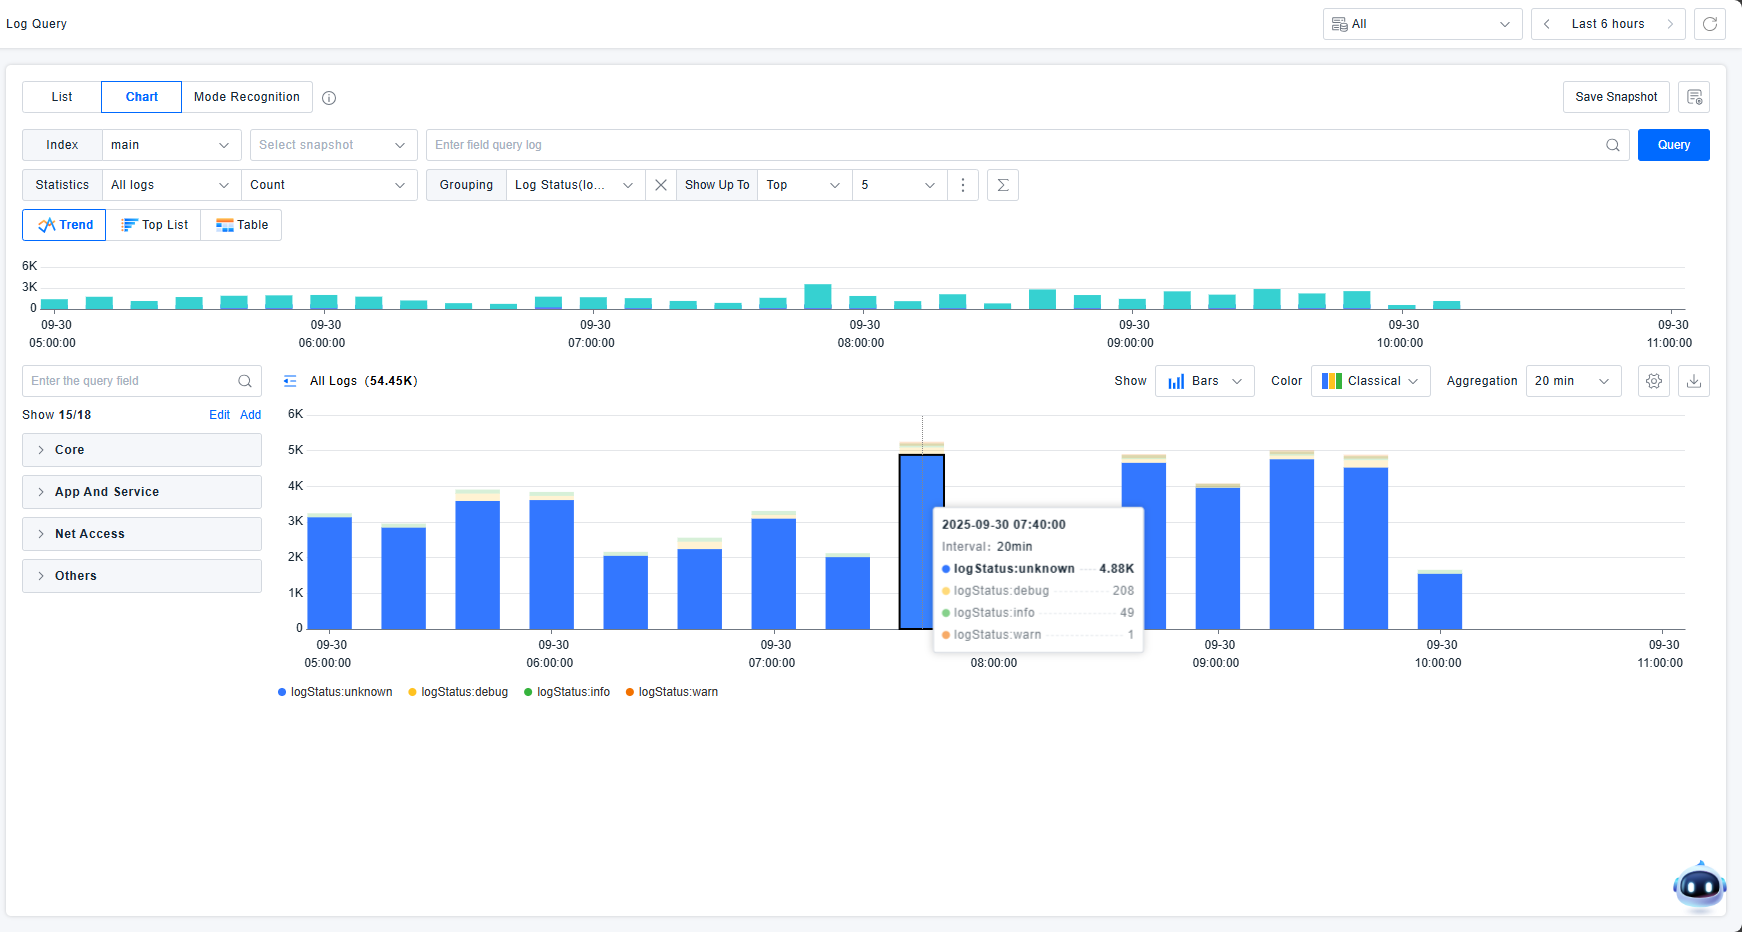
Chart Analysis
This mode supports statistical analysis of attribute values or log counts across multiple dimensions. View logs through trend charts, rankings, and tables.
Trend Charts
The platform supports trend chart visualization of log information. Input conditions to query expected logs, select statistical objects and methods, and view data across up to 5 dimensions. Statistical objects must be fields defined in quick filters.
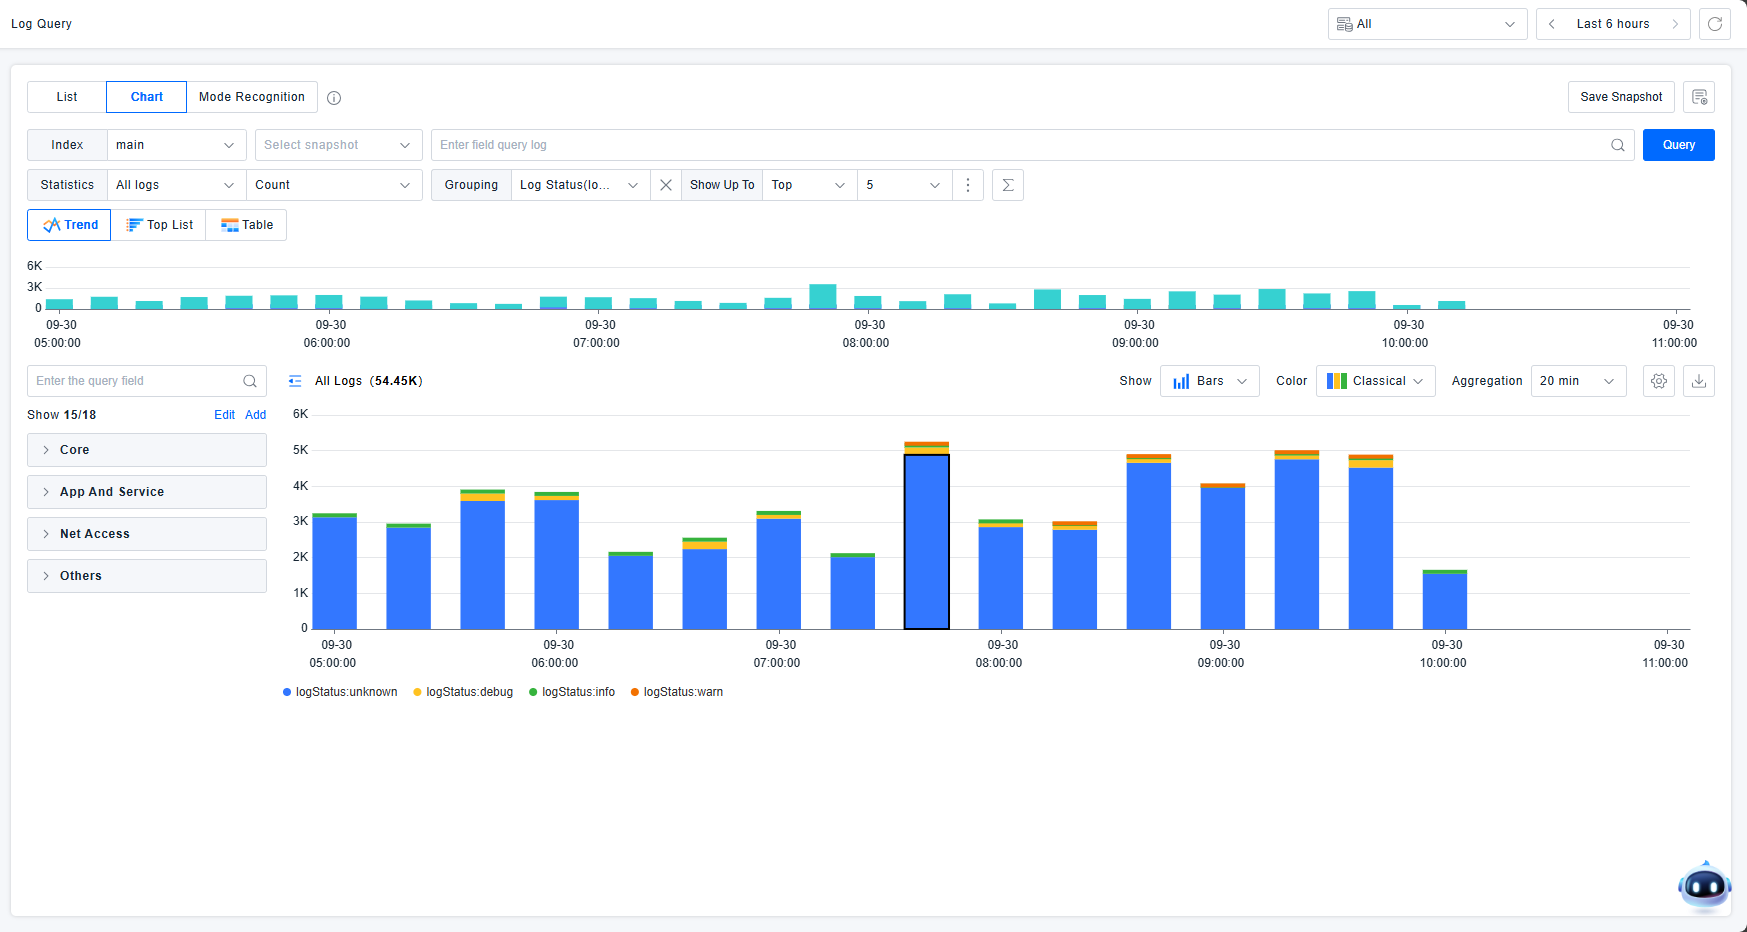
Statistical Objects:
- Qualitative (text): Statistical method fixed as Count. For other qualitative dimensions, fixed as Count Unique.
- Quantitative (numerical): Default statistical method: Avg. Options: Avg, Max, Median, Min, Pc75, Pc90, Pc95, Pc98, Pc99, Sum.
Dimensions:
- Default: "Everything" (no dimensional breakdown)
- Click "Everything" to display all qualitative filter attributes
Sorting Configuration: Control the order of statistical information display.
- Example: "Count unique services by status top 5 count by process"
- Meaning: Show TOP 5 services by status, ordered by process count (descending)
Sorting supports both qualitative and quantitative types:
- Qualitative (text): Options: all, other qualitative dimensions. "all" uses Count, other dimensions use Count Unique.
- Quantitative (numerical): Default: Avg. Options: Avg, Max, Median, Min, Pc75, Pc90, Pc95, Pc98, Pc99, Sum.
Hovering over dimension-based status charts highlights similar data and displays corresponding statistical values.
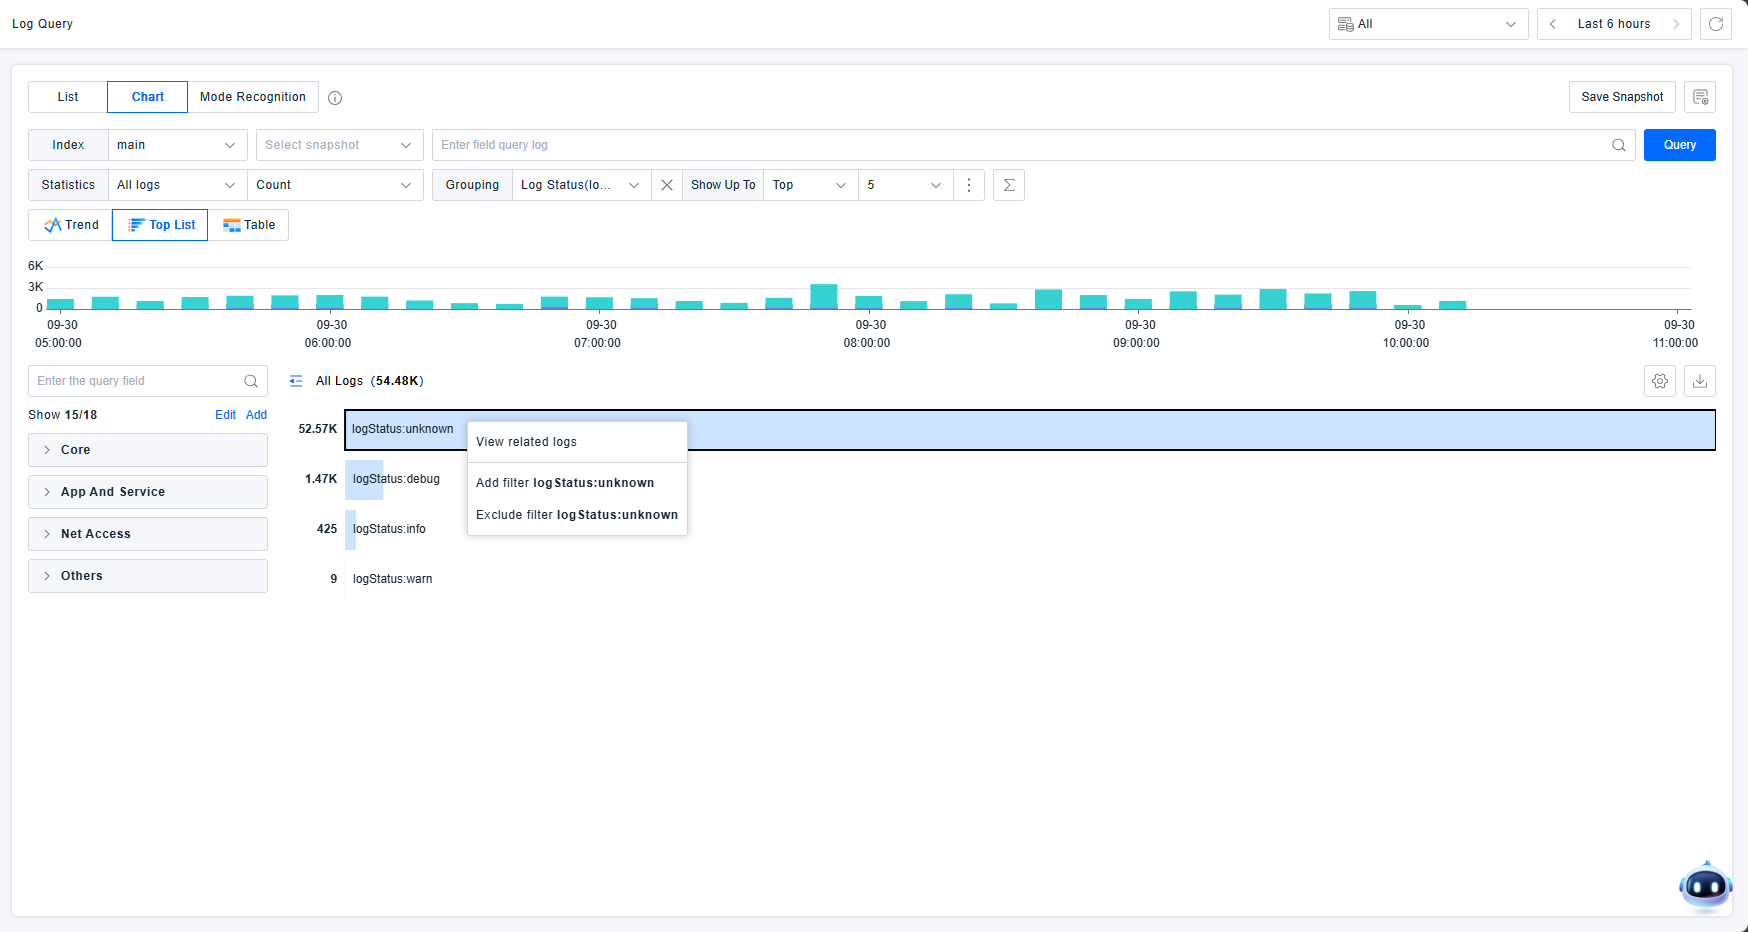
Interactive Chart Operations: Zoom, View Related Logs, Add Filter, Exclude Filter. Zooming focuses on specific time ranges.
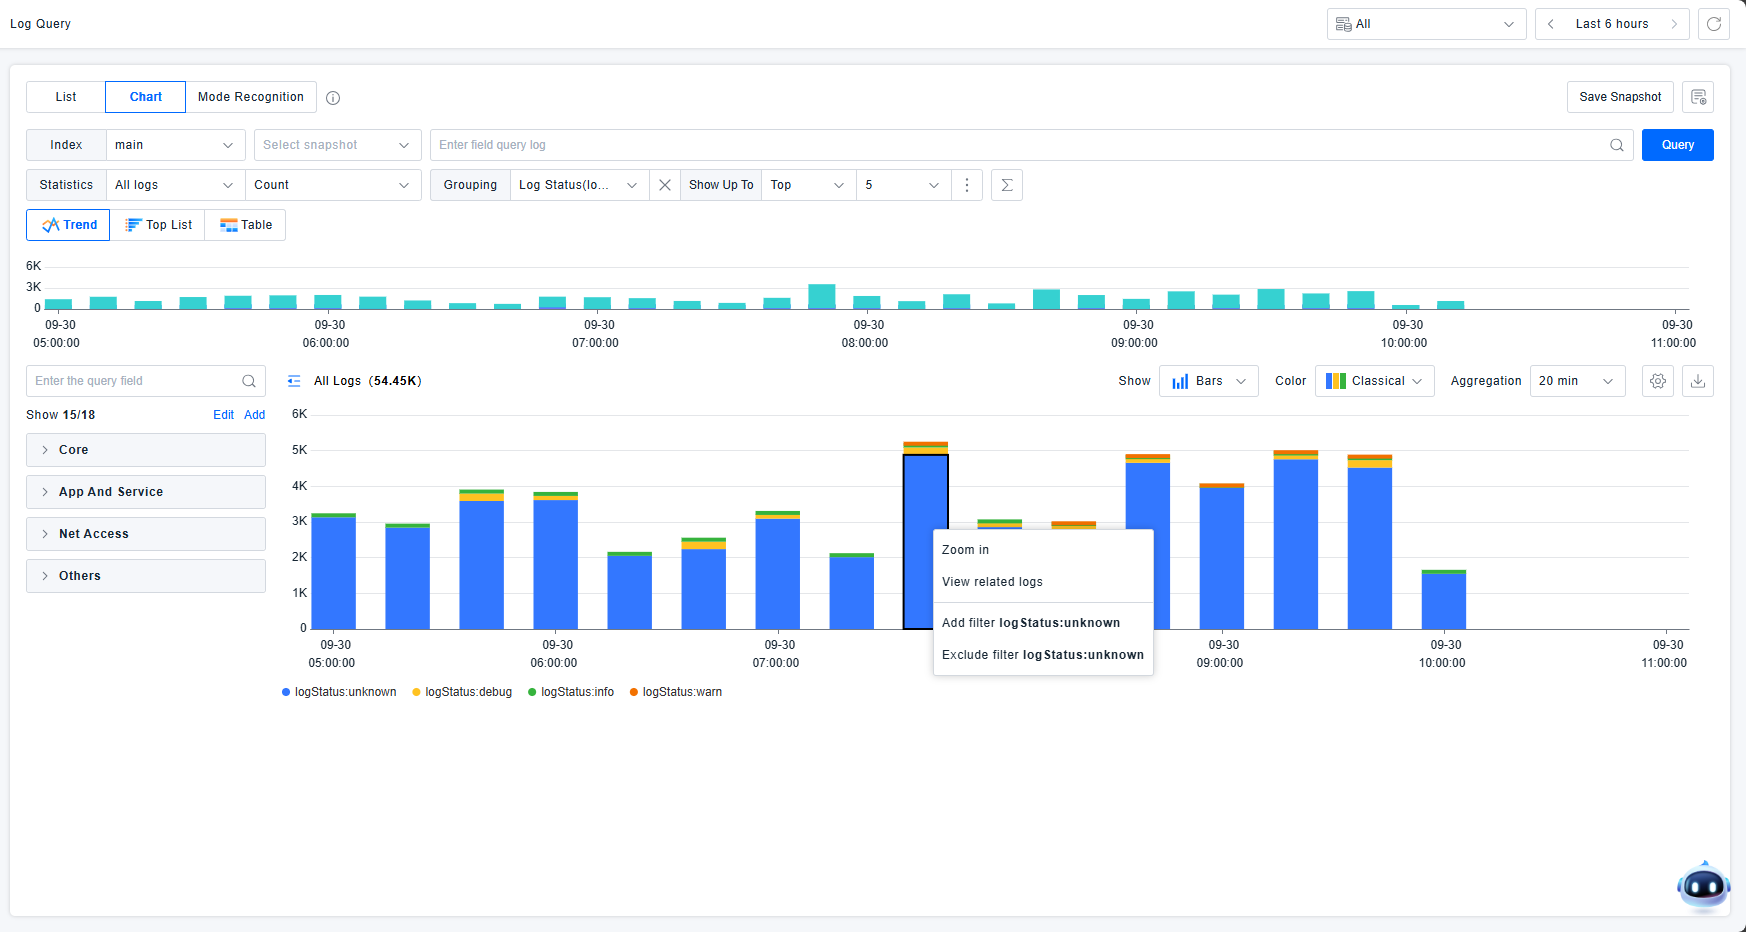
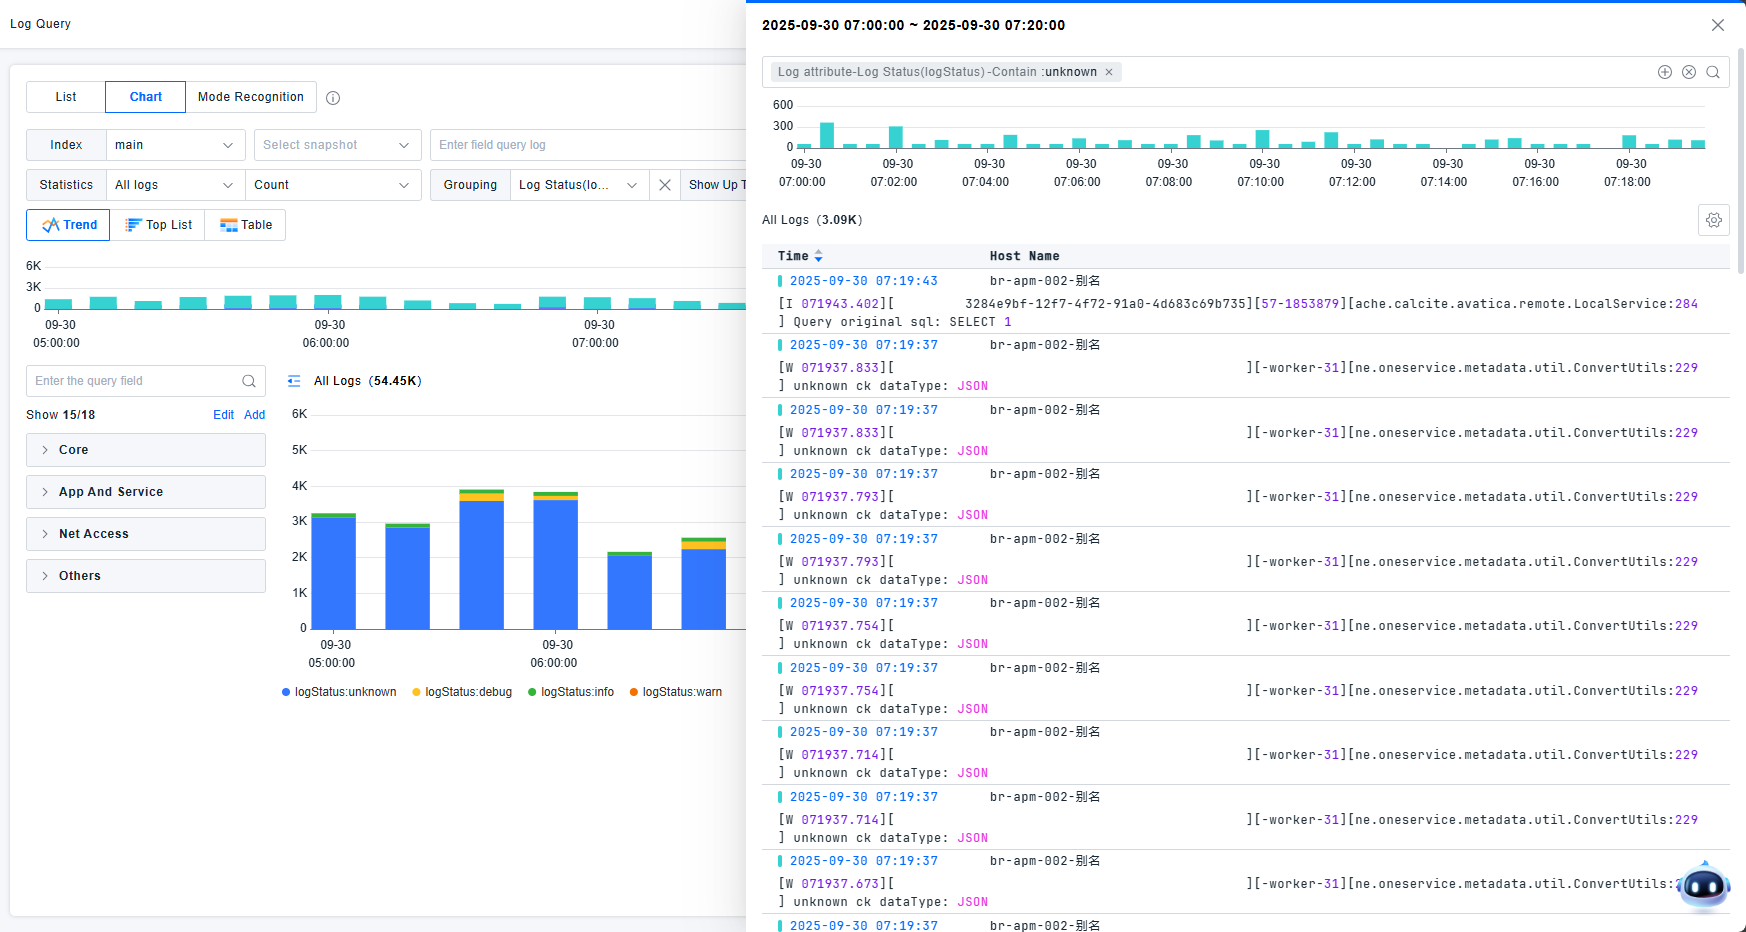
View Related Logs: Opens a drawer showing detailed log lists corresponding to chart elements. Related filter conditions appear in the drawer's filter box for granular data filtering and log detail examination.
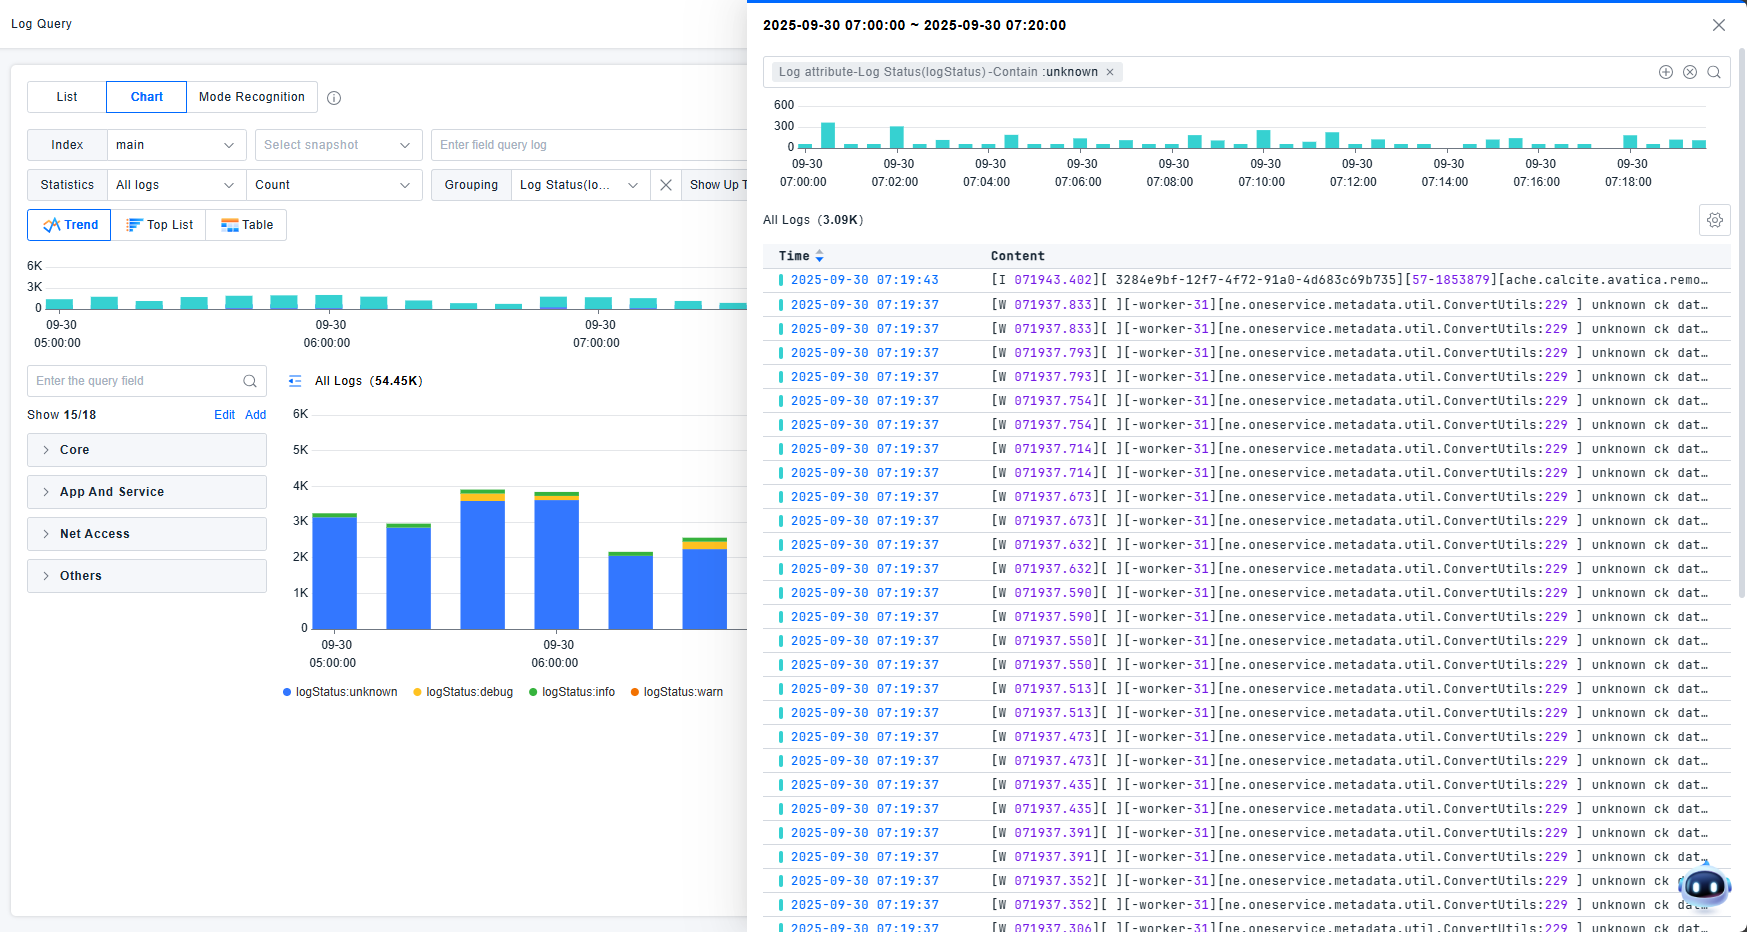
The list supports table header configuration and row count settings. Show/hide status distribution charts.
Rankings
View log information through ranking displays. Select one dimension for sorting. For multiple dimensions, use table mode. Each statistical entry supports viewing related logs and adding/excluding filter conditions.
Tables
View log information in table format.
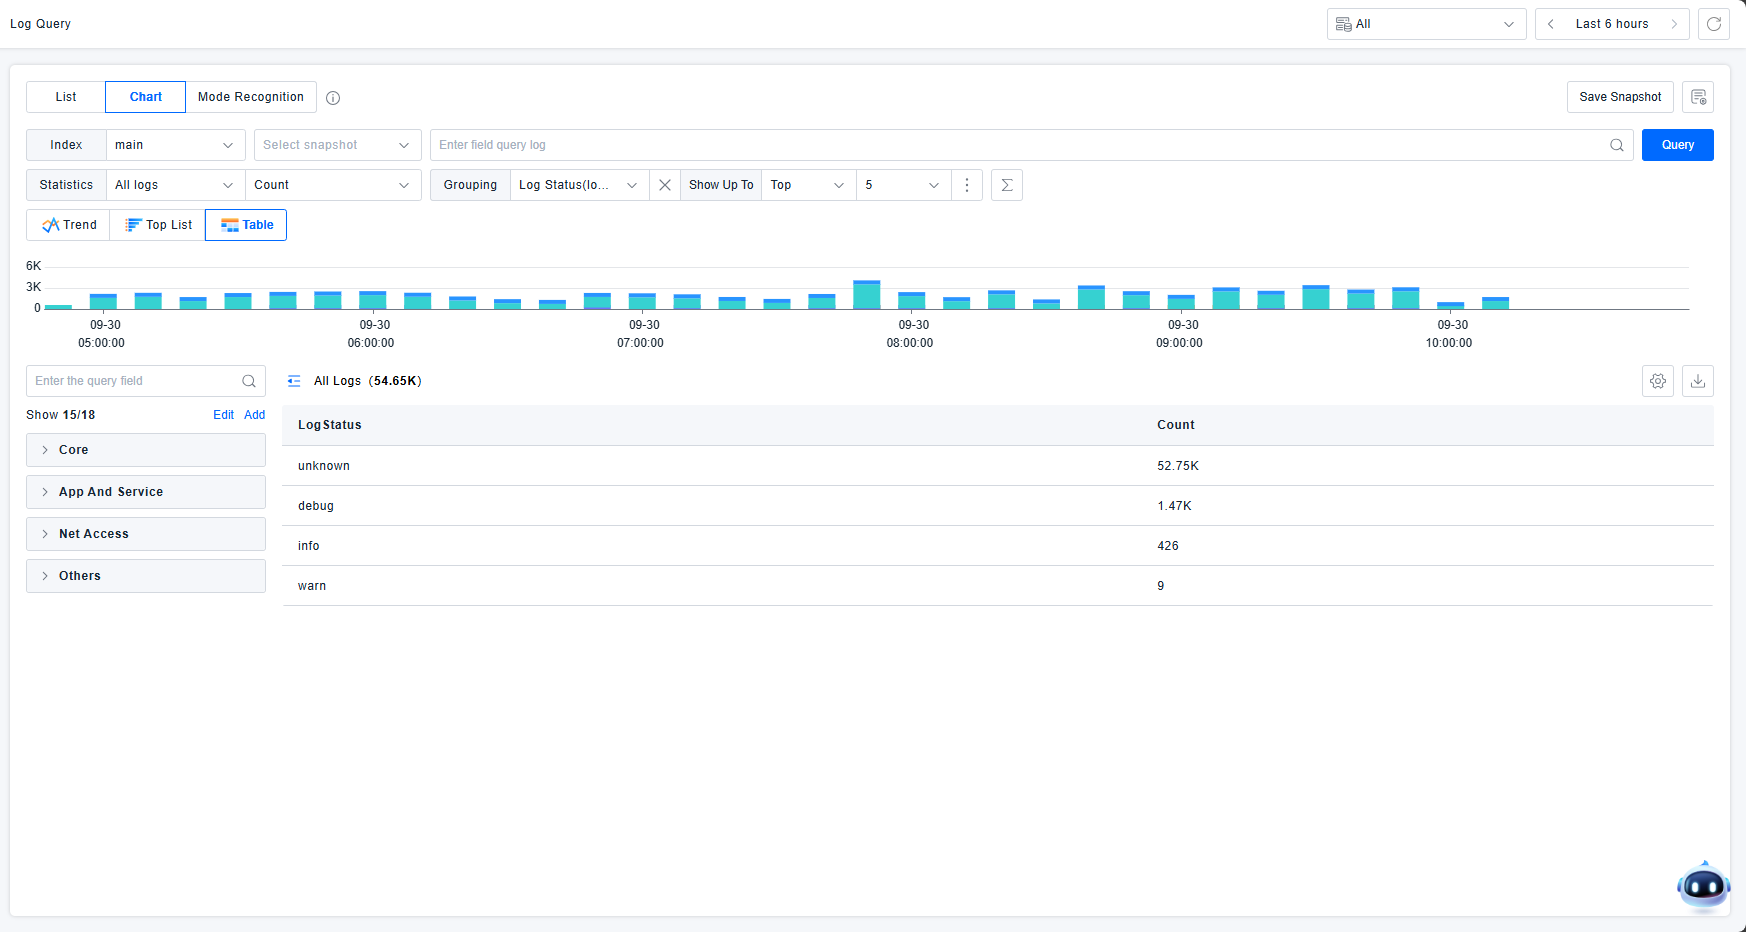
Tables display total counts for each dimension and support continuous dimensional breakdown. In this example:
- First row: Total log count across all dimensions
- Second row: Log count where logstatus is "unknown"
- Third row: Log count where logstatus is "debug"
This approach provides intuitive statistical overviews across dimensions, facilitating user problem analysis.
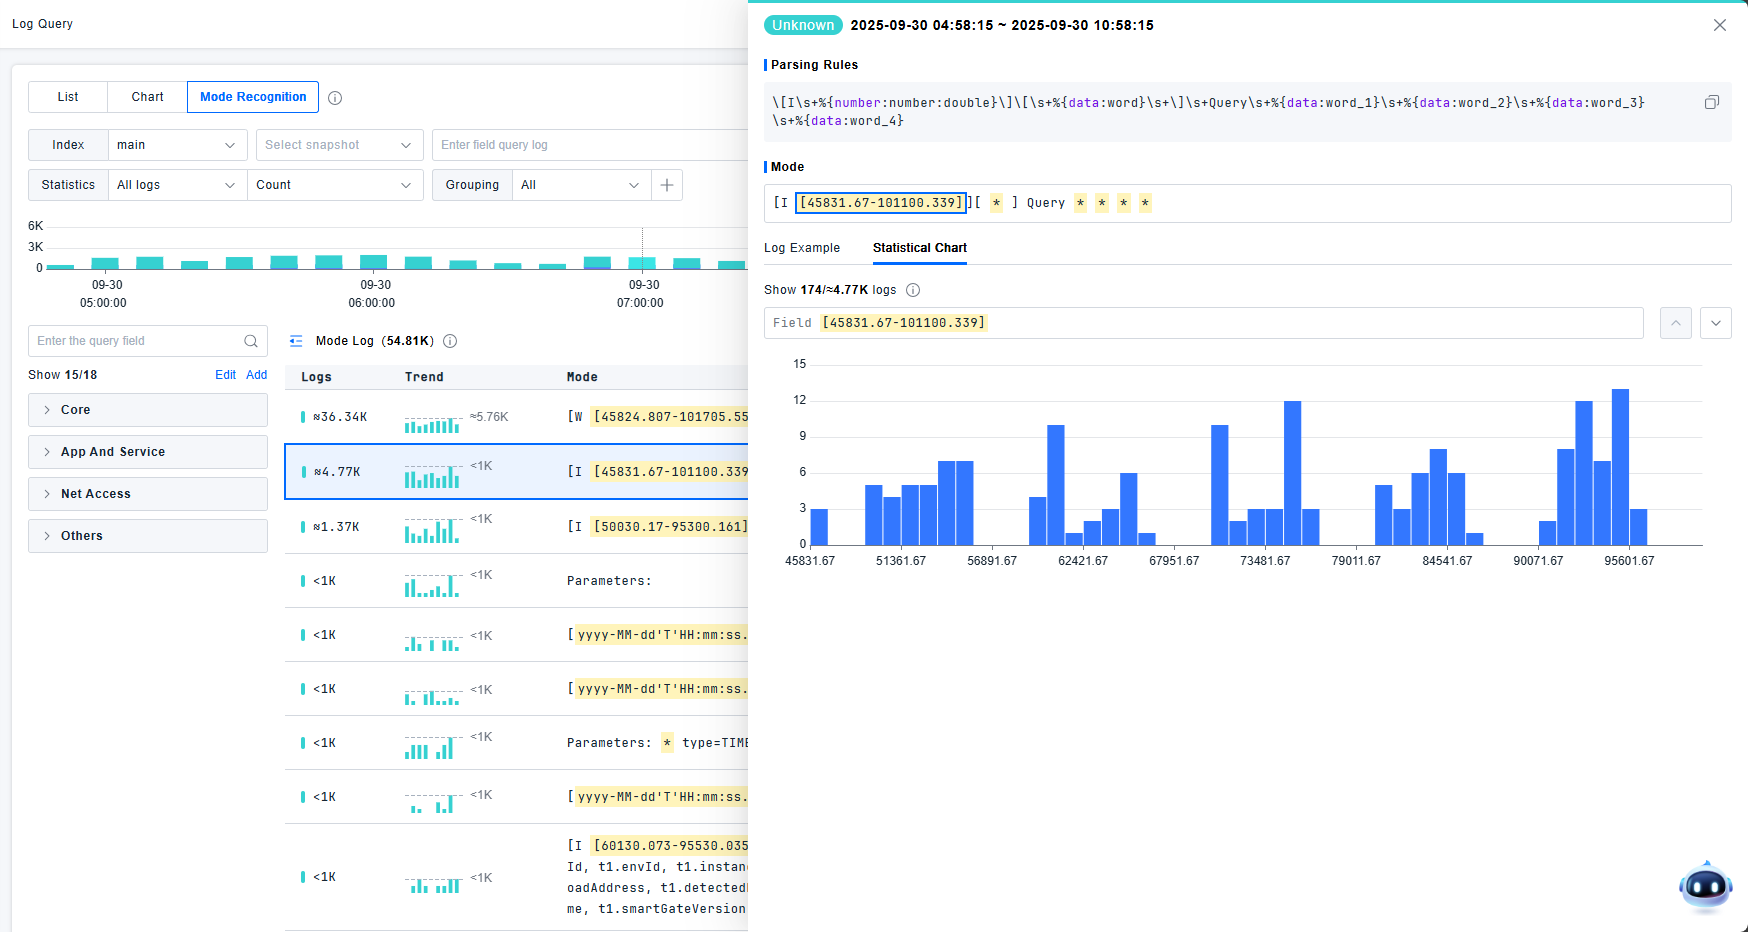
Pattern Recognition
Provides real-time analysis and clustering of log events for rapid anomaly identification. The platform supports viewing attribute values or log counts by custom dimensions, text similarity, and log status.
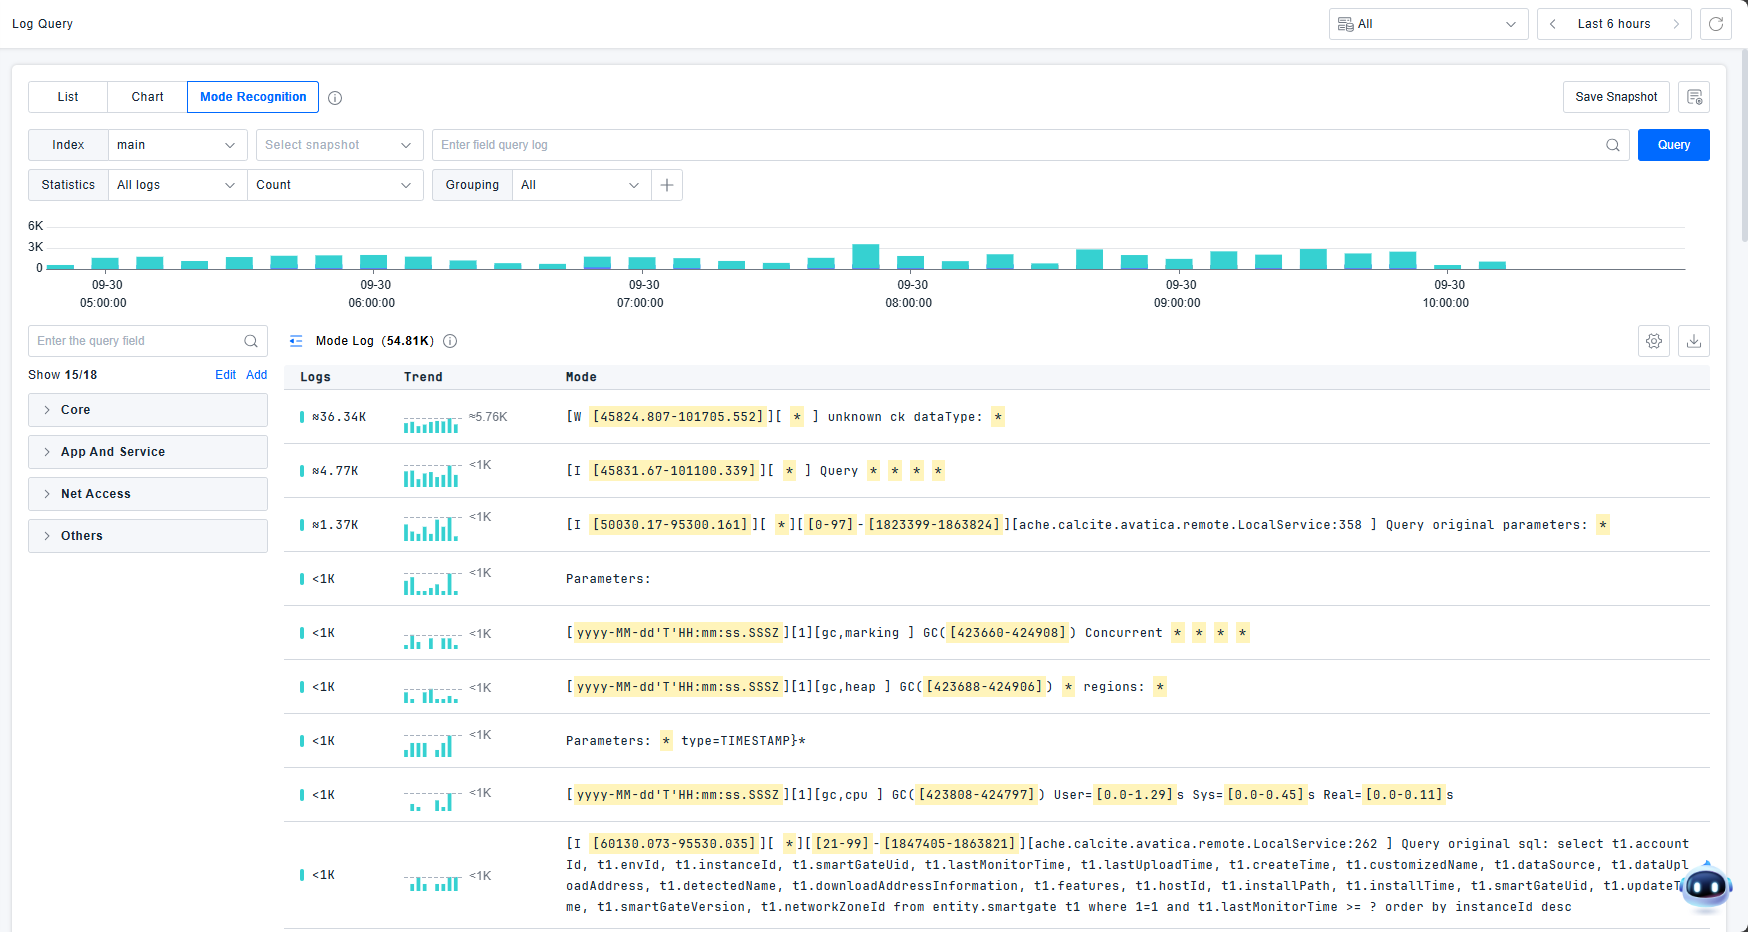
The pattern detail page displays the most severe log level and pattern recognition statements. Supports both detailed view and statistical chart view. In detailed log lists, users can click to view log details. Statistical charts are generated from randomly sampled 2,000 log entries. Up to 50 log examples are displayed.
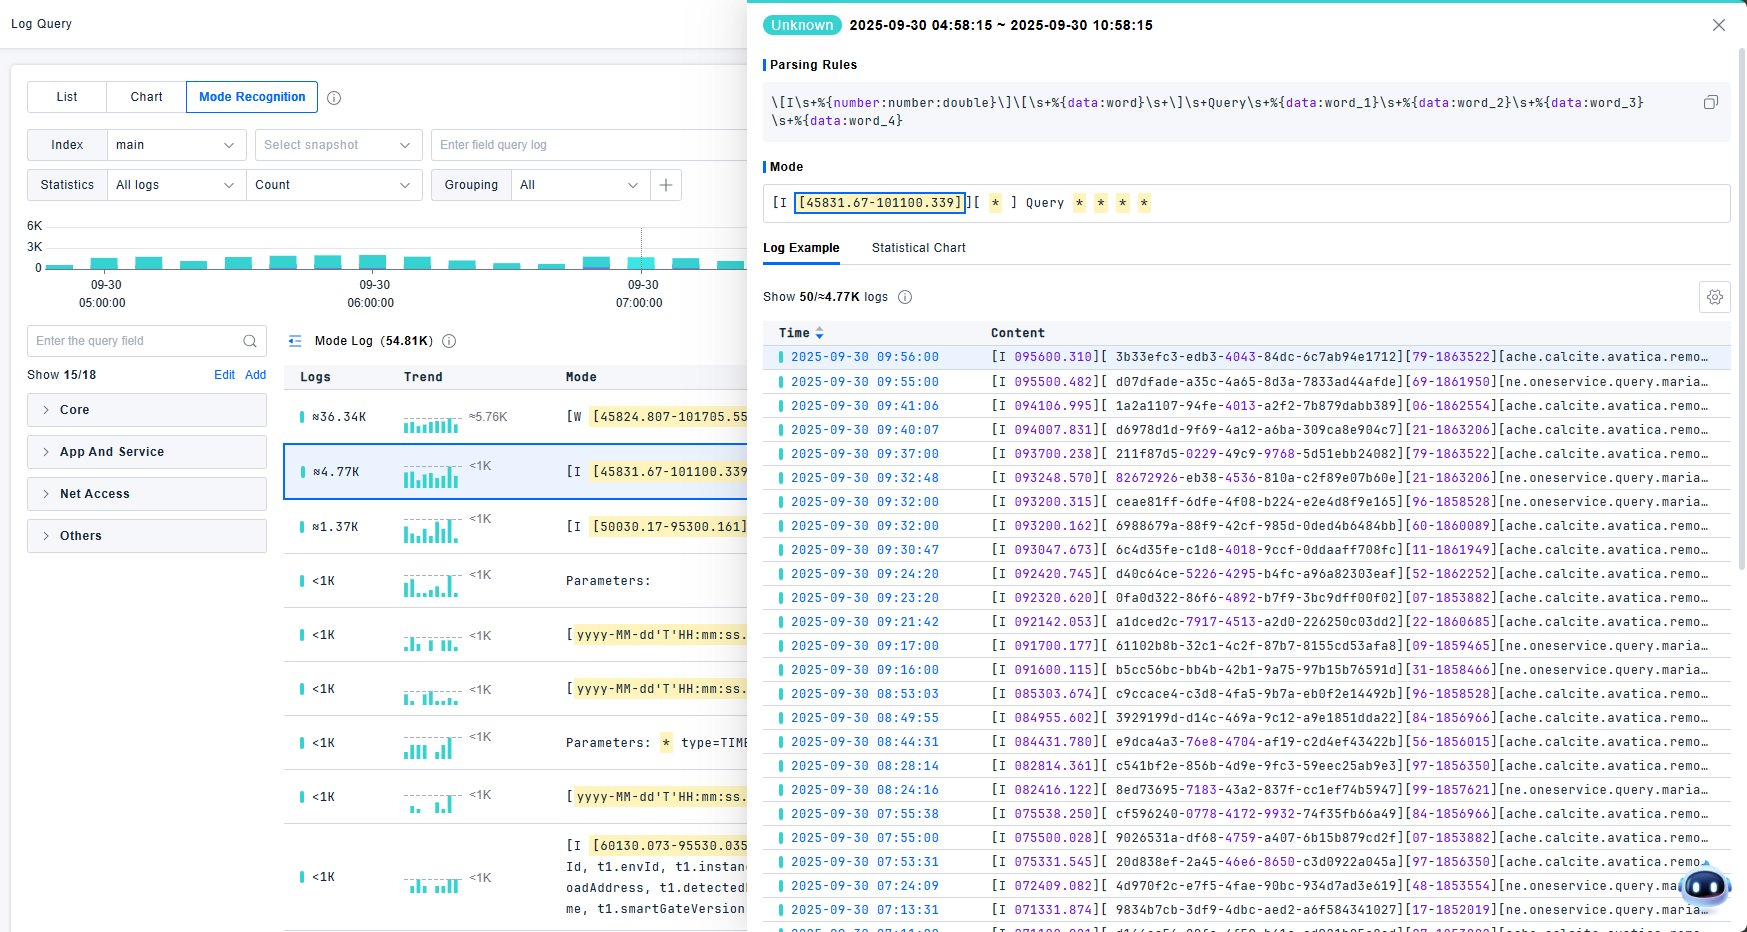
Click statistical charts to view TOP data statistics for each field. Supports both full statistics and sampled statistics. Navigate between fields using next/previous buttons. Click yellow areas to directly locate field statistics.
- Values with fewer than 50 unique entries: Displayed as enumerations
- Values with 50+ unique entries: Displayed as charts
Attributes
Reserved Attributes: These are attributes automatically extracted with the logs. They are fields required by the platform during the data collection preprocessing stage. This type of data is not solely obtained by parsing the log information; it can also be acquired by gathering associated log metadata. This data needs to be stored and supports filtering.
Standard Attributes: These are the backbone of an organization's naming conventions. Defined via the Standard Attributes module, they serve to unify concepts, aiming to achieve conceptual consistency and standardized format catalogs within an enterprise. Furthermore, different parsed attributes can be mapped via configuration to the same standard attribute. This allows users to map attributes from different sources to a single standard attribute, enabling filtering based on the standard attribute.
For example, client IP might have various log attributes like clientIP, client_ip_address, remote_address, client.ip, etc. Request execution time might be represented by exec_time, request_latency, request.time_elapsed, etc. Standard attributes aim to guide enterprises to use unified attribute names when actually outputting logs. They also provide the flexibility for customers to map parsed attributes to standard attributes.
After mapping parsed attributes to standard attributes, users can use either for troubleshooting. It is recommended to use standard attributes, as this simplifies correlation of content from different or heterogeneous sources and encourages their use over individual parsed attributes.
Parsed Attributes: Used for querying. These are attributes identified based on parsing rules. They have not been elevated to the status of a standard attribute and require configuration to be defined as one. Once a parsed attribute is mapped to a standard attribute, the original parsed attribute remains valid. However, typical users will no longer use that field, preferring the standard attribute instead. This makes correlating content from different sources more straightforward. If a user-configured parsed attribute name is identical to a standard attribute name, the platform will consider that parsed attribute to be the standard attribute.
Filter Attributes: Used for qualitative or quantitative data analysis, these are based on user-defined tags and attributes for indexed logs, plus some platform-built-in filter attributes. They are redefined filter attributes based on standard or parsed attributes. Attributes defined this way take effect for subsequently collected logs; historical logs are not affected. Note that fields of mapper type, and attributes from geoip or url parsing, are considered built-in filter attributes.
Reserved Attributes
Reserved attributes are fields collected by default.
| Field Name | Description |
|---|---|
| indexName | The index name abstracted at the user layer. |
| pattern | The Grok pattern statement. |
| uid | Unique log ID identifier. |
| traceId | Trace ID, used for distributed tracing. |
| spanId | Span ID, used for distributed tracing. |
| sessionId | Session ID, for RUM sessions. |
| actionId | Action ID, for RUM actions. |
| deviceId | Device ID, a general term for backend hosts & terminal devices. |
| deviceName | Device name. |
| serviceId | Service ID, a concept in APM. |
| serviceName | Service name. |
| processId | Process unique identifier. |
| processName | Process name. |
| appId | Application ID, a RUM concept. |
| appName | Application name, a RUM concept. |
| status | Log status. Has seven types: Emergency, Error, Warn, Notice, Info, Debug, Unknown. |
| source | Log source, e.g., java, nginx. |
| body | The original log text. |
| monitorTime | The log collection timestamp. |
Standard Attributes (Initial)
| Attribute Path | Display Name | Group | Format | ETL Parsing |
|---|---|---|---|---|
| network.client.geoip.country.name | Country Name | Geoip | string | .country |
| network.client.geoip.district.name | District Name | Geoip | string | .district |
| network.client.geoip.city.name | City Name | Geoip | string | .city |
| http.url_details.host | URL Host | Web Access | string | .host |
| http.url_details.port | URL Port | Web Access | string | .port |
| http.url_details.path | URL Path | Web Access | string | .path |
| http.useragent_details.browser.family | Browser | Web Access | string | .browserName |
| http.useragent_details.os.family | Os | Web Access | string | .osName |
Filter Attributes (Initial)
Filter attributes generated based on built-in attributes: Reserved attributes do not support editing.
| Attribute Path | Display Name | Group | Format |
|---|---|---|---|
| -- | Index | Core Fields | string |
| -- | Source | Core Fields | string |
| -- | Host | Core Fields | string |
| -- | Service | Core Fields | string |
| -- | Status | Core Fields | string |
Filter attributes generated based on parsers: geoip / useragent / url
| Attribute Path | Display Name | Group | Format | ETL Parsing |
|---|---|---|---|---|
| network.client.geoip.country.name | Country Name | Geoip | string | .country |
| network.client.geoip.district.name | District Name | Geoip | string | .district |
| network.client.geoip.city.name | City Name | Geoip | string | .city |
| http.url_details.host | URL Host | Web Access | string | .host |
| http.url_details.port | URL Port | Web Access | string | .port |
| http.url_details.path | URL Path | Web Access | string | .path |
| http.useragent_details.browser.family | Browser | Web Access | string | .browserName |
| http.useragent_details.os.family | Os | Web Access | string | .osName |
Tags
Tags are log identifiers defined by the platform or users.
The platform supports automatic tag extraction, supports built-in tags from agents, and supports manual tag configuration based on paths.
The platform's built-in tags are as follows:
| Field | Description | Required |
|---|---|---|
| log.source | Log file path, or log content source (e.g., windows event) | Required |
| br.agent.version | Log agent version | Required |
| br.machine.guid / deviceId | Machine GUID. Both br.machine.guid and deviceId are reported. | Required |
| br.apm.process.uid | APM process UID (process instance) | Optional |
| br.apm.process_group.name | APM process group name | Optional |
| br.apm.agent.uid | APM application agent UID | Optional |
| br.apm.agent.version | APM application agent version | Optional |
| br.process.technology | Process technology type. Concatenation method: key:version | Optional |
| container.image.name | Container image name | Optional |
| container.name | Container name | Optional |
| container.id | Container ID | Optional |
| br.kubernetes.cluster.name | Platform-assigned Kubernetes cluster name | Optional |
| kubernetes.node.system_uuid | Optional | |
| kubernetes.cluster.id | Optional | |
| kubernetes.namespace.name | Optional | |
| kubernetes.pod.uid | Optional | |
| kubernetes.pod.name | Optional | |
| kubernetes.container.name | Optional | |
| kubernetes.deployment.name | Optional | |
| host.name | Hostname. Both host.name and deviceName are reported. | Required |
| br.agent.type | Log agent type. Enum: Host: 1: Server Agent Linux, 2: Server Agent Linux-Arm, 3: Server Agent Windows Device: 100: Android, 101: iOS, 102: Web | Required |
| br.token | Data reporting token (account GUID) | Required |
| host.ip | Host IP | Optional |
| tag | Platform-assigned tag | If Present |
Keywords
The original log text undergoes tokenization, and each resulting term becomes a searchable keyword.
During full-text search, textual data requires tokenization. Tokenization is the process of breaking down raw text into meaningful lexical units.
First, the raw text undergoes character filtering to remove special characters, punctuation, etc., retaining only meaningful content.
Then, the text is fed into a tokenizer, which segments the text into lexical units (tokens). Tokenizers operate based on different rules and algorithms, such as splitting on whitespace or according to language-specific characteristics.
Next, the tokens pass through a series of token filters. These filters can remove stop words (common words like "a", "an", "the"), convert tokens to lowercase, perform stemming, etc., to reduce redundancy and improve search accuracy.
During analysis, each token is assigned a position increment, indicating its position within the original text. This positional information is important for subsequent searching and ranking.
Finally, the tokens and their positional information are organized into an inverted index. The inverted index maps each token to a list of documents containing it, enabling fast full-text search.
The tokenization process plays a key role in full-text search, enabling the search engine to understand and process textual data, thereby improving search accuracy and efficiency. The tokenization process can be configured as needed and supports custom tokenization rules and filter operations.