Systems
The Systems feature provides users with comprehensive observability of business system operational status, supporting the automatic aggregation of agent-identified services into logical systems by business dimension, covering multiple entity types such as services, service instances, processes, hosts, containers, databases, and message queues.
By aggregating metrics, traces, logs, and alert data from all associated entities within the system, it clearly presents the system's operational status and upstream/downstream dependencies through pages such as the system health wall, vertical architecture, and call relationships. This feature helps users centrally manage system assets by business line, quickly identify abnormal systems and fault root causes, integrate multi-dimensional data for end-to-end analysis, and effectively support daily inspections, fault troubleshooting, and performance optimization scenarios, significantly improving overall cross-business system operation and maintenance efficiency.
Core Capabilities
- System Health Wall: Displays the operational status of all systems grouped by business line, real-time presentation of key metrics such as response time, error rate, and throughput, with abnormal systems marked in alert colors for quick problem identification.
- Flexible Grouping and Hierarchy Management: Supports up to three levels of grouping nesting and two levels of system hierarchy. You can group systems by business line, product line, and other dimensions, and quickly adjust the organizational structure through drag-and-drop.
- Vertical Topology Analysis: Intuitively displays the complete architecture deployment of the system through topology diagrams, with real-time marking of abnormal nodes, helping you quickly clarify upstream/downstream dependencies between services and locate fault root causes.
- Multi-dimensional Drill-down Troubleshooting: One-click drill-down from abnormal nodes to dimensions such as alerts, metric trends, traces, logs, and call relationships, achieving an efficient closed loop from "problem discovery" to "root cause location".
- Custom Views: You can arrange related metrics in the same view to form a context-complete associated analysis panel, avoiding isolated viewing of single metrics.
Usage Scenarios
- Cross-business Inspection Scenario: In scenarios where operation and maintenance teams need to focus on multiple business lines simultaneously, you can use the system observability capability to overview the operational status of all systems by group in the system health wall, quickly identify abnormal systems through alert colors, and drill down for processing, significantly improving inspection efficiency.
- System Organization Management Scenario: In scenarios where enterprises maintain a large number of systems by business line or product line, you can use the system's multi-level grouping and drag-and-drop capabilities to classify systems by organizational structure, and complete the continuous maintenance of system assets through operations such as editing, deleting, and adding subsystems.
- Fault Troubleshooting Scenario: In scenarios where a system's response time suddenly increases and alerts occur, you can use the system's multi-dimensional drill-down capability to first locate abnormal entities through vertical architecture, then drill down into traces and logs to restore the fault scene, and finally confirm the root cause in the Alerts tab to achieve a closed loop.
- Performance Optimization Scenario: In scenarios where you need to analyze the performance of system calls to external dependencies (databases, message queues, etc.), you can use the system's relationship page and call relationship topology to analyze by service and interface dimensions, accurately identify bottleneck interfaces, and orchestrate key metrics into custom views for continuous monitoring.
Getting Started
Enter the Systems & Services -> Systems page to access the systems page, which defaults to the System Health Wall page.
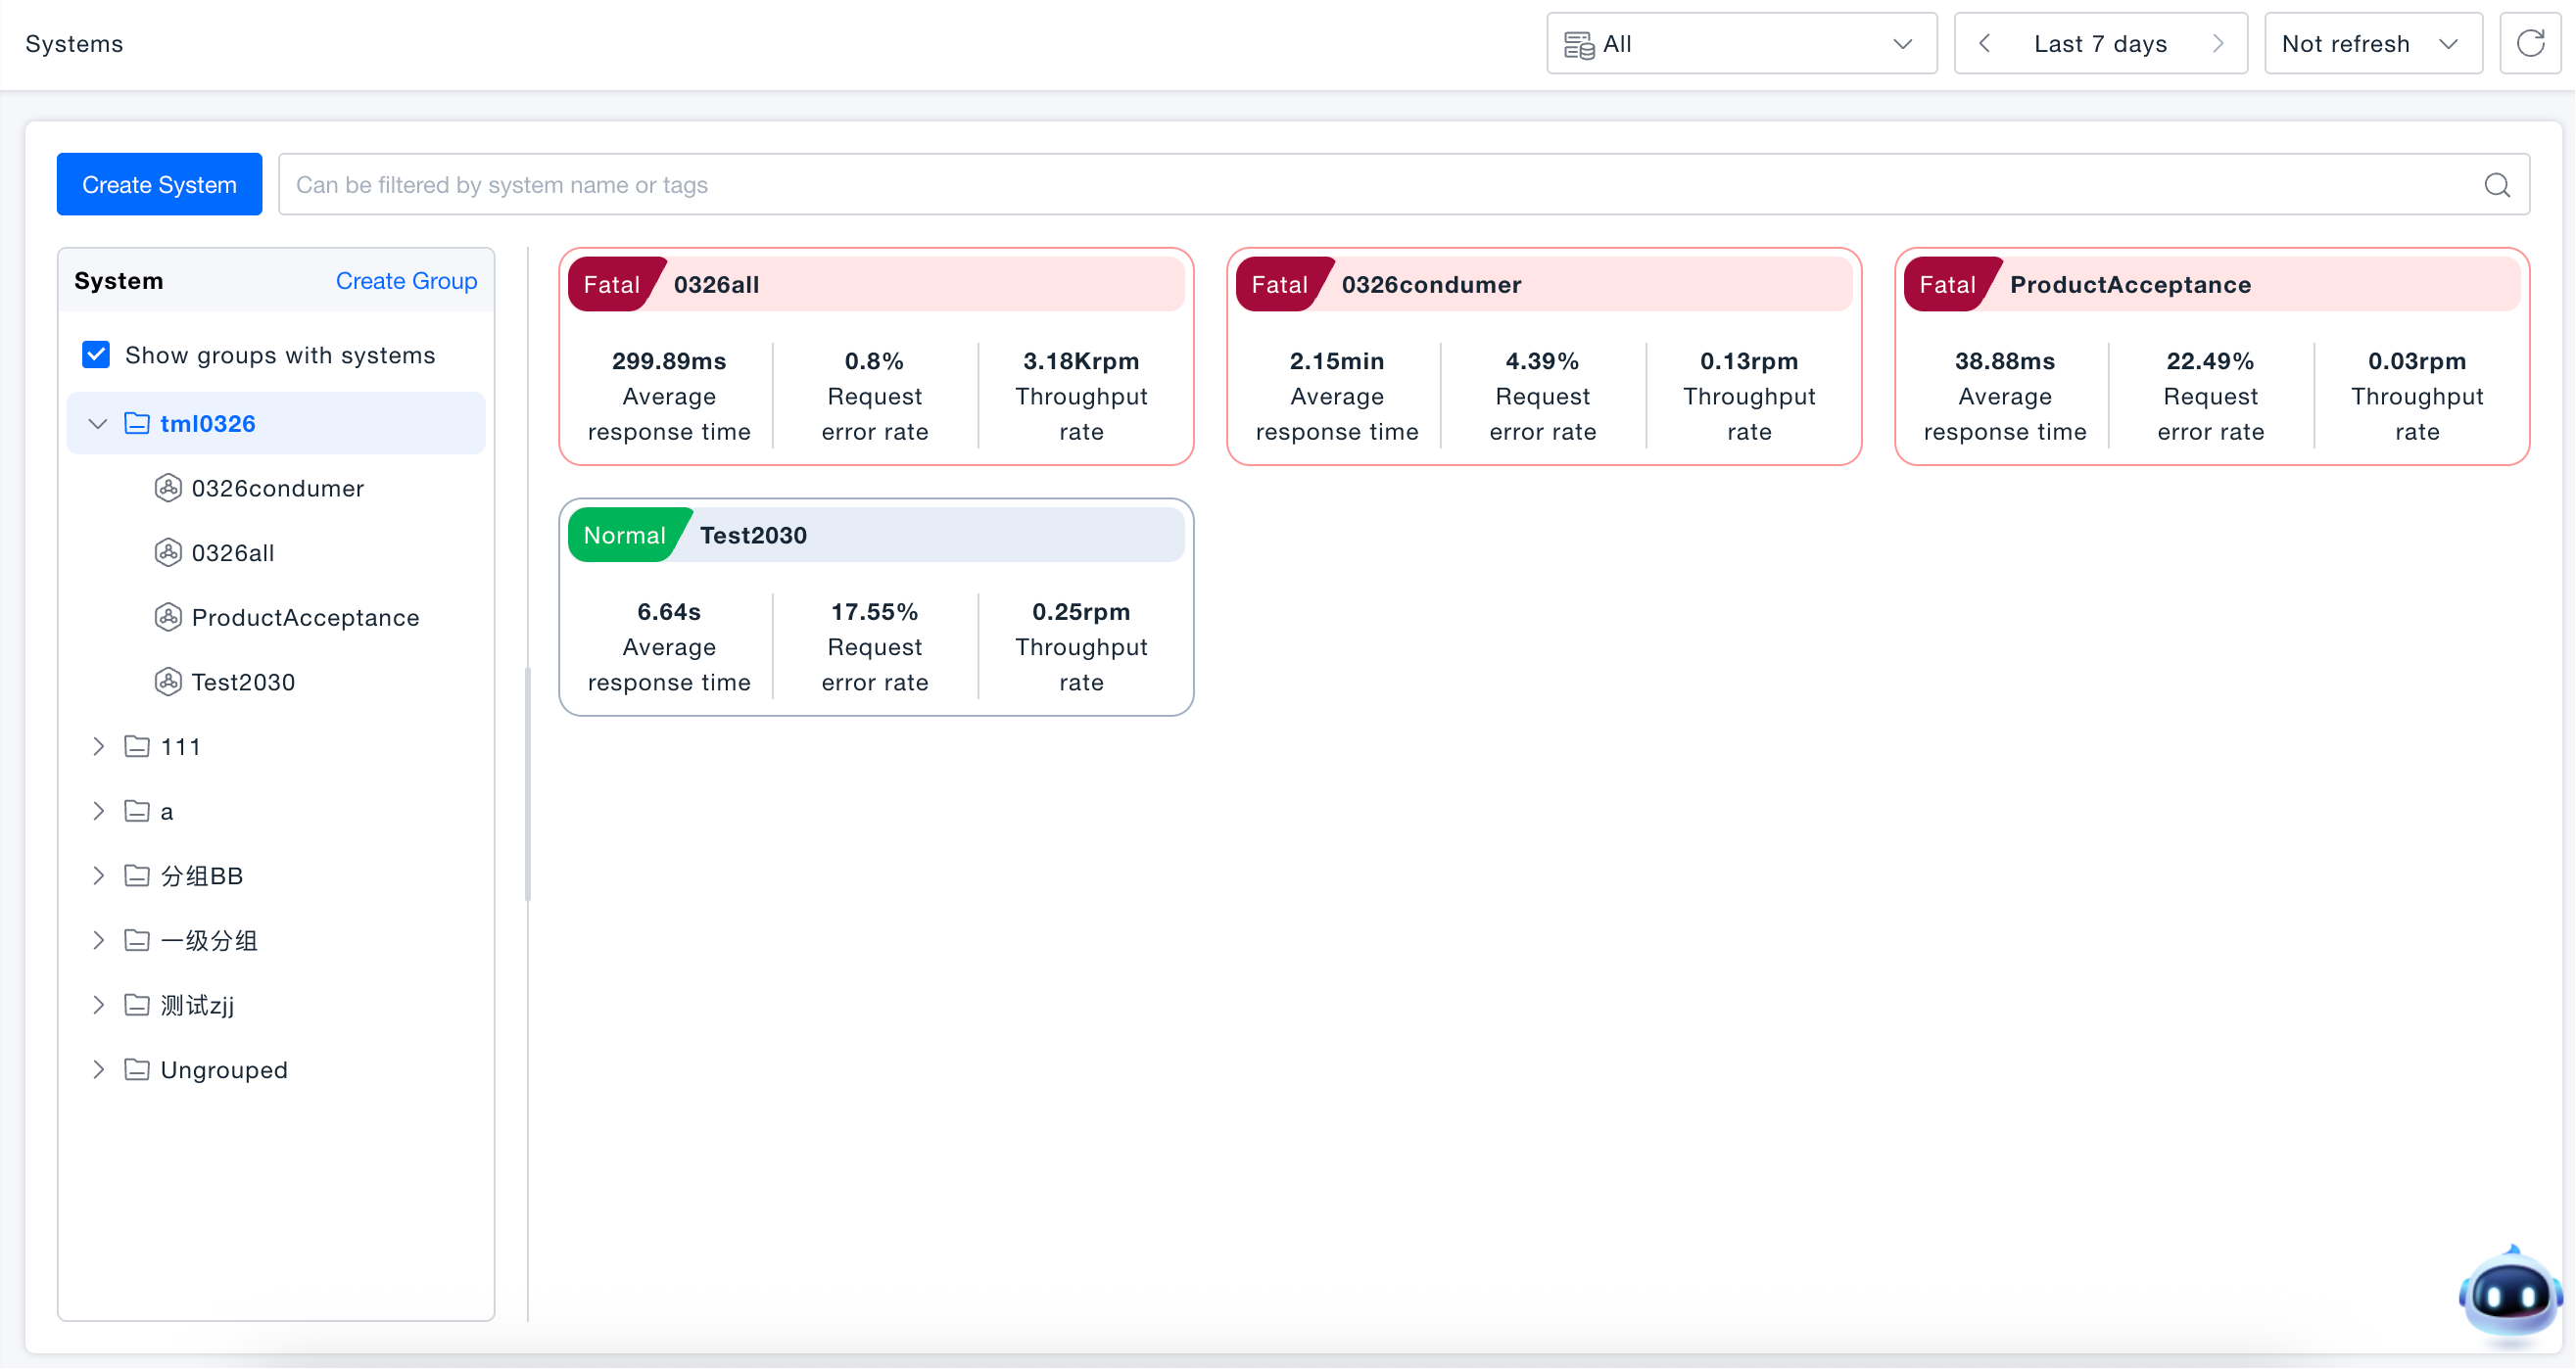
System Health Wall
The System Health Wall page adopts a left-right structure: the left side is the grouping tree, and the right side is the system health card wall.
- You can filter systems by business line through the grouping tree, or filter by name or tag through the search bar. After selecting a group, the right side displays all parent system cards under that group; after selecting a parent system, it displays all its subsystems. Checking "Only show groups with systems" can hide empty groups.
- The health status of all systems is displayed in card form. If alerts are generated, the system card is rendered in red. Alert data is taken from the current system and all service entities associated with subsystems, with the highest alert level displayed in the upper left corner of the card. The card also synchronously displays core operational metrics including average response time, request error rate, and throughput, intuitively presenting an overview of system performance.
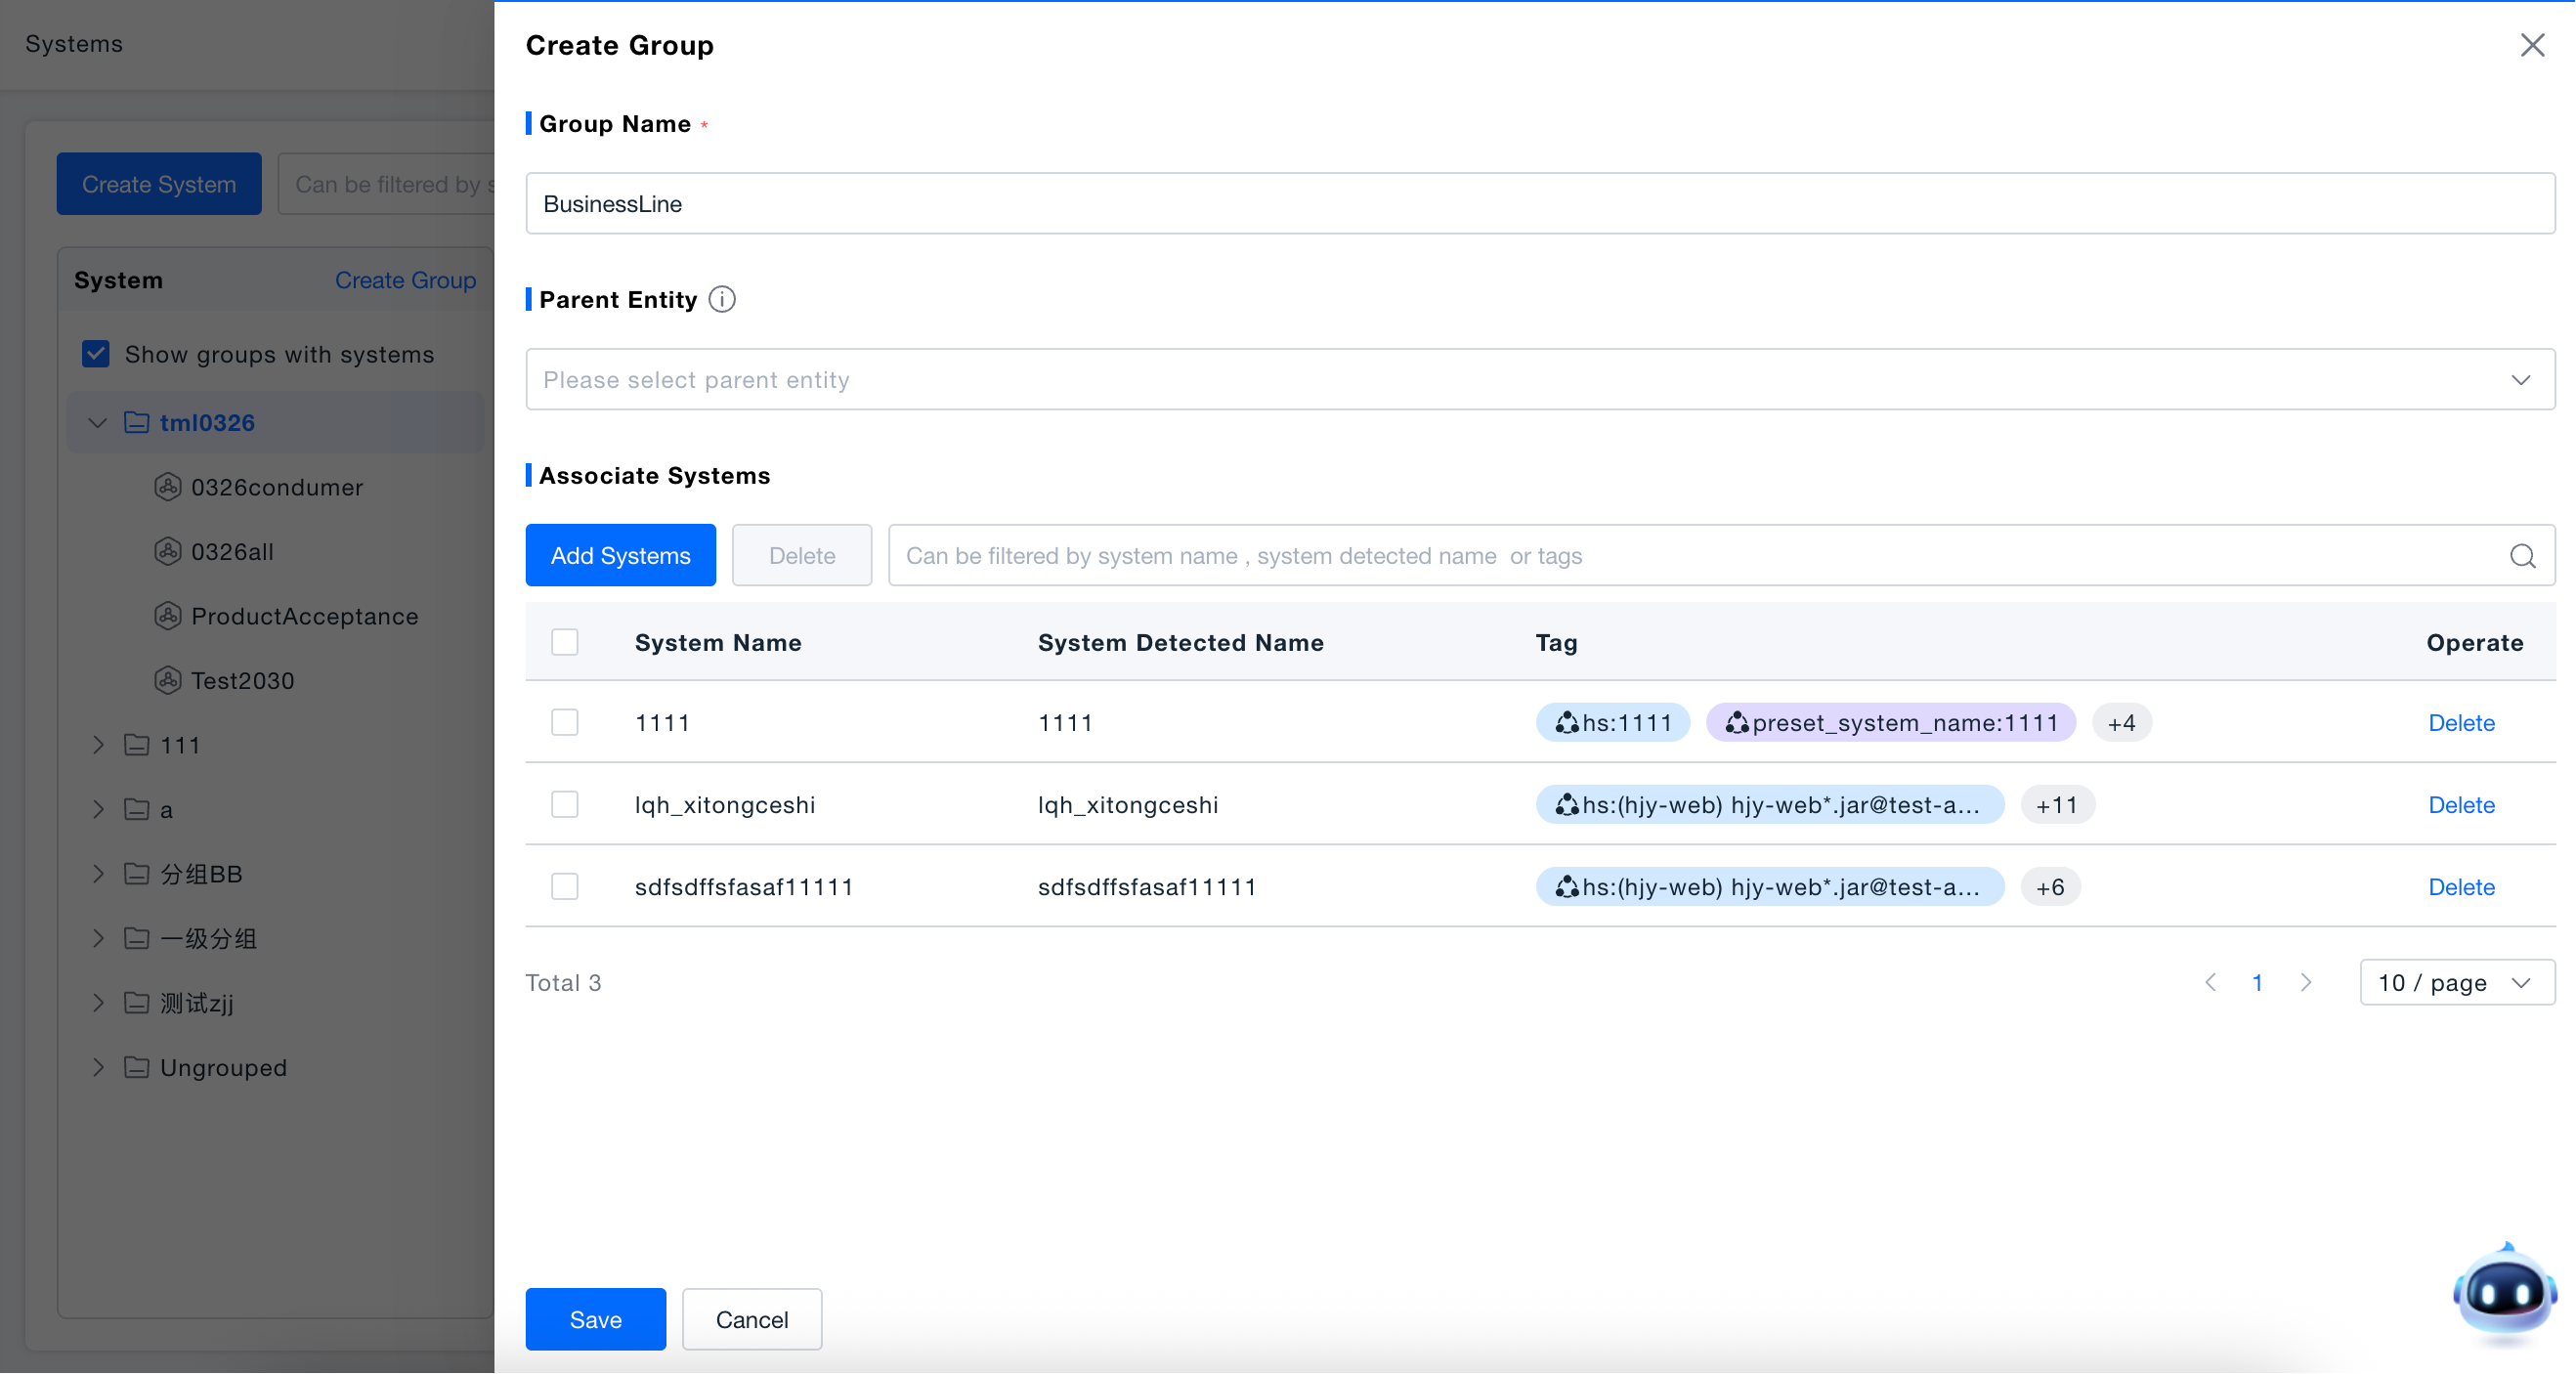
Creating Groups
- Click "Create Group" or select "Add Subgroup" on an existing group, enter the group name (required, maximum 20 characters).
- Optionally set the parent group, if not selected, the new group will be at the root directory; optionally associate parent systems not belonging to any group.
- Click "Save" to complete creation.
Groups support nesting, up to three levels. You can adjust the group order or move groups to other groups by dragging. Parent systems support cross-group dragging, and subsystems move with parent systems. When deleting a group, systems under the group will automatically move to "Ungrouped".
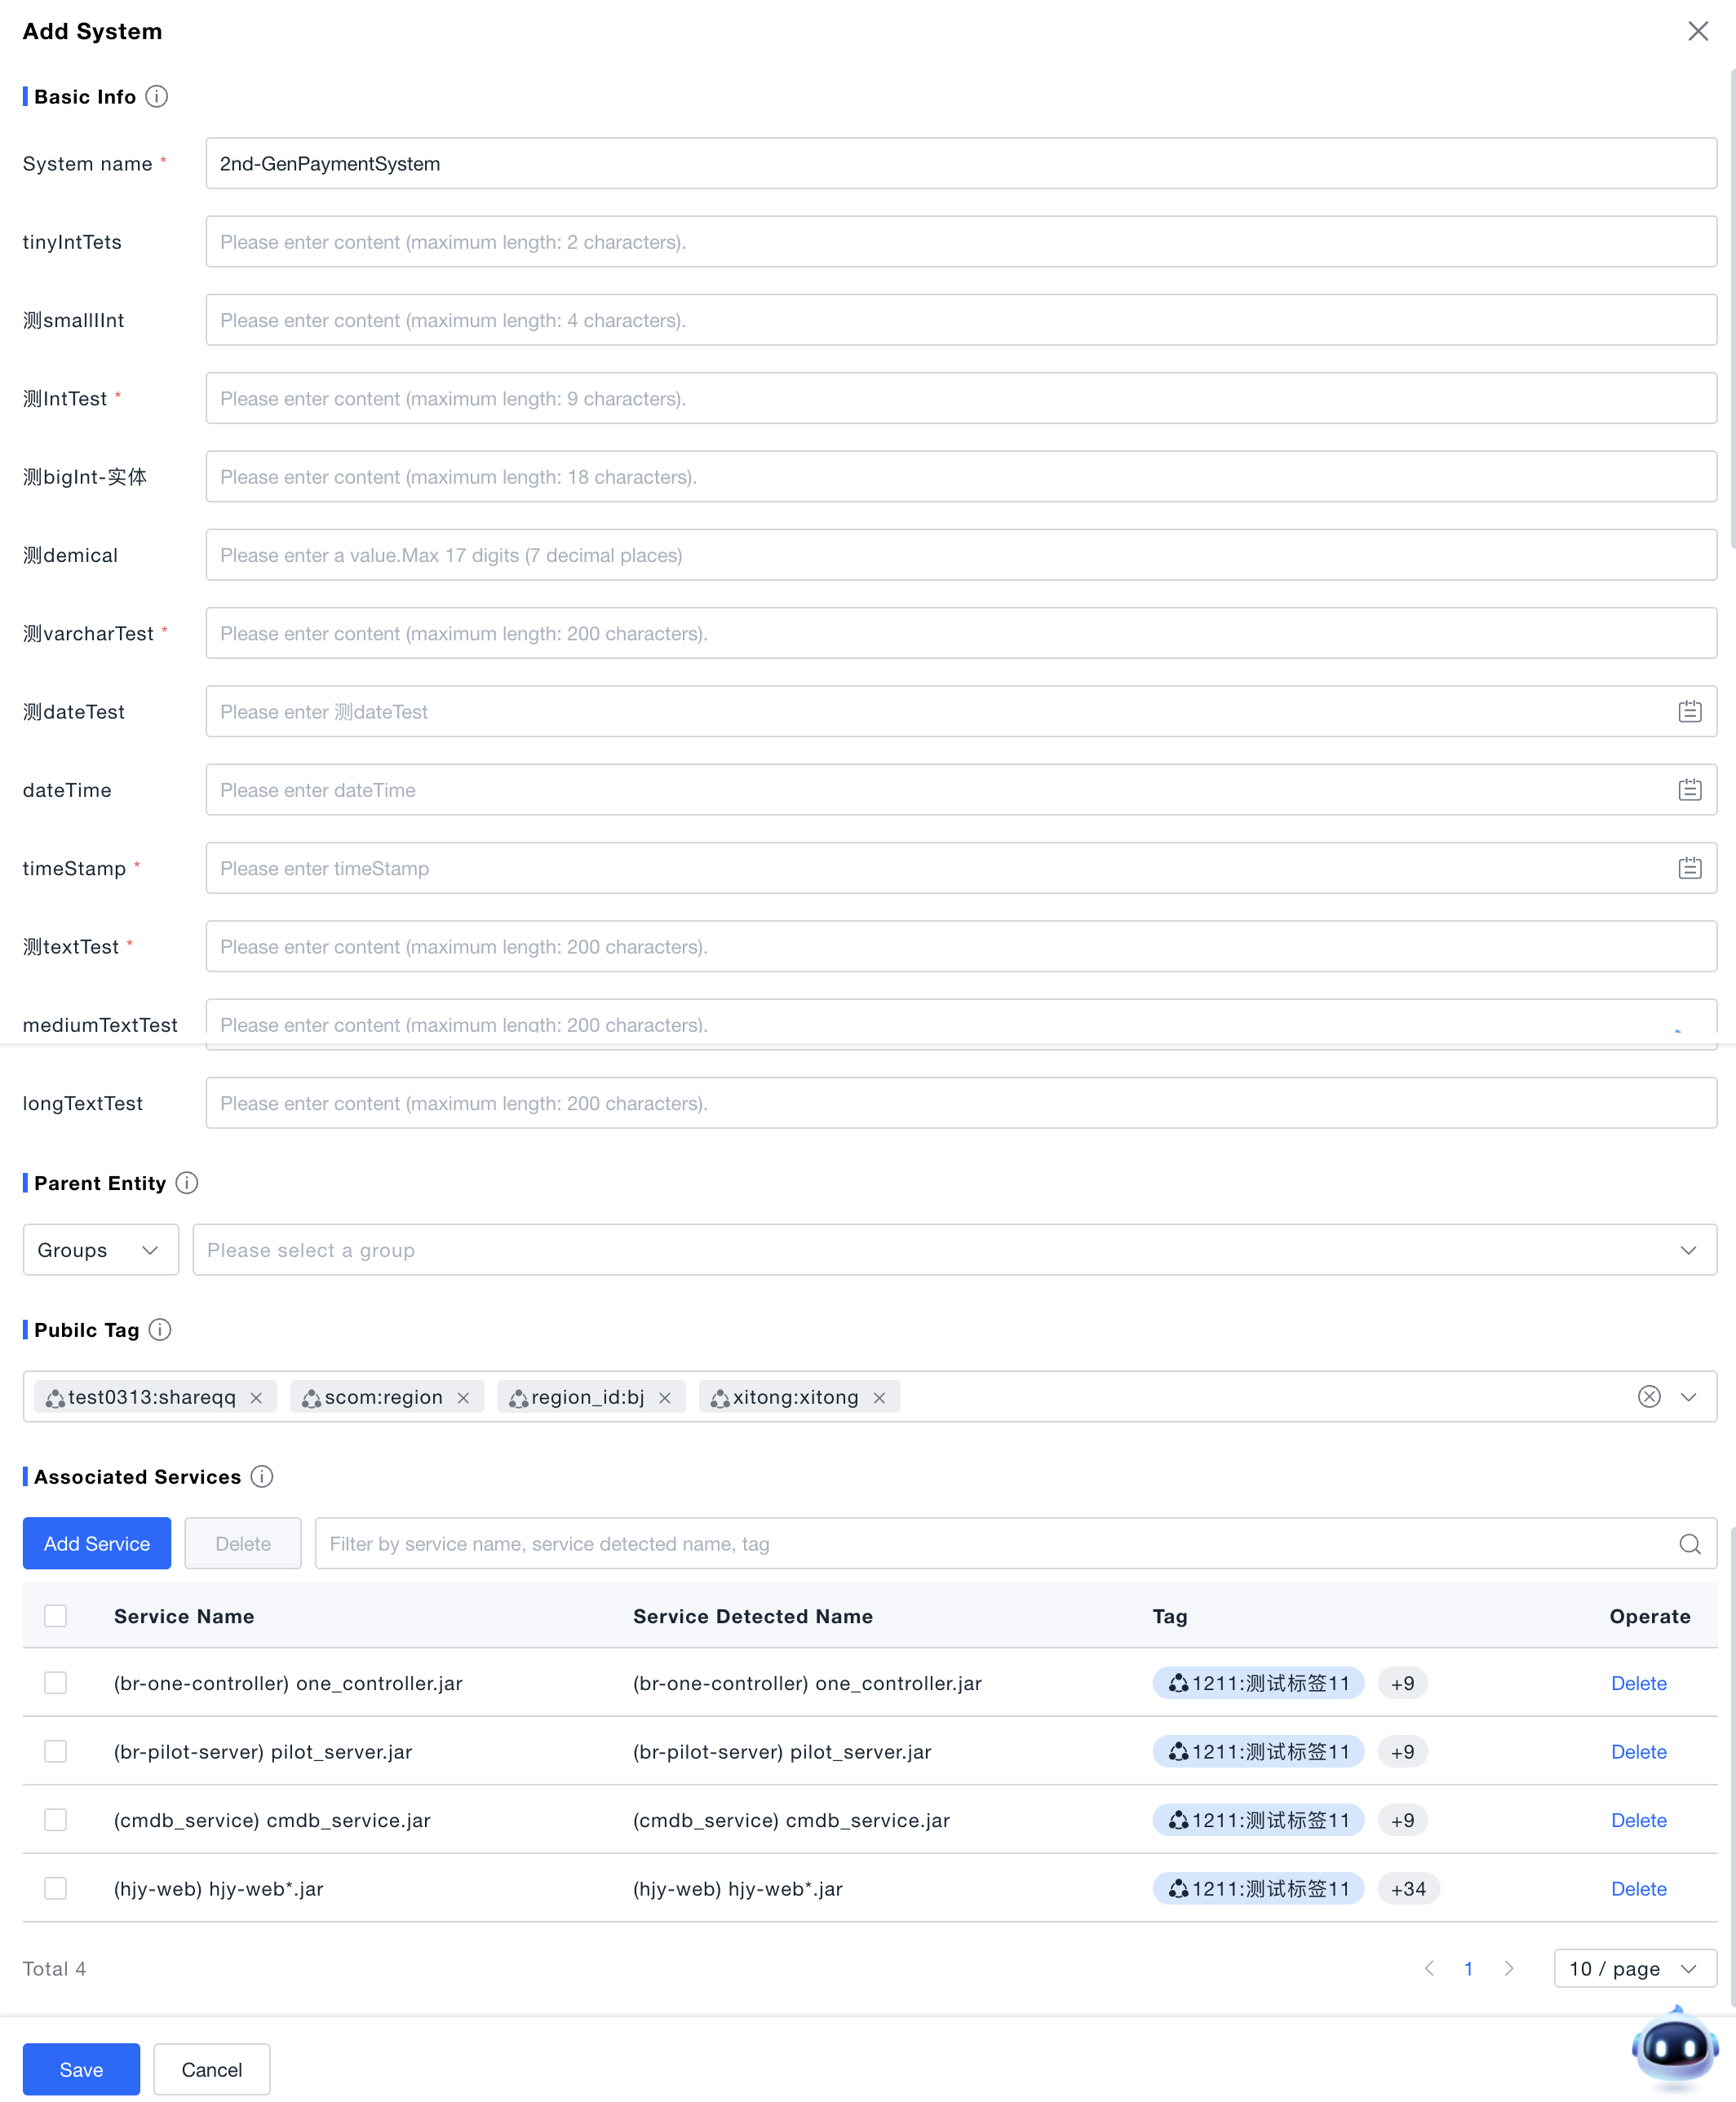
Creating Systems
When new users first visit the systems page, they can directly create a new system according to the page guidance; users who have already created systems can click the "Create System" button to open the creation page.
-
System Name: Enter the system name (required). The system identification name is defaulted to the system name filled in during first creation. When the system name is modified later, the system identification name will no longer change.
-
System Properties: System property fields are consistent with the CMDB model, and fields support multiple data types.
-
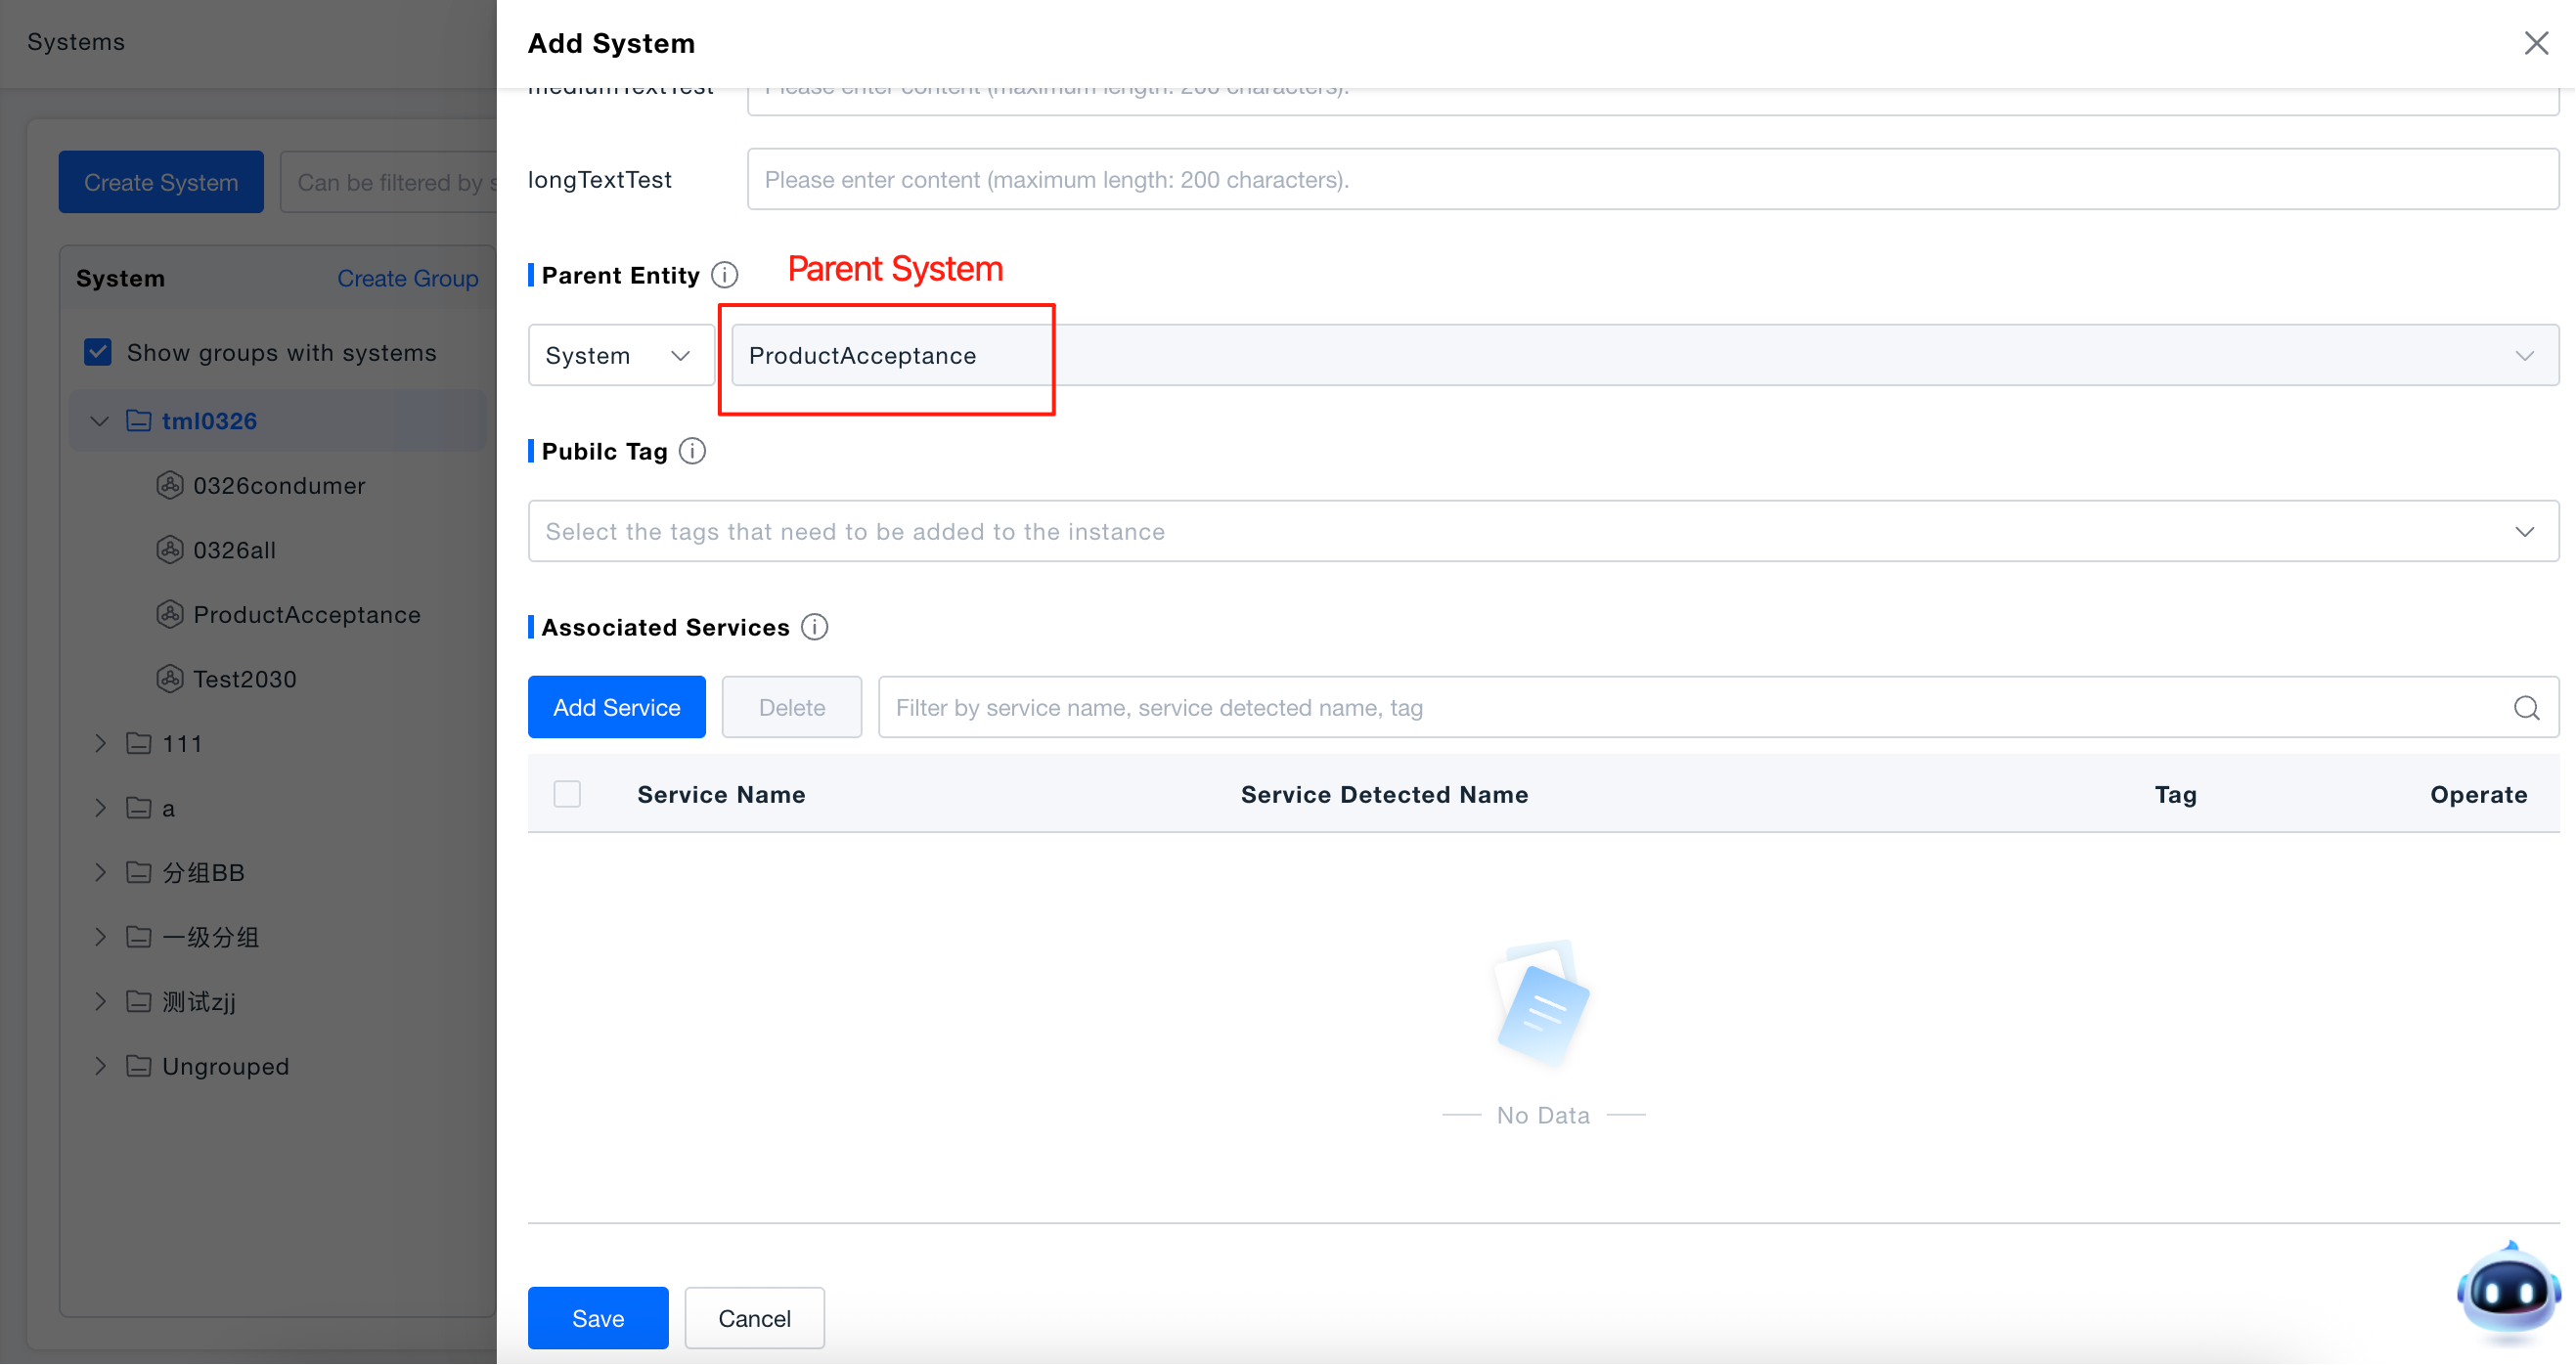
Set Parent: If it is an independent system, select a group as the parent; if it is a subsystem, select its parent system. Systems and groups cannot be at the same level, and systems only support selecting leaf nodes of groups.
-
Optionally add shared tags. First, to tag the current system, and second, shared tags are related to data permissions (resource domains).
-
Select the services directly included in the system in "Associated Services", click "Save" to complete creation.
- To ensure the correct association between shared tags and data permissions, it is recommended that you select the corresponding shared tags under the resource domain when creating the system, so that the system can be viewed in the corresponding resource domain immediately after creation.
- Systems that have not selected shared tags or whose selected shared tags are inconsistent with the data scope of the current resource domain can only be viewed under the Default resource domain.
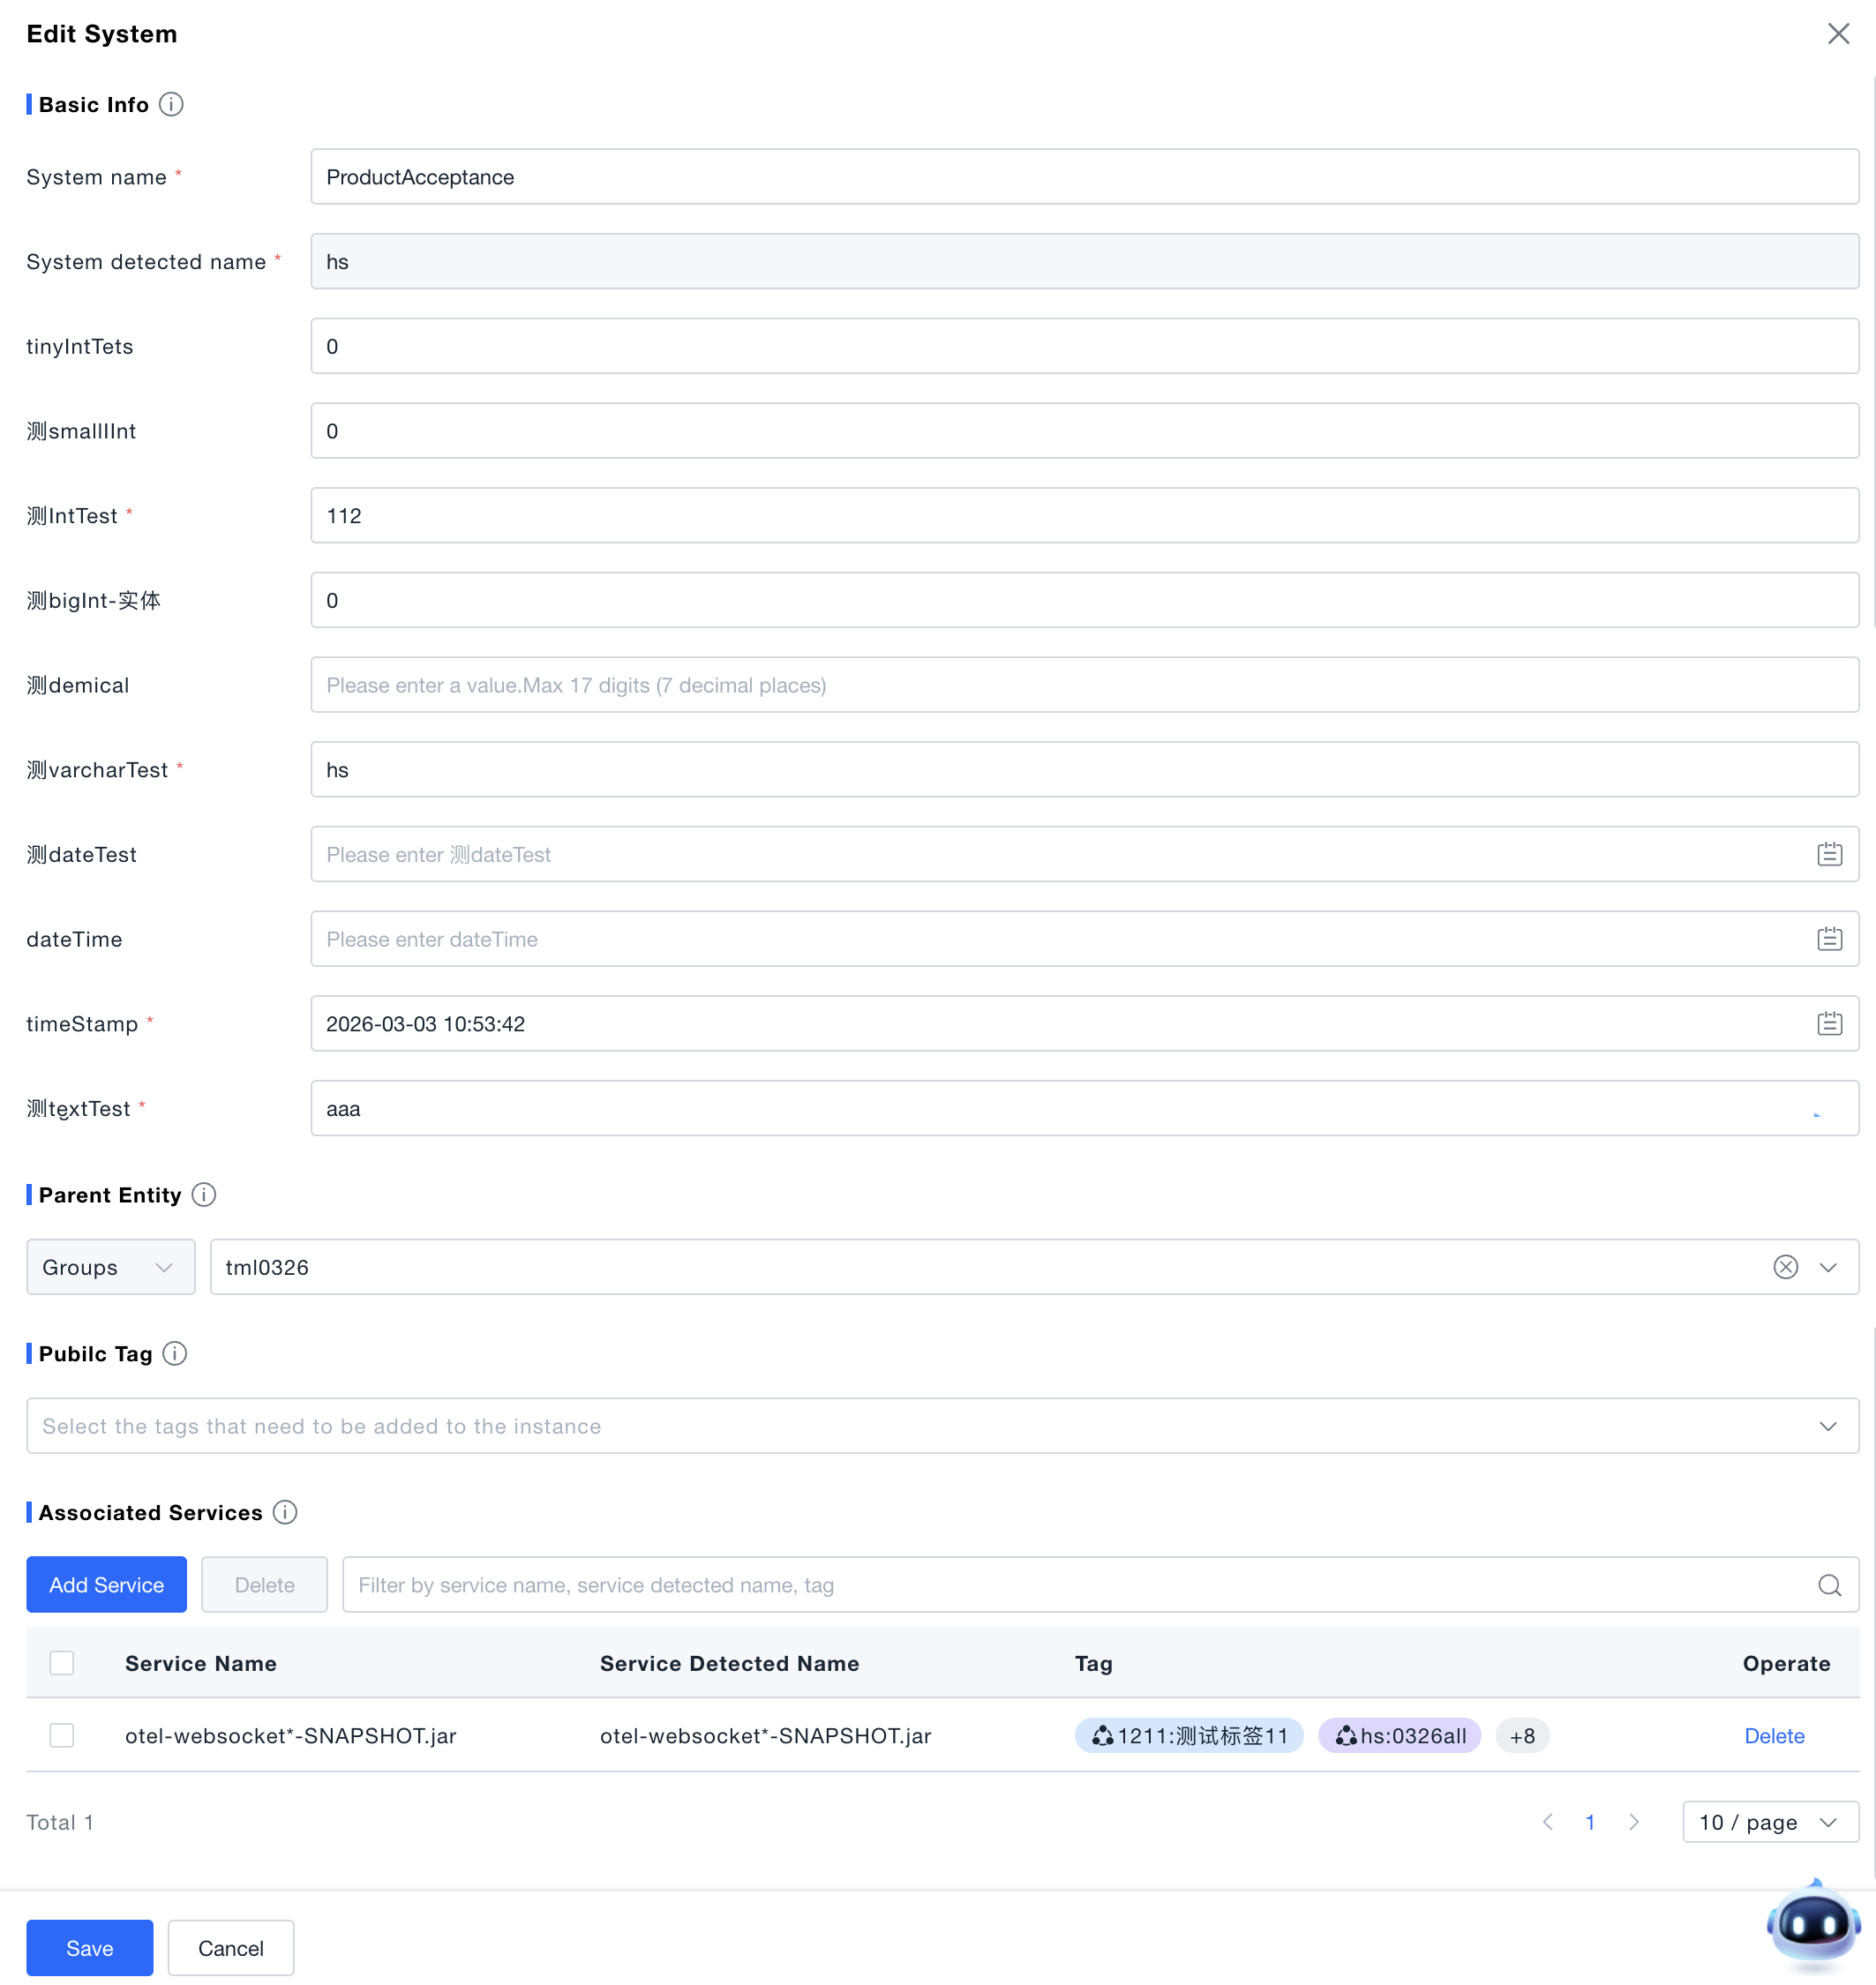
Managing Systems
After system creation, you can manage the created systems on the System Health Wall page:
-
Management Entry: Hover the mouse over the target system card, click the "⋮" (more operations) button in the upper right corner of the card to open the management menu.

-
Edit System: Click "Edit" on the system card to modify the system name, property fields, shared tags, and associated services. The parent system cannot be changed. Associated services cannot select services of subsystems.
-
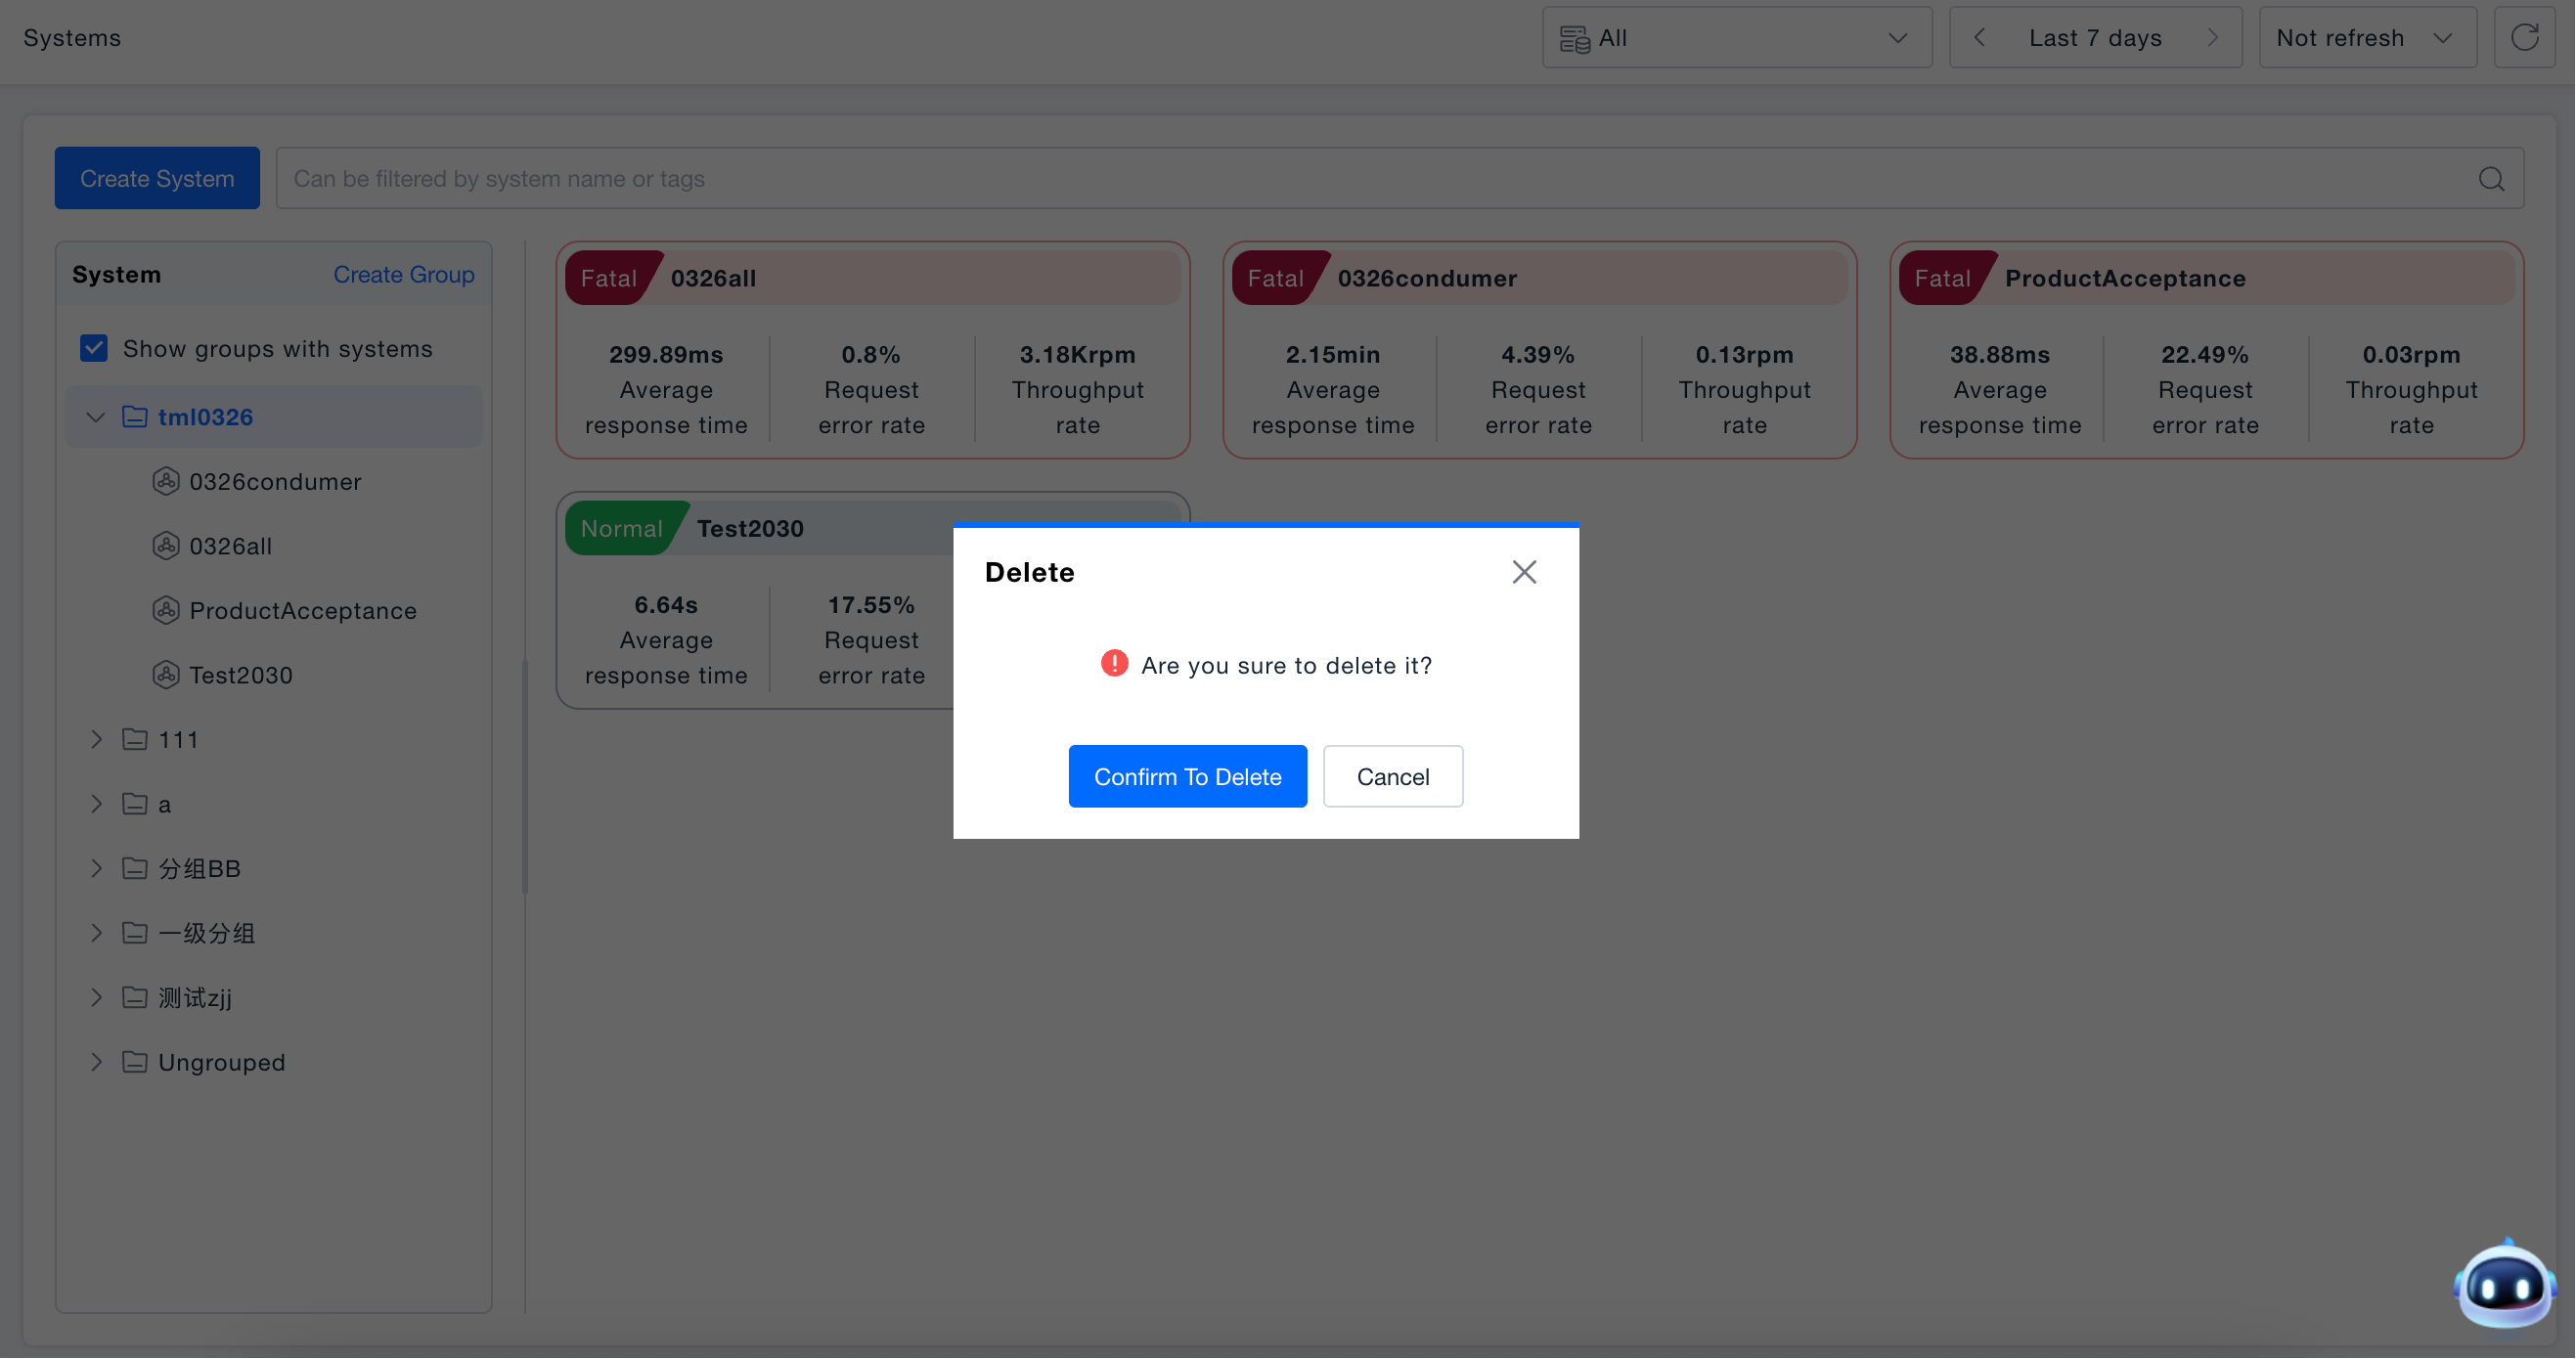
Delete System: The delete operation will simultaneously delete all content under the system (including subsystems), and it cannot be undone, so please operate with caution.
-
Add Subsystem: Only parent systems support adding subsystems, and subsystems cannot nest subsystems (systems support up to two levels).
System Details Page
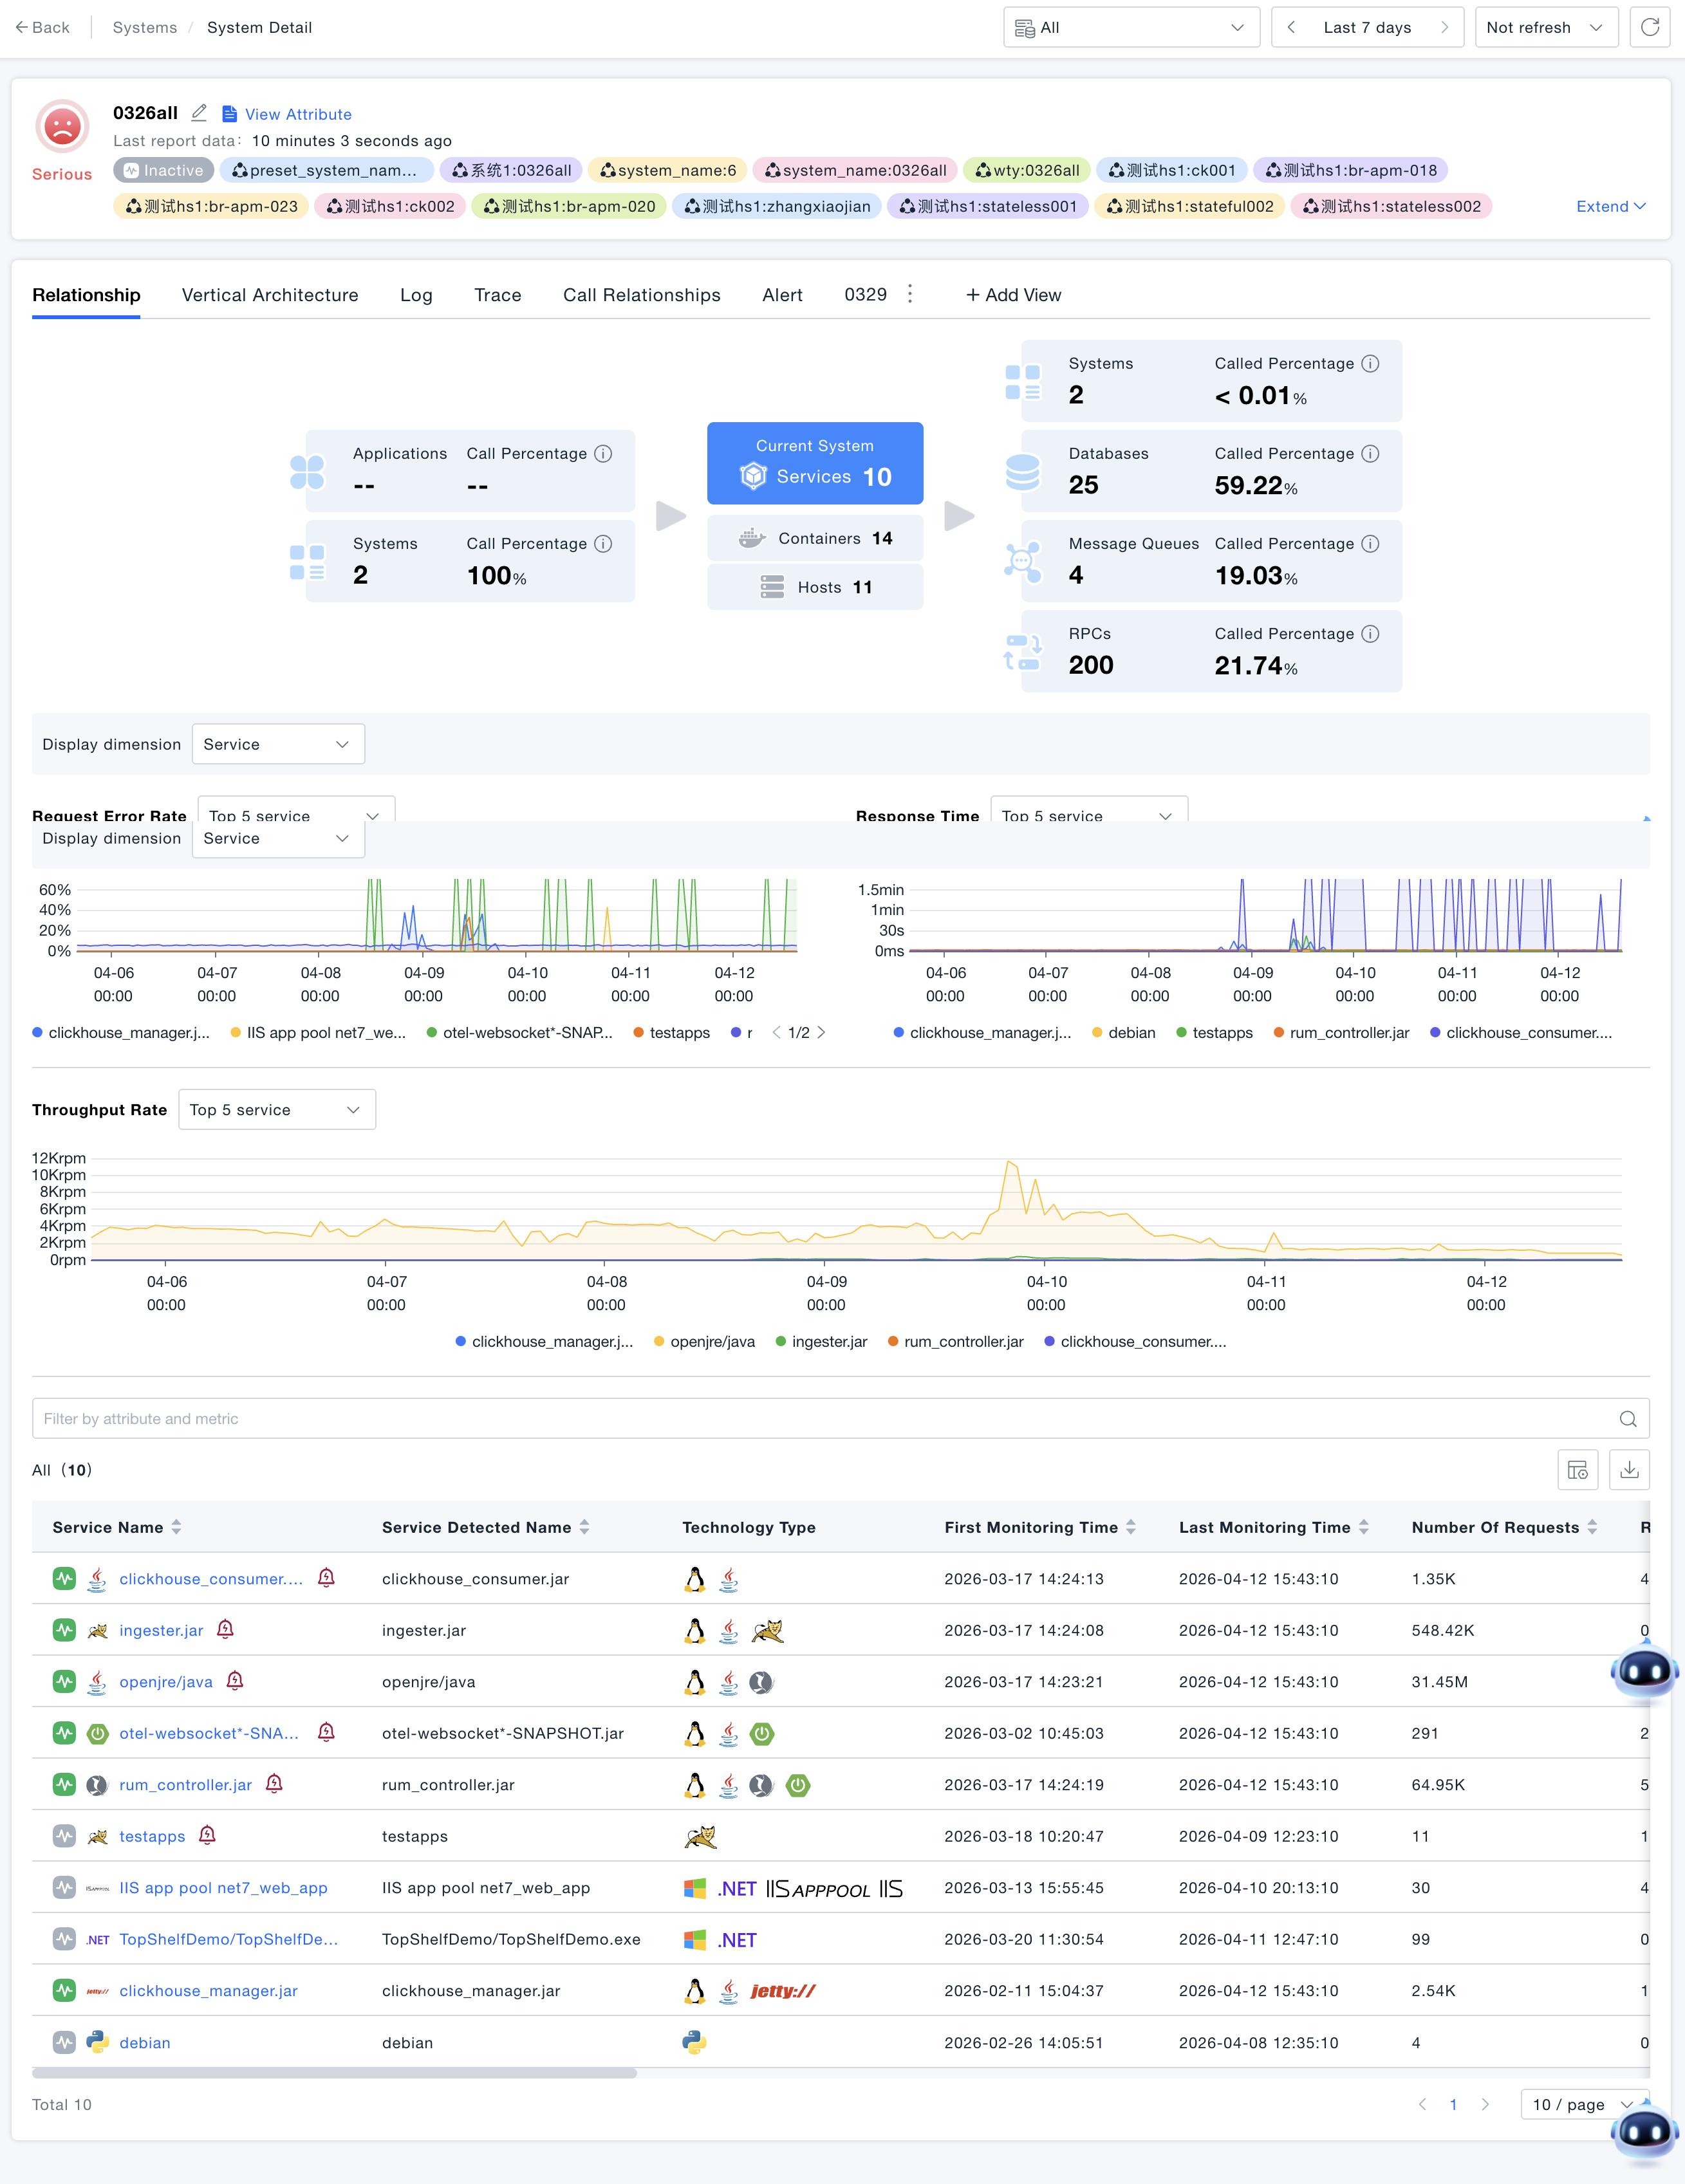
Click the system card to enter the system details page. The top displays basic system information, health status, and associated tags, and the bottom provides different dimensional analysis perspectives through multiple Tab pages:
Relationships
Horizontal Relationships
- Horizontal Relationship Diagram: Displays the upstream and downstream call relationships of the current system. You can intuitively understand how many applications and systems call this system, and which databases, message queues, and remote services it calls.
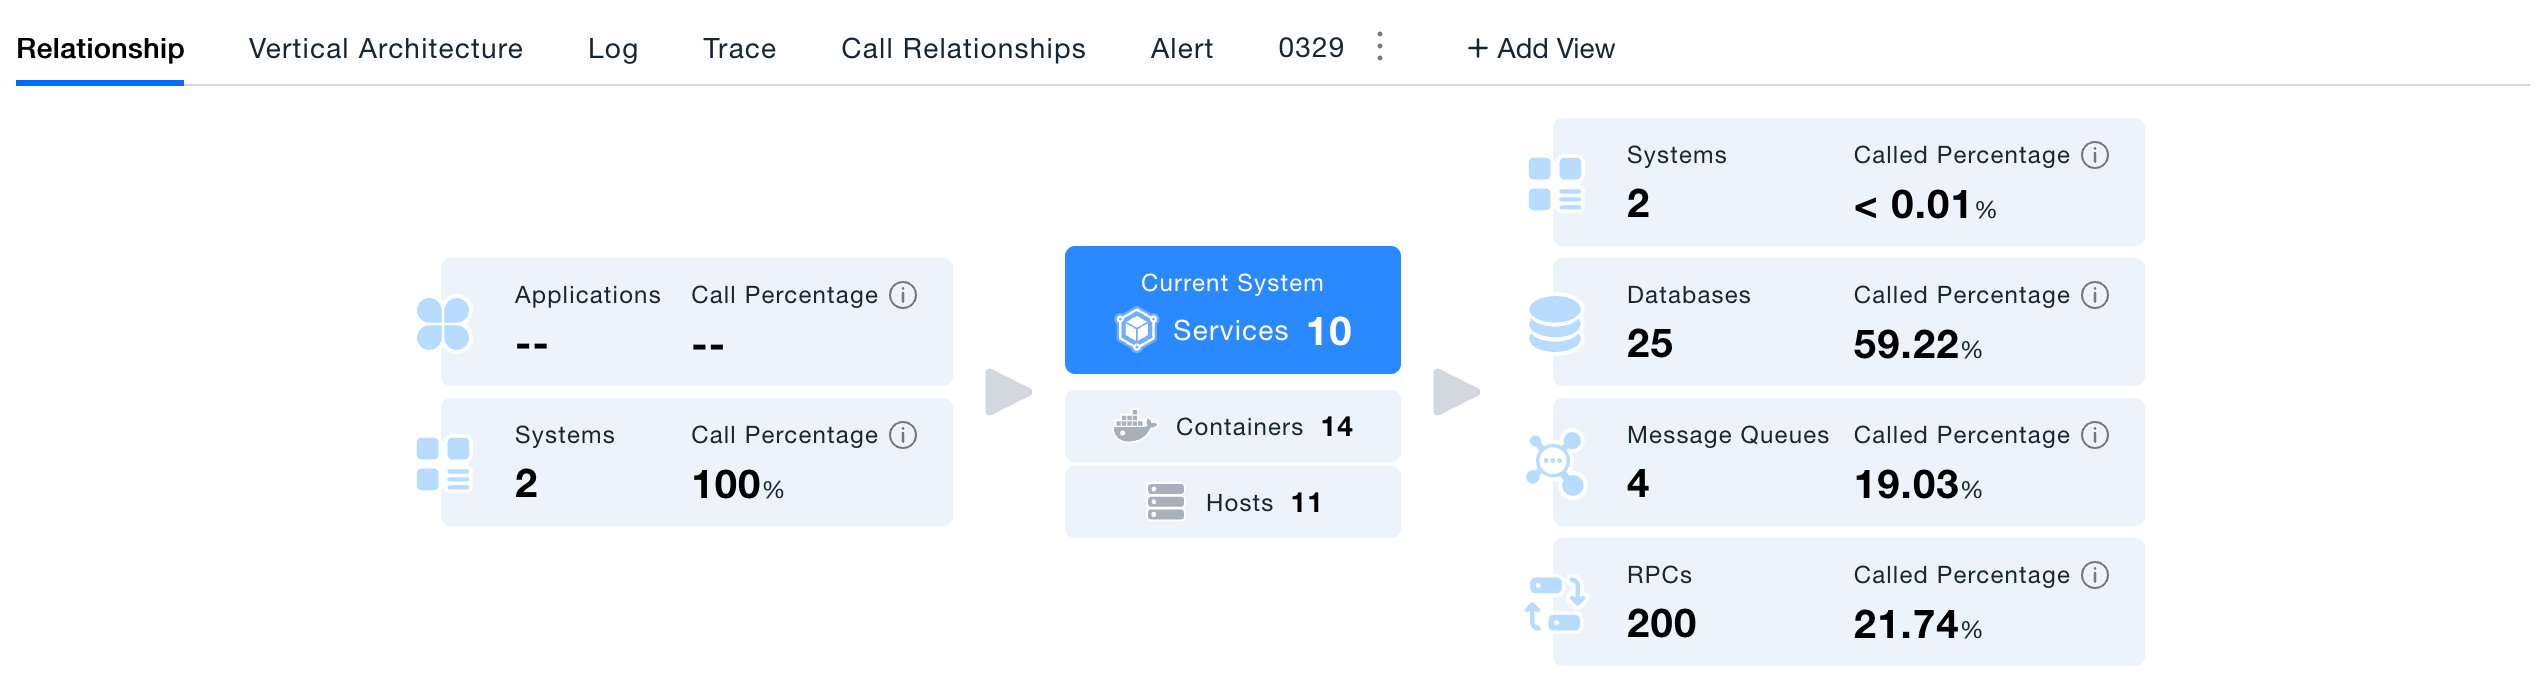
- Click Upstream/Downstream Resources: If you are more concerned about a certain type of upstream/downstream resources, you can click the corresponding card to view resource details or perform call analysis. For example: taking the call relationship diagram shown above as an example, clicking the database card can view information about the 13 databases called by this system.
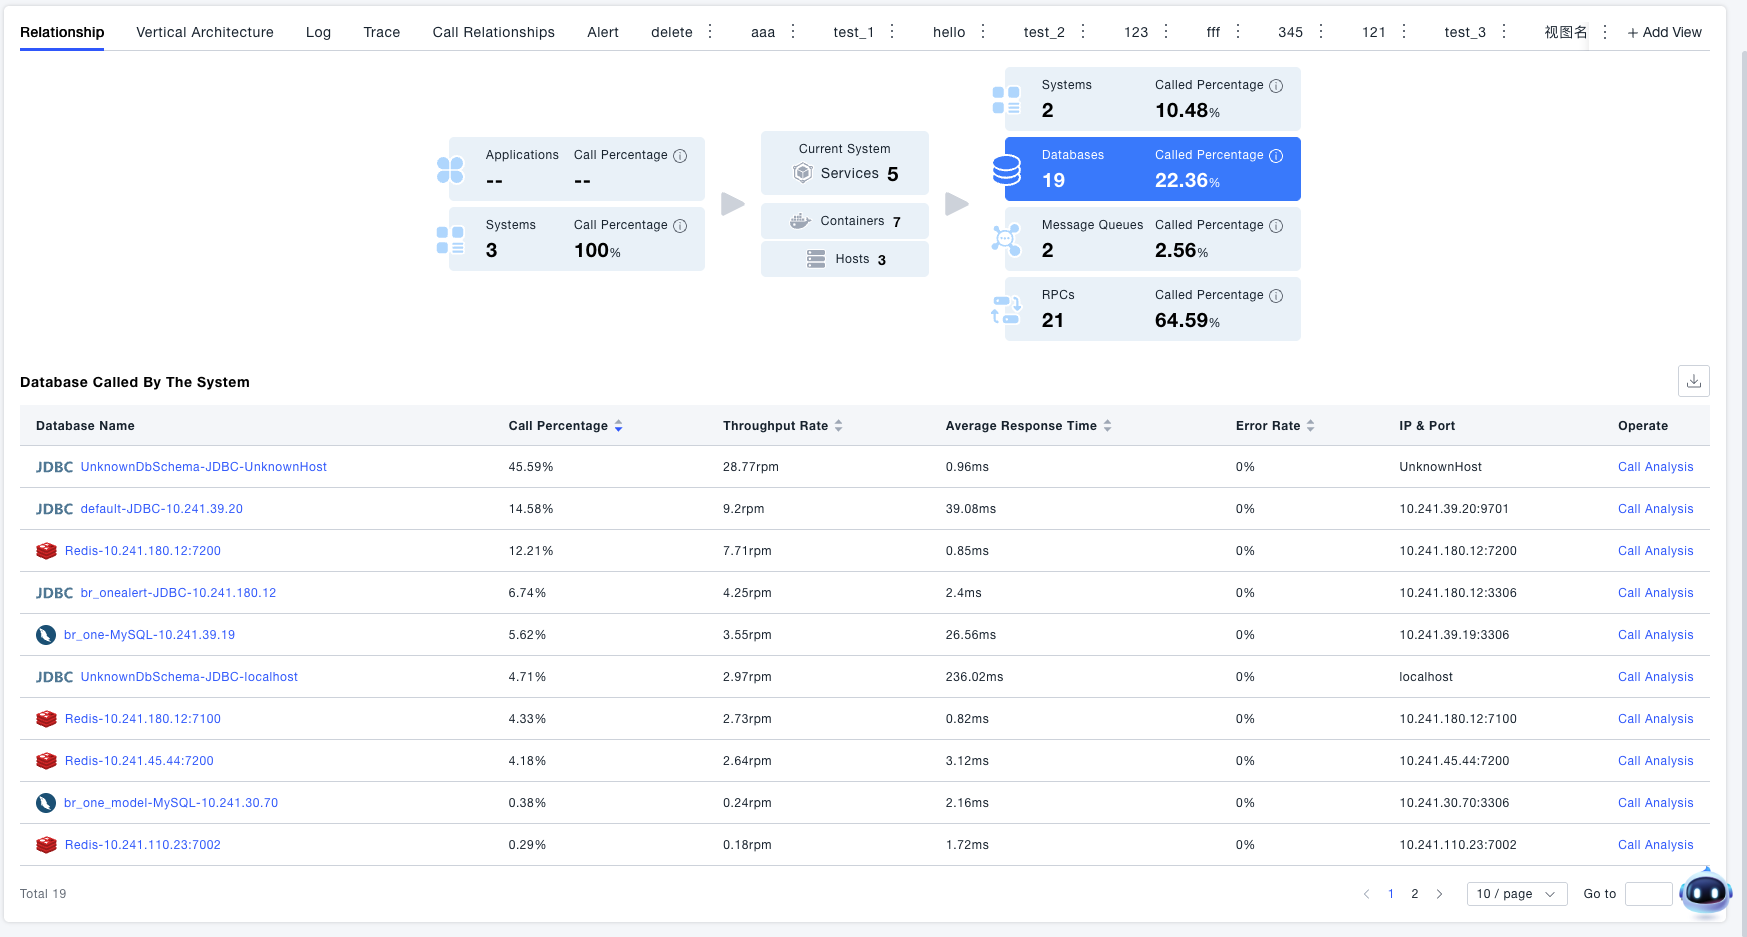
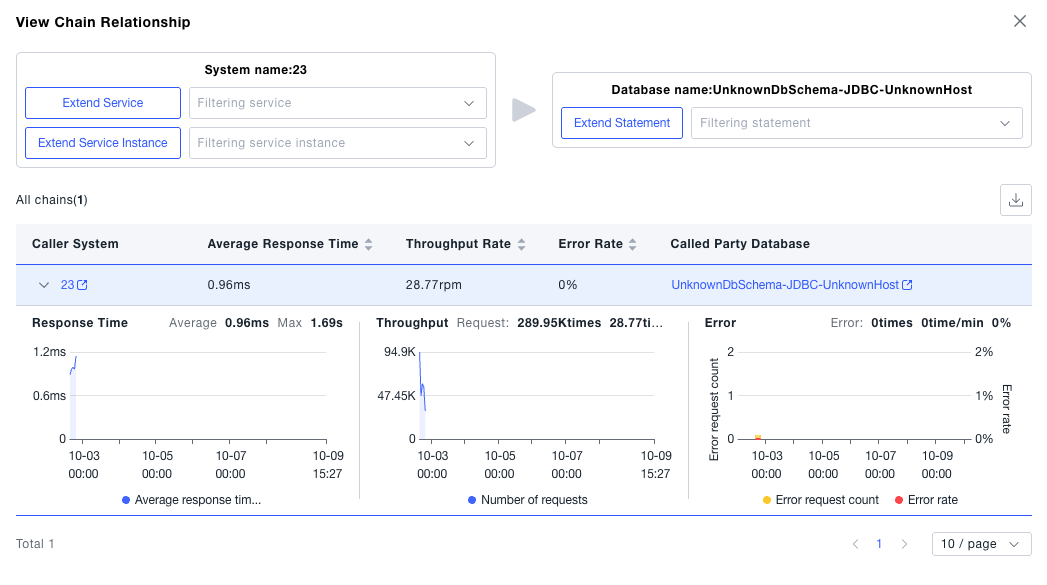
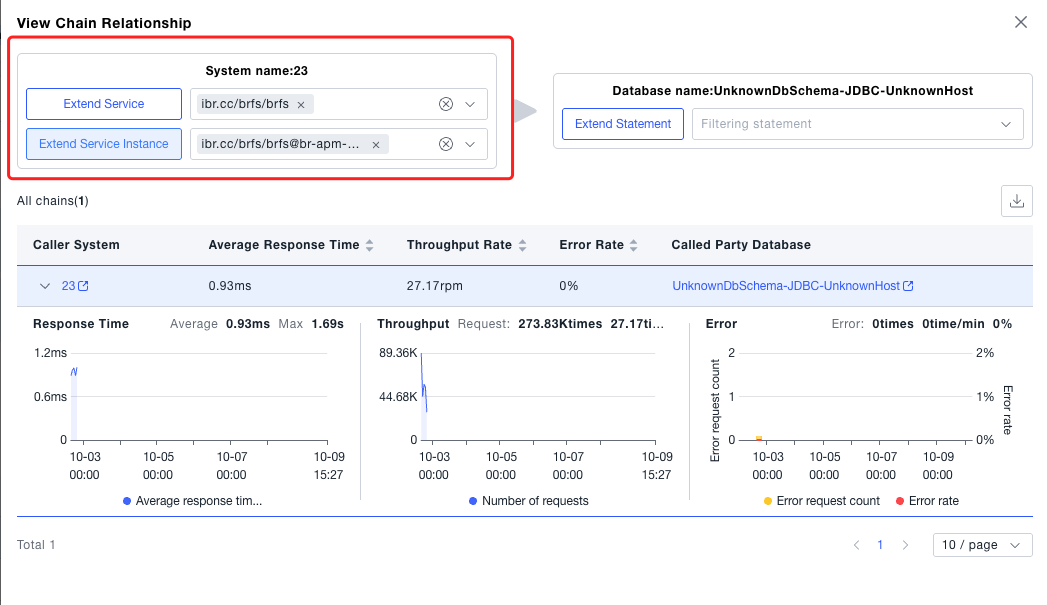
- Call Analysis: Click Call Analysis in the list to analyze the behavior of the system calling a certain database. Call Analysis supports drilling down by services and interfaces under the system to analyze specific call behaviors.
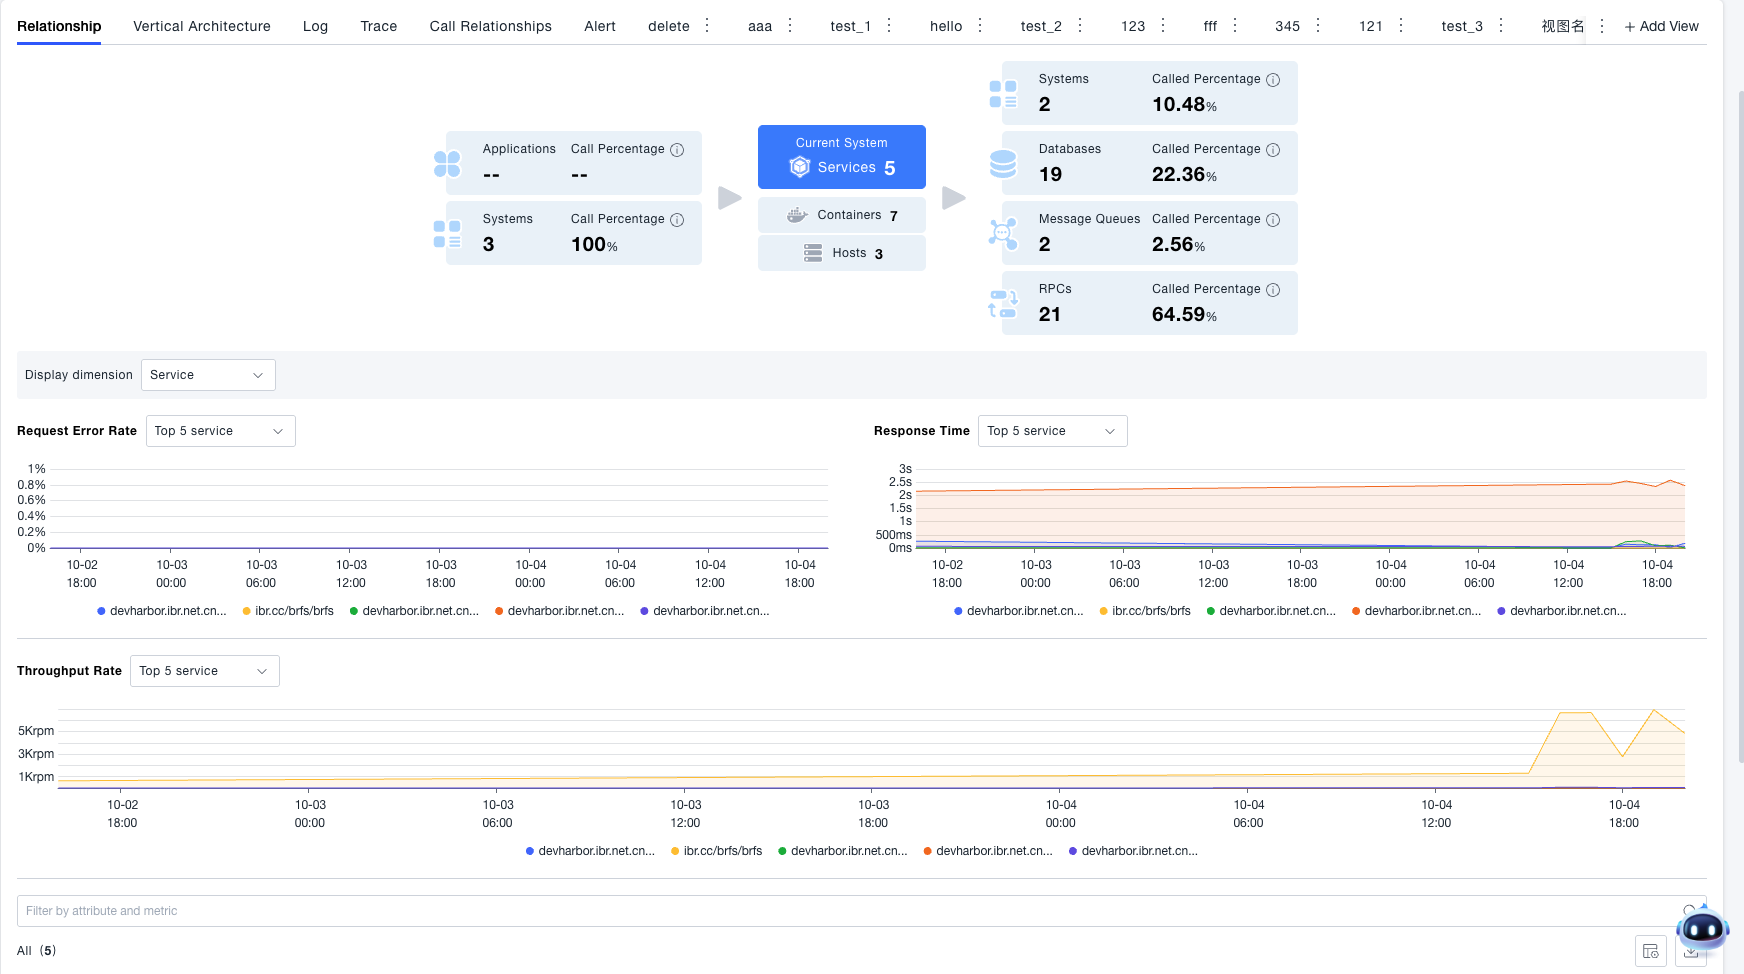
- Statistical Metrics: Click the current system card to view the statistical metrics of the current system. If you find that the current system metrics are abnormal, you can also switch to the service or subsystem dimension included in the system to view the corresponding data, further judging the resource corresponding to the problem root cause.
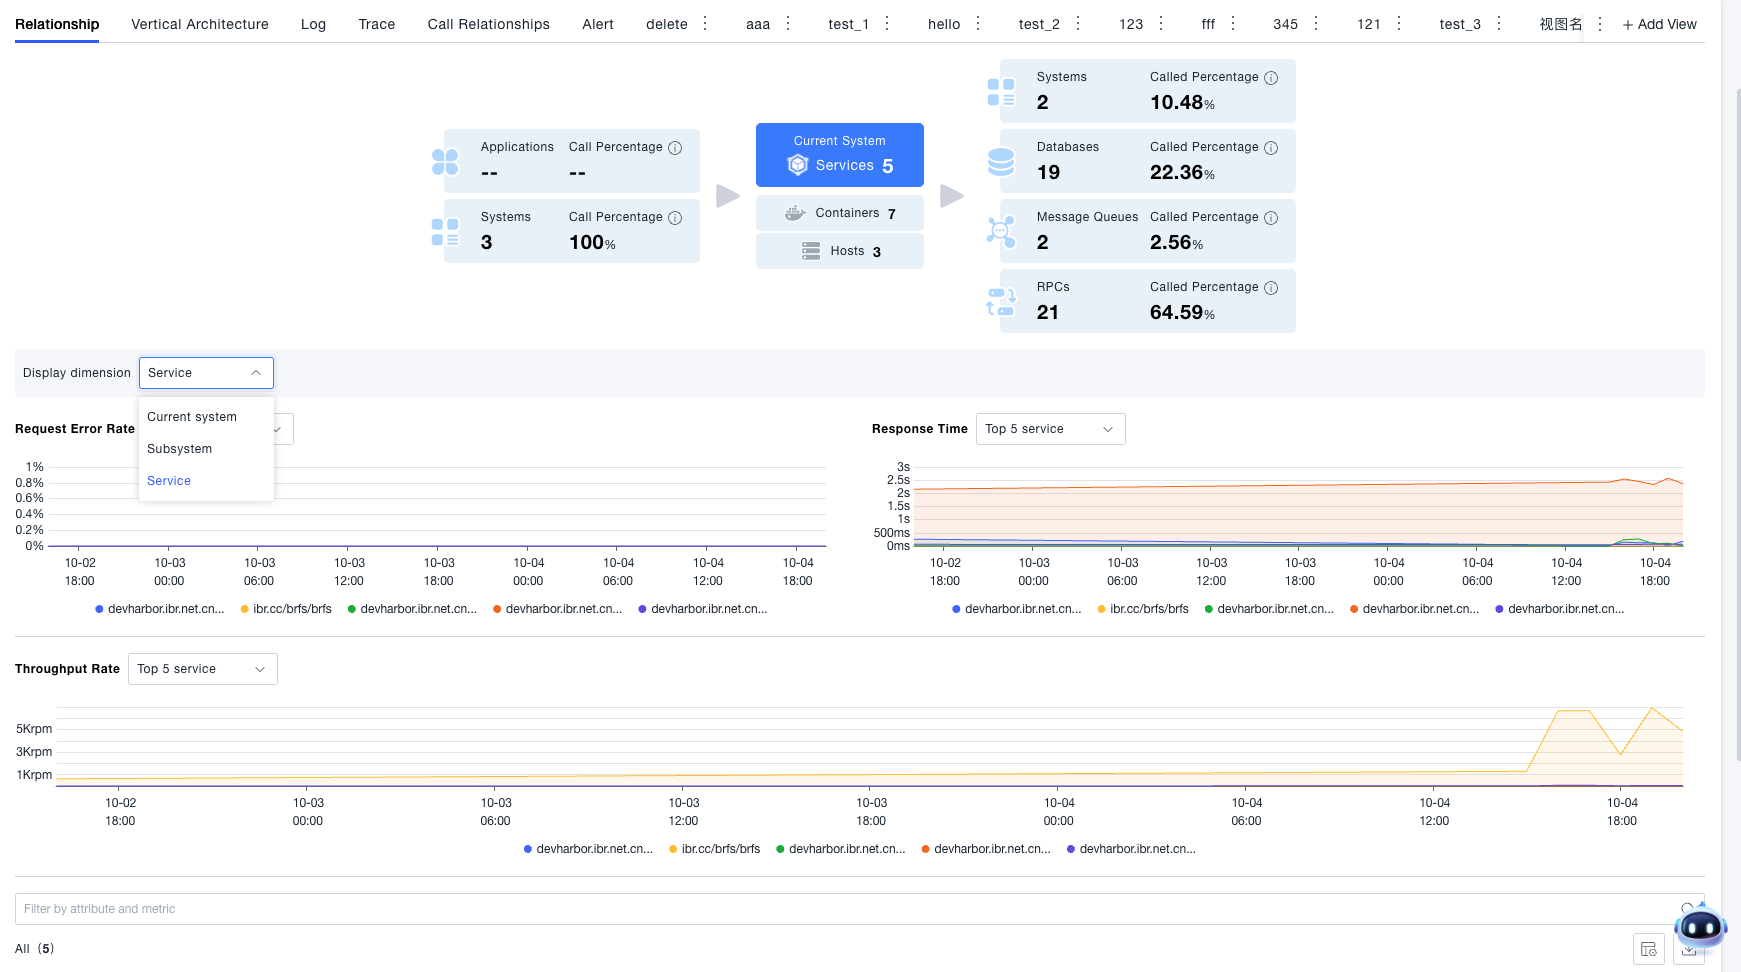
Vertical Relationships
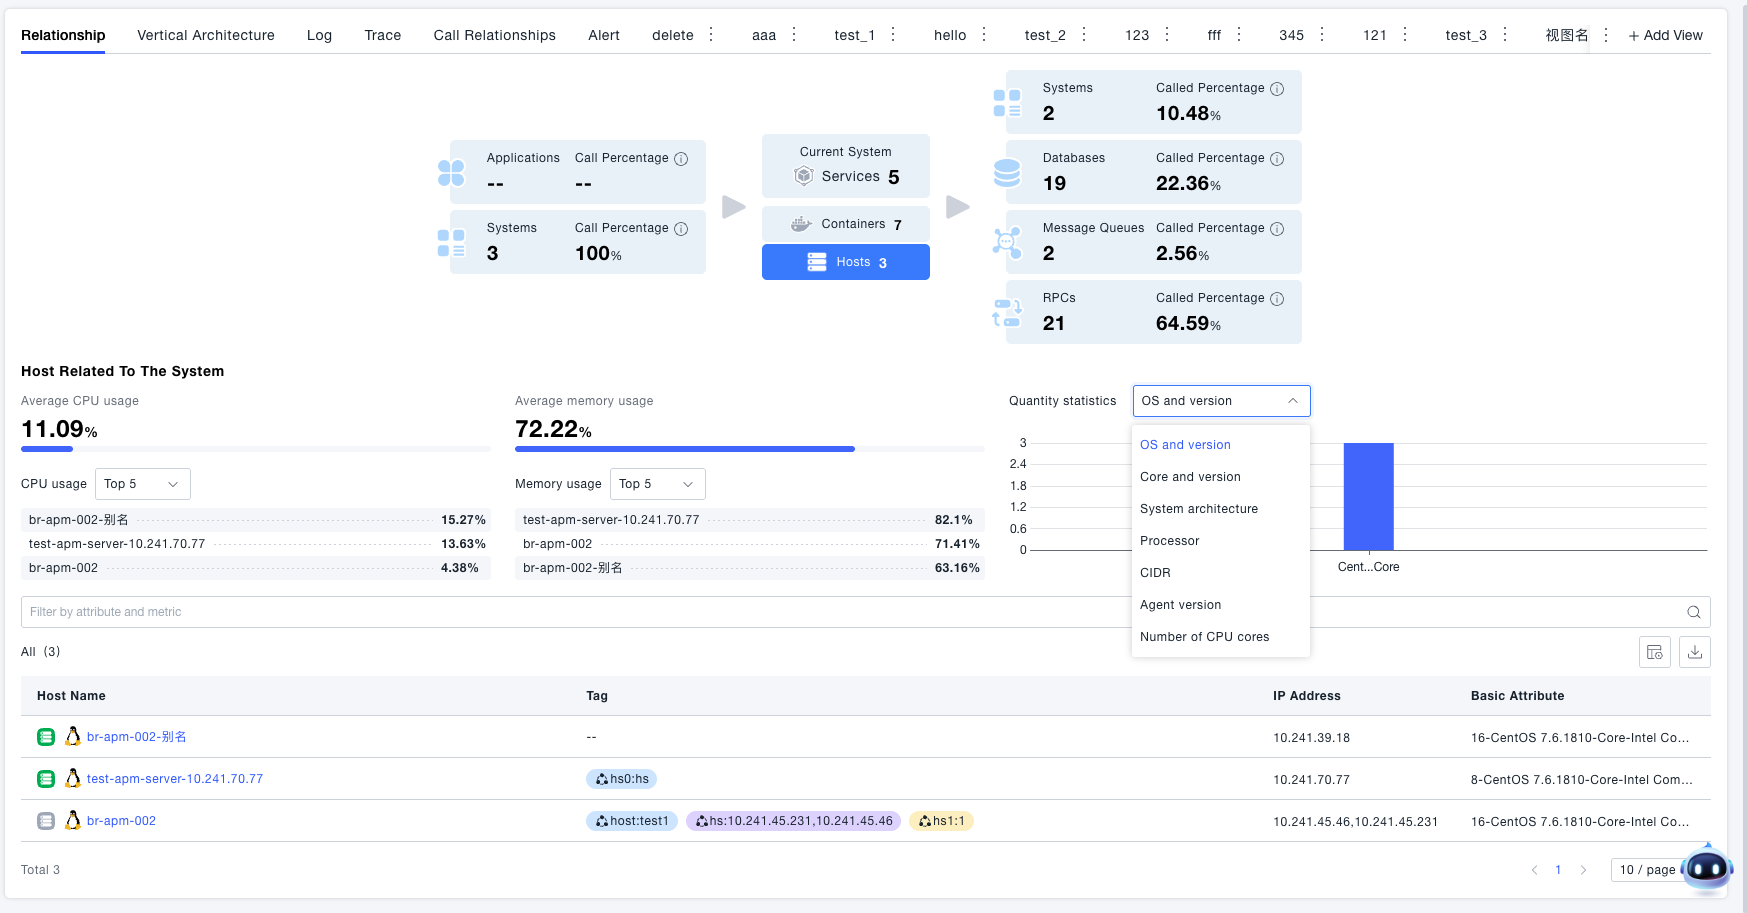
Vertically displays the entity resources associated with the current system, such as services included in the system, containers where the services are located, and hosts where the containers are located. You can click the host and container cards in the system call relationship diagram to view information about the hosts and containers associated with the system. The page also provides statistical functions. If you are concerned about the distribution of resource quantities, you can switch the statistical dimension in the statistical chart to view the quantity distribution of resources.
Vertical Architecture
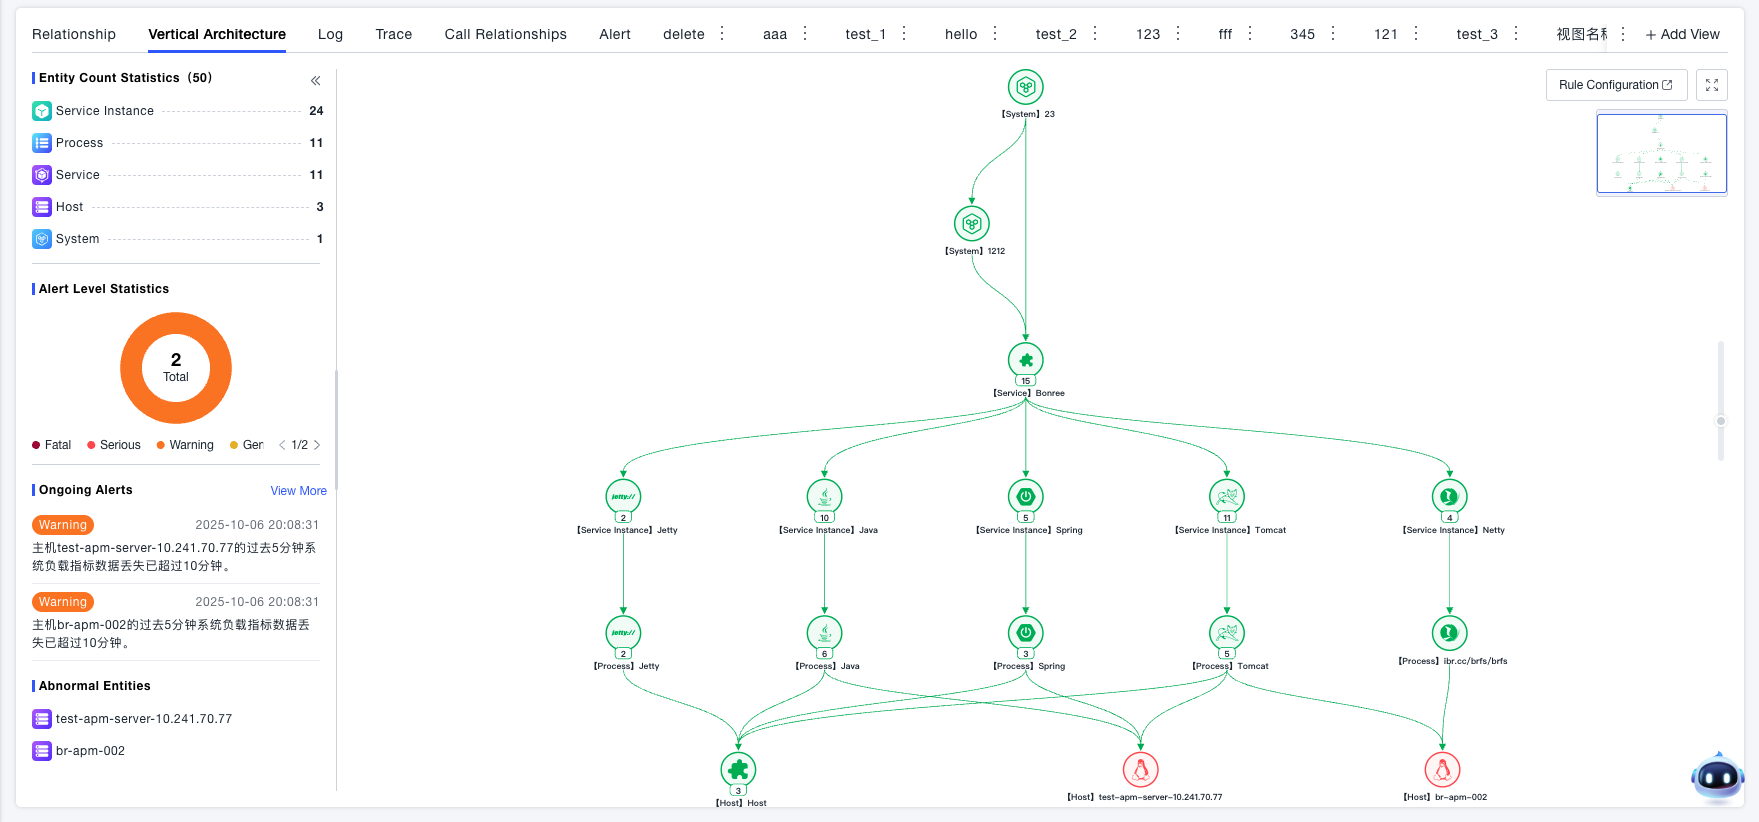
View the vertical architecture topology of the system, which allows for in-depth analysis of system-associated entities, while supporting the combination of alert conditions to locate abnormal entities.
Data Statistics
The left side displays statistics on the number of entities in the system (such as systems, services, service instances, processes, hosts), alert level distribution, and ongoing alert lists and abnormal entities
- Statistics on the number of entities associated with the current vertical architecture by entity type
- Statistics on ongoing alerts associated with the vertical architecture of the current node, you can view specific alert conditions
- Statistics on abnormal entities in the current vertical architecture, click to locate abnormal entities
Topology Analysis
The right side presents the various levels of entity resources (such as services, containers, hosts) associated with the system and their deployment relationships in a topology diagram. You can click on a node to view associated information.
- Intuitively view the vertical hierarchical relationship of the current node, such as: System -> Service -> Service Instance -> Process -> Host, identify abnormal nodes by color
- Click on abnormal nodes to view node details for in-depth analysis
- Analyze metrics, logs, traces, alerts, etc. of abnormal nodes
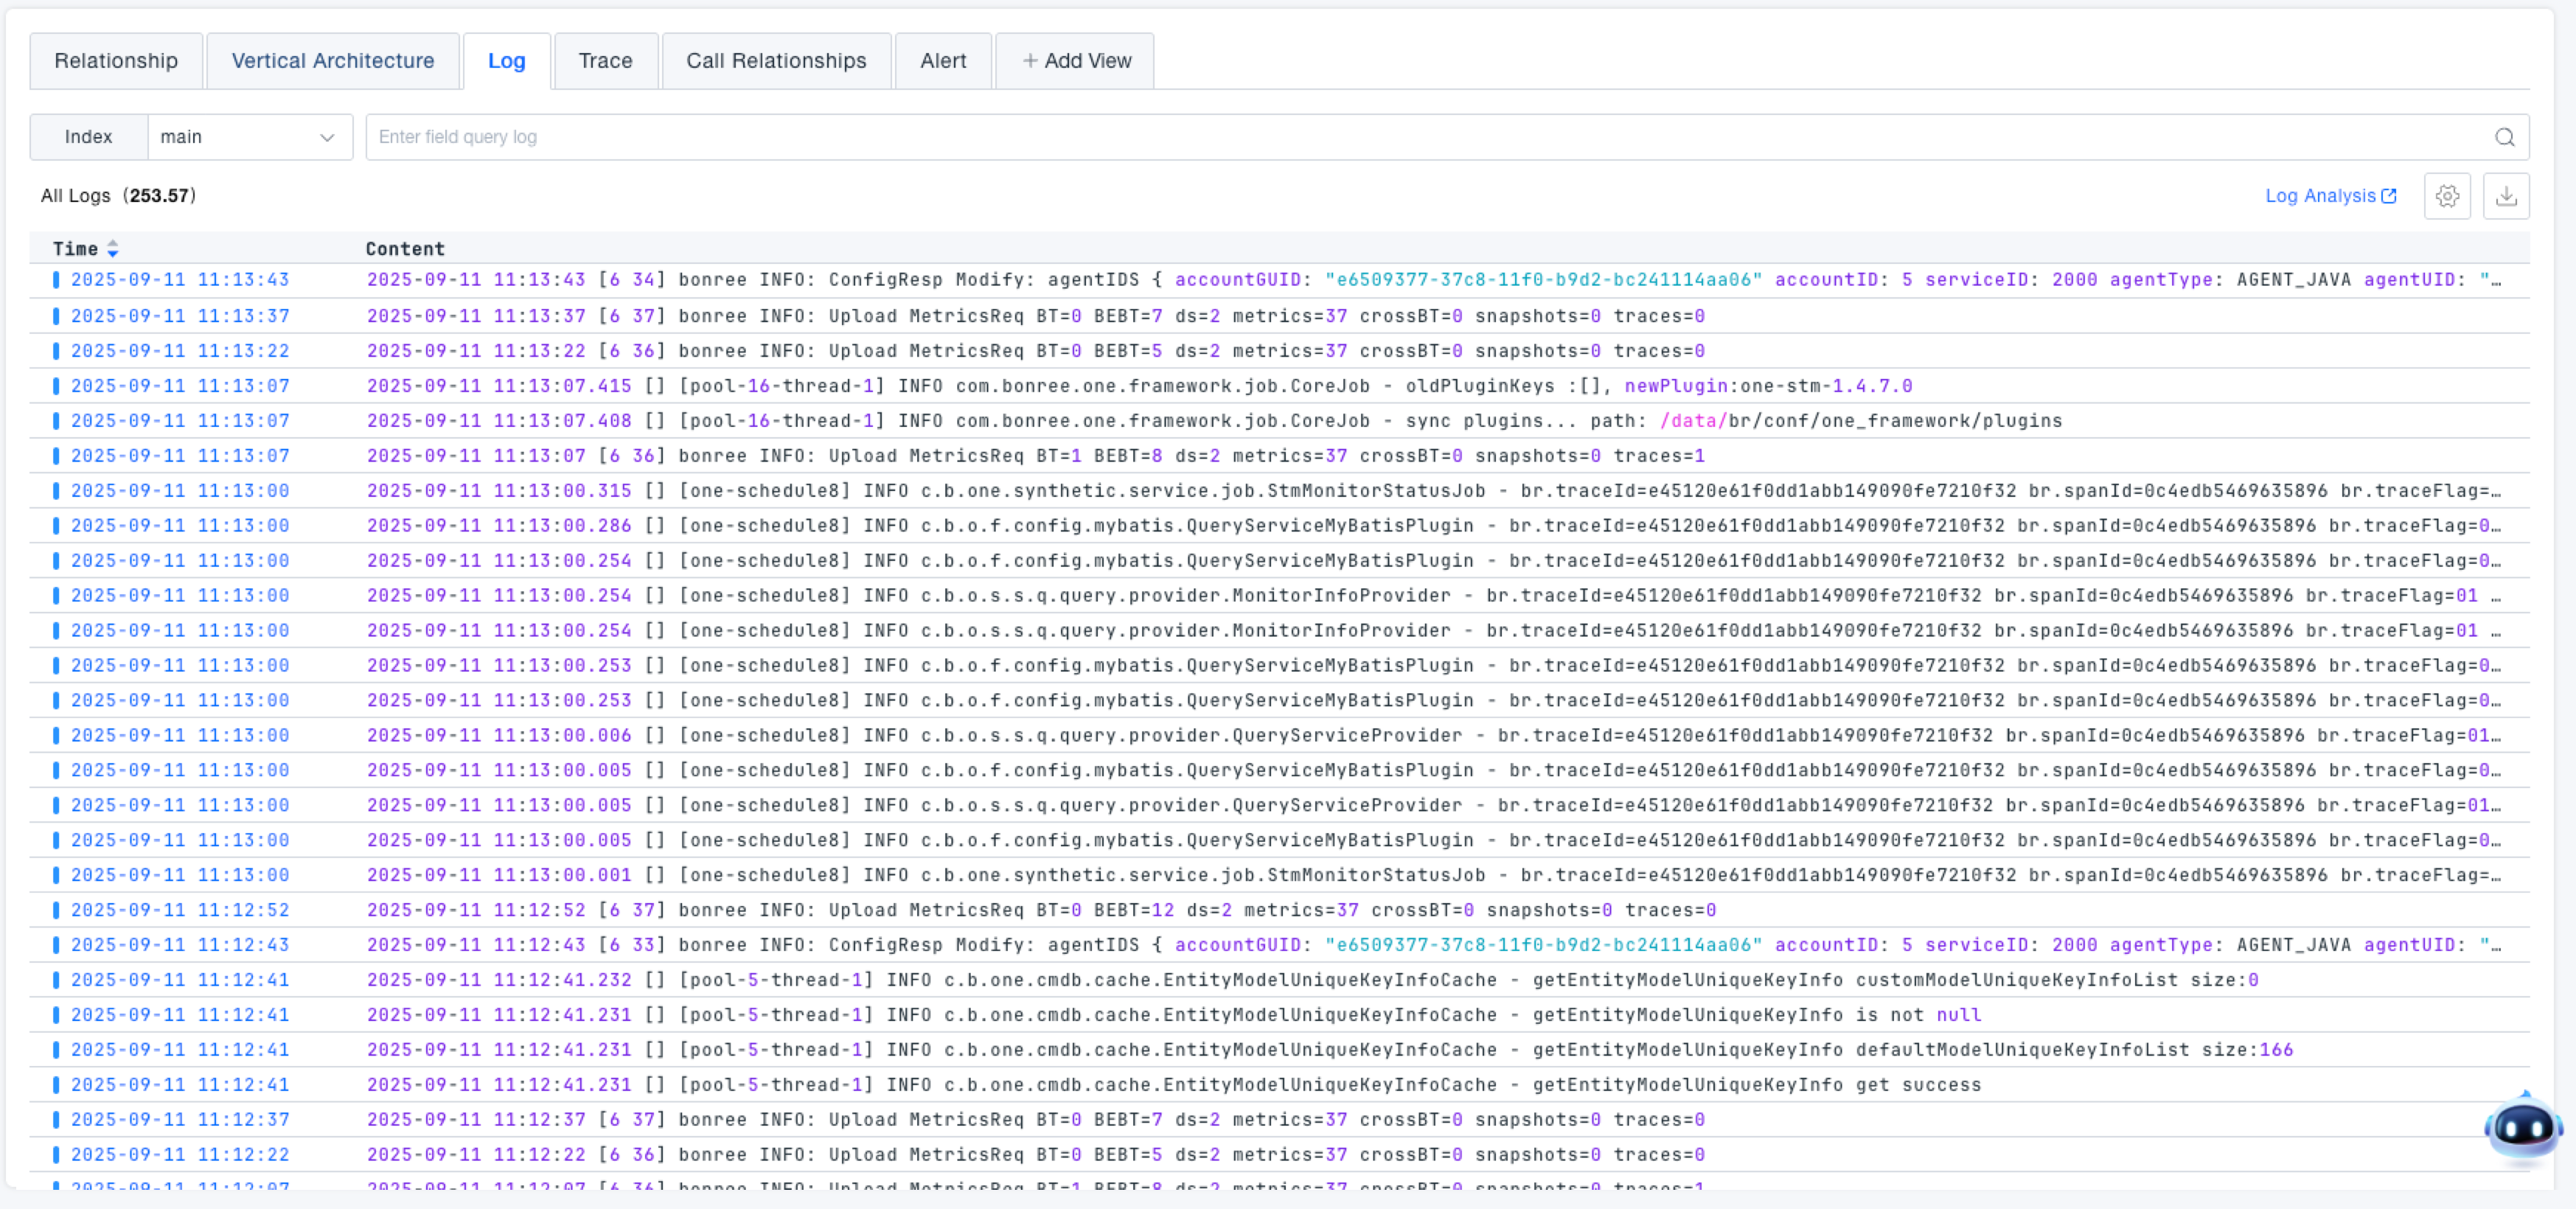
Logs
View the log content of associated services under the current system, supporting index selection, field-based search, and time range filtering.
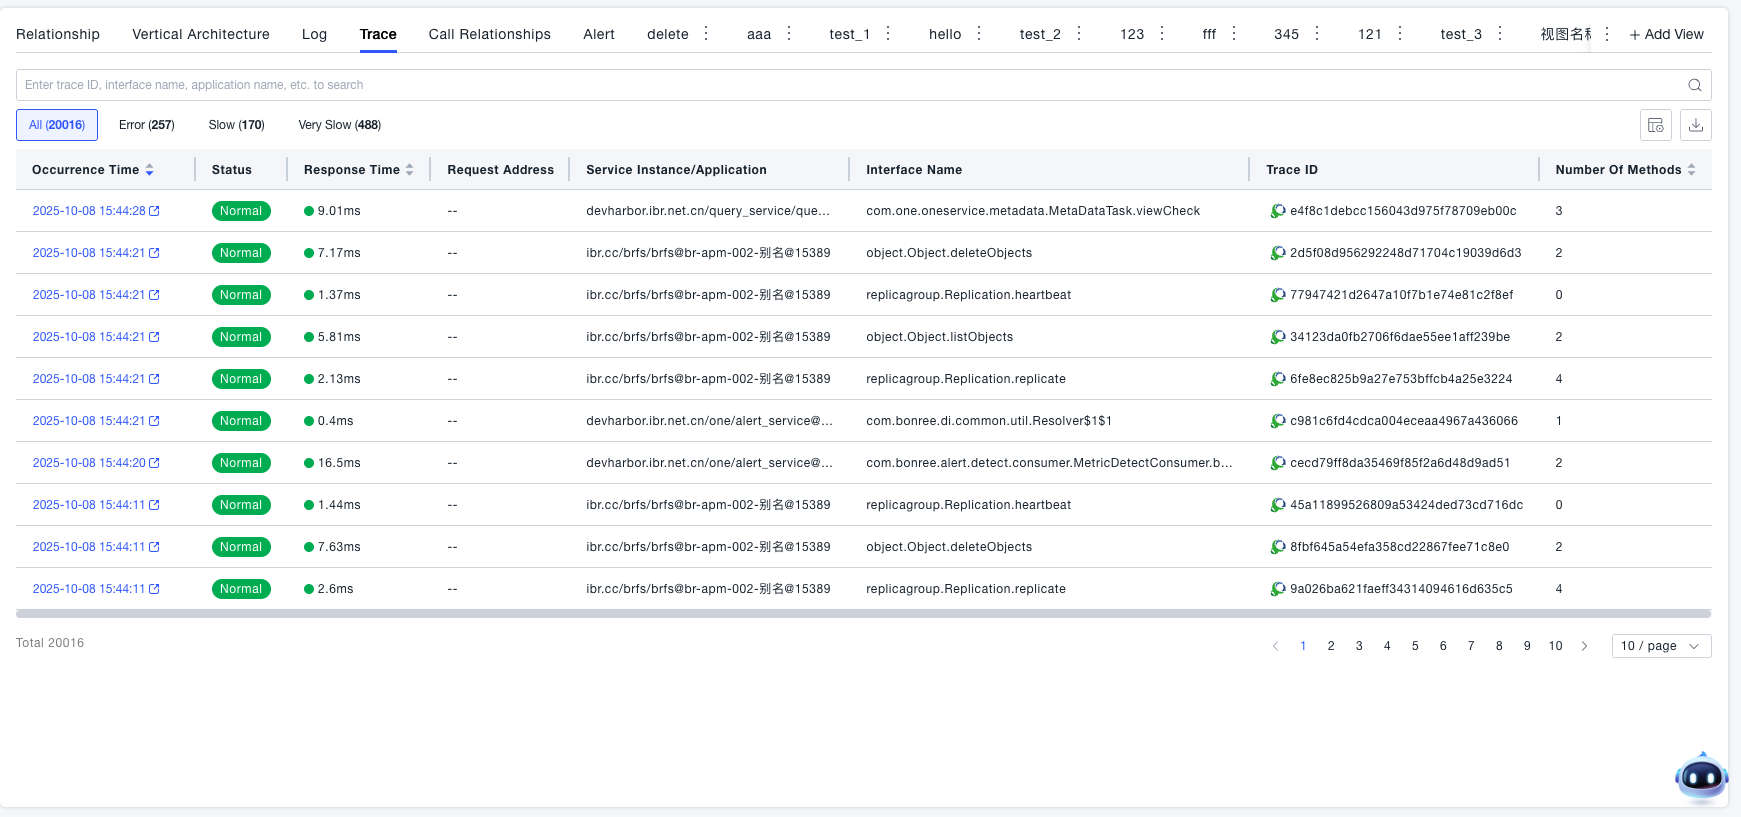
Traces
View the trace status of associated services under the current system. Displays all request links in a list with occurrence time, status, response time, and service instance information, supports filtering by error, slower, and very slow categories, and clicking to drill down to complete Trace details. For specific logic, see Traces
Call Relationships
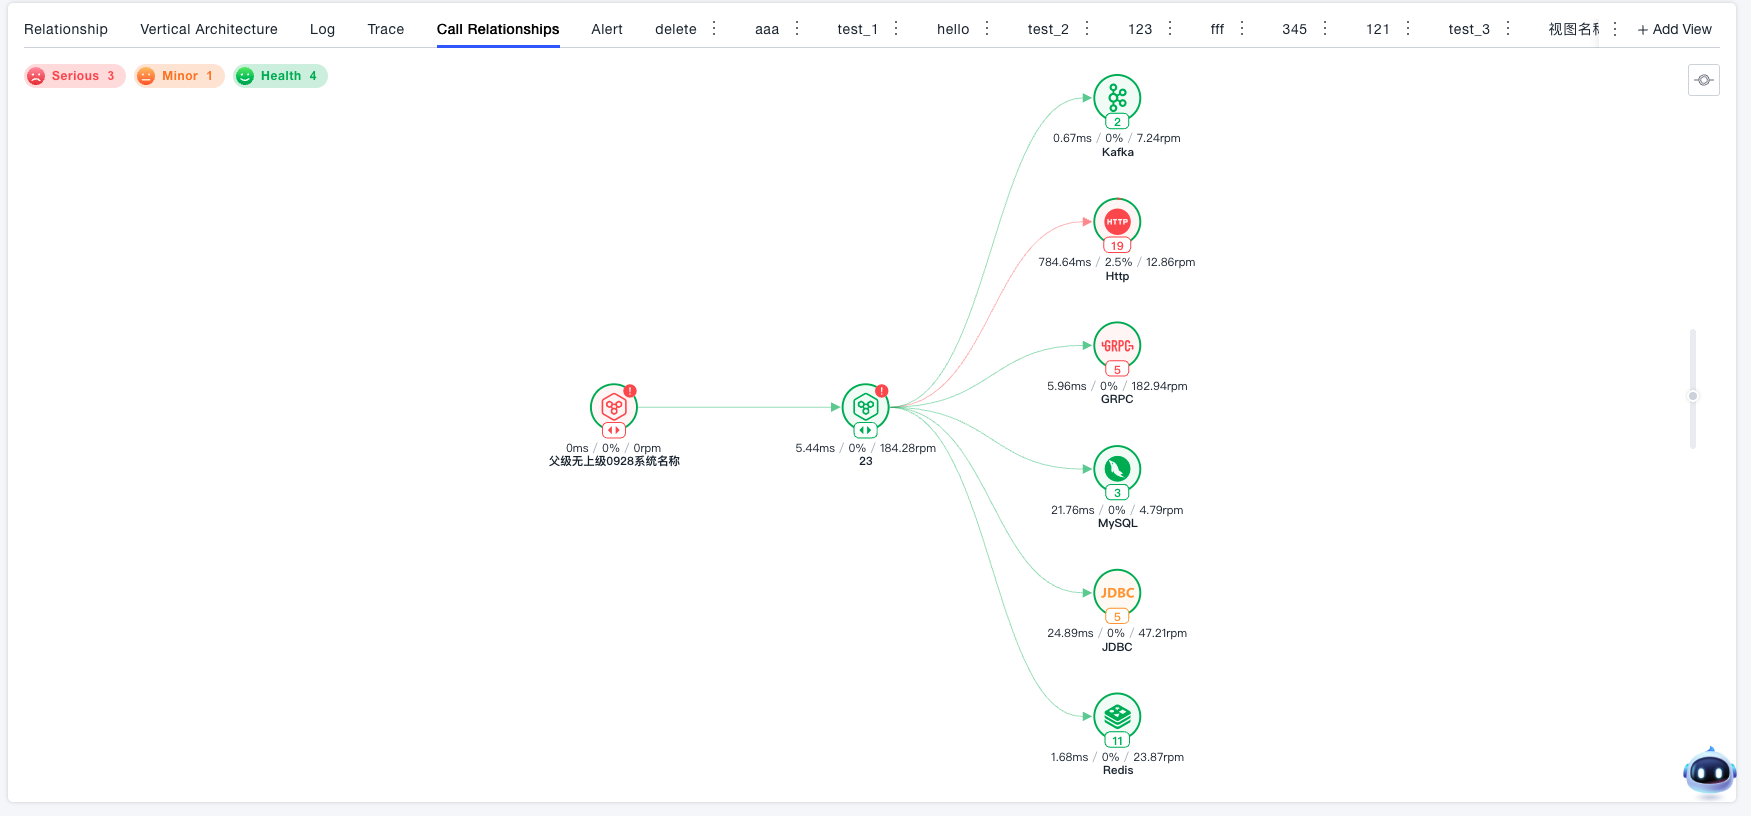
View the call topology of the current system to understand system performance, inter-system call performance, and system-to-backend call performance.
- Colored by health score by default
- Uses first-level call depth topology by default
- Supports system drill-down to view internal call topology
- Each node supports individual analysis, allowing you to view its key metrics and any other metrics. Flexible metric, trace, and event association tools help you quickly locate performance issues. Nodes are classified and identified by health status (critical / minor / healthy).
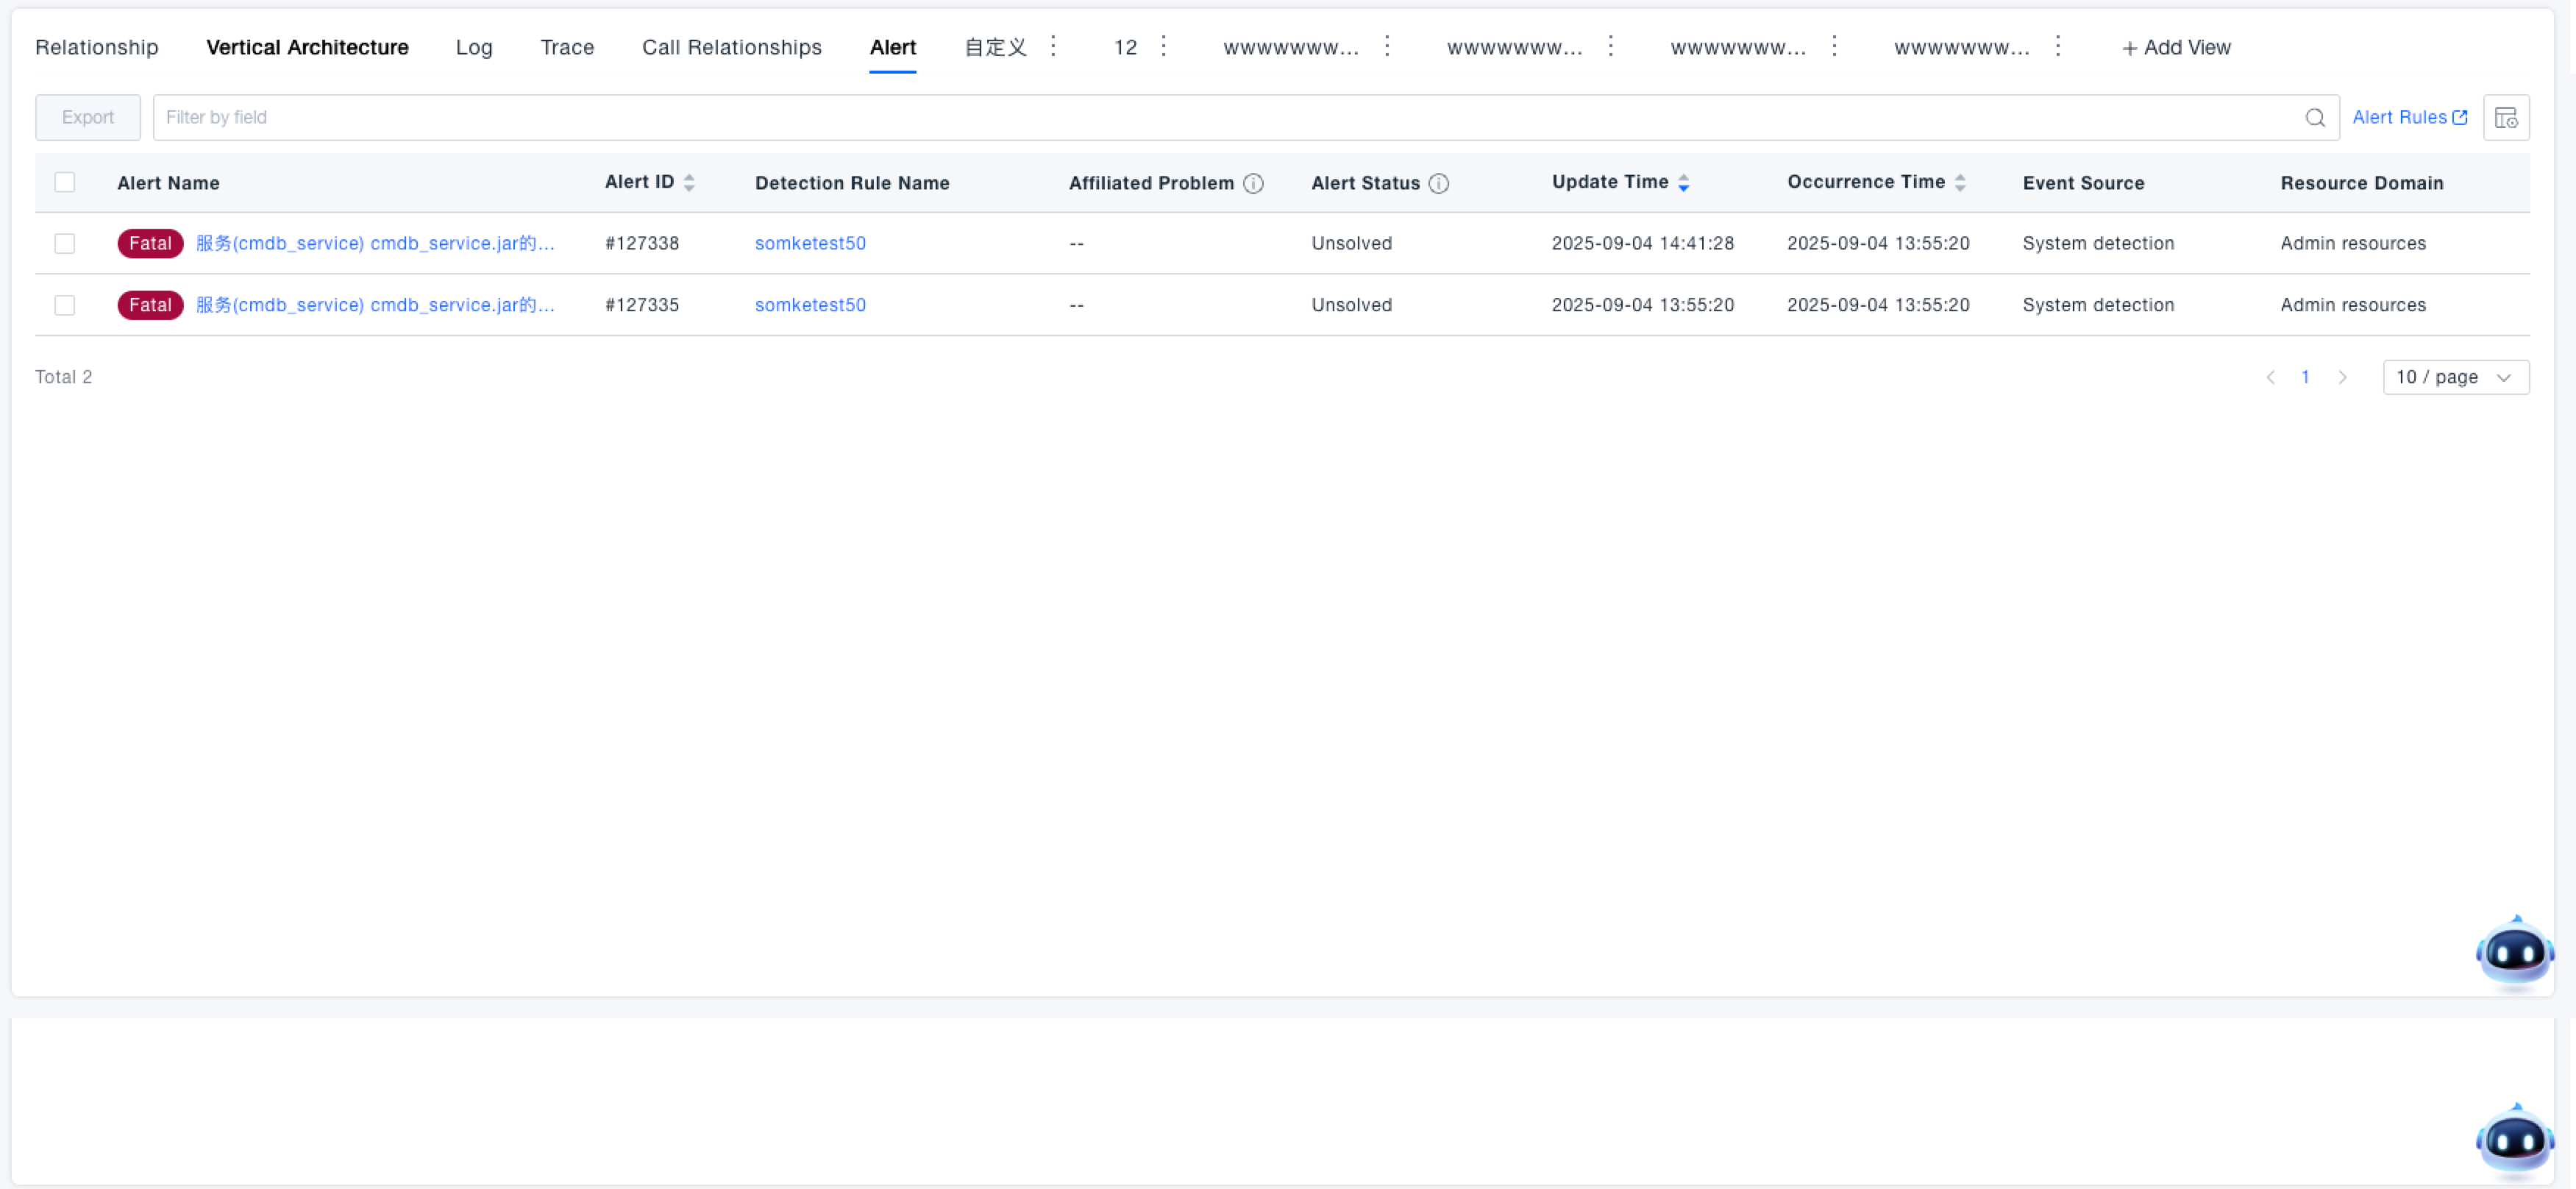
Alerts
Displays the alert event list of associated services under the system, including alert name, level, detection rule, alert status, occurrence time, etc. Information, supports filtering and exporting by field.
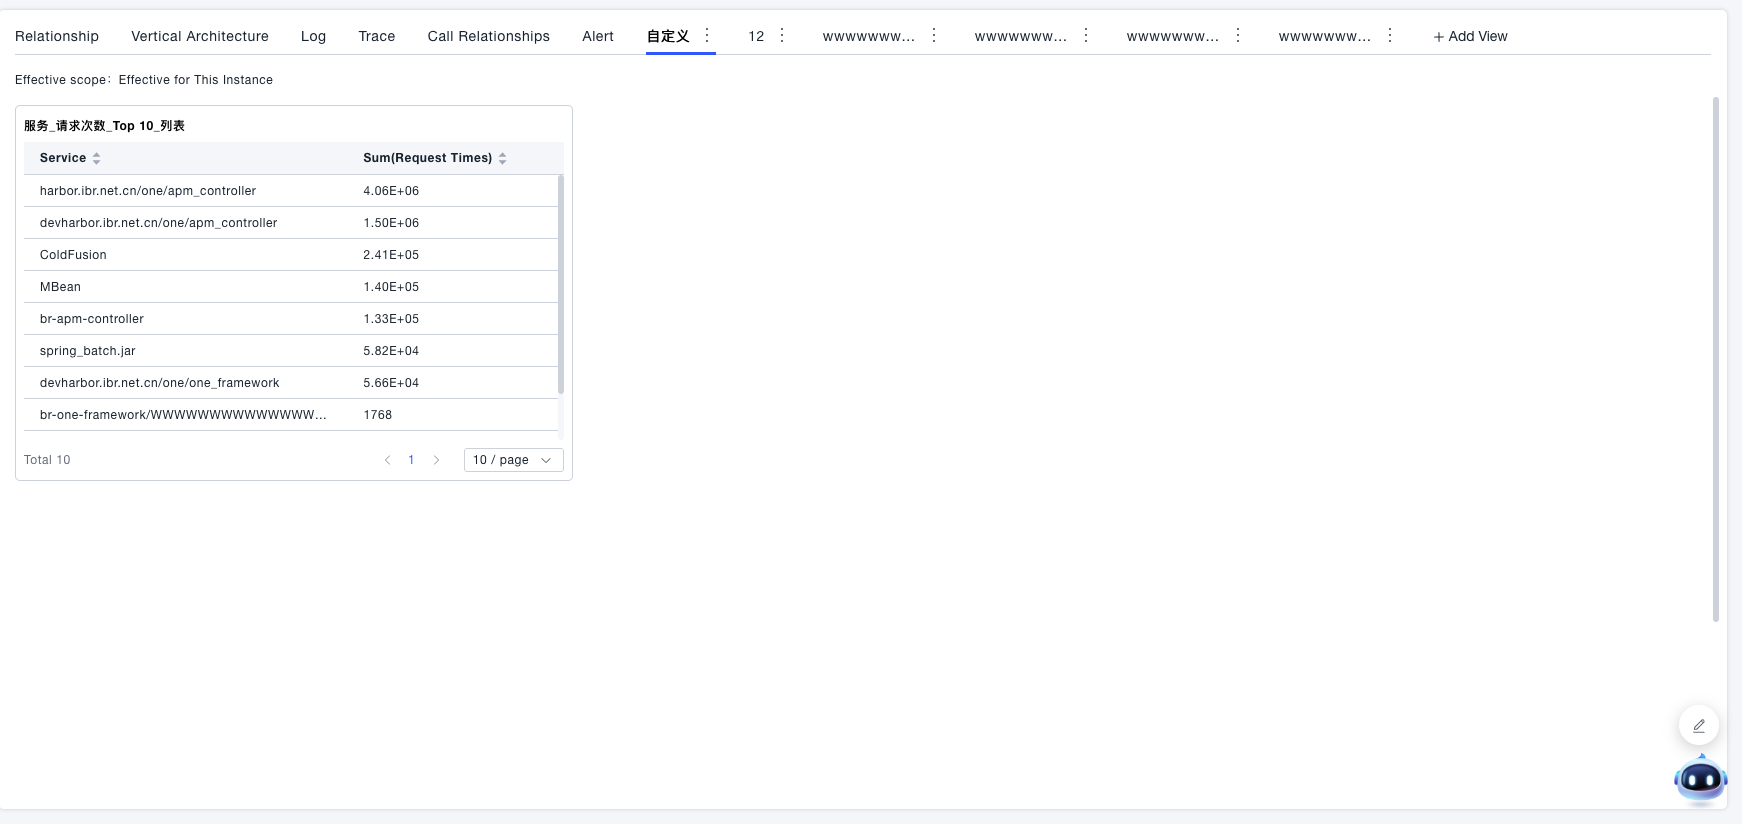
Custom Views
- Click "+ Add View" on the system details page and enter the view name.
- Select the effective range:
- "Effective for this instance" only takes effect for the current system;
- "Global effective" takes effect for all systems;
- "Effective for some instances" takes effect for the selected part of the systems.
- Select an existing dashboard as the view content, and optionally enable "Default Display". After enabling, this custom view will be displayed by default when entering the corresponding node details page.
- Click "Save" to complete the addition, and the new view will appear in the Tab bar.
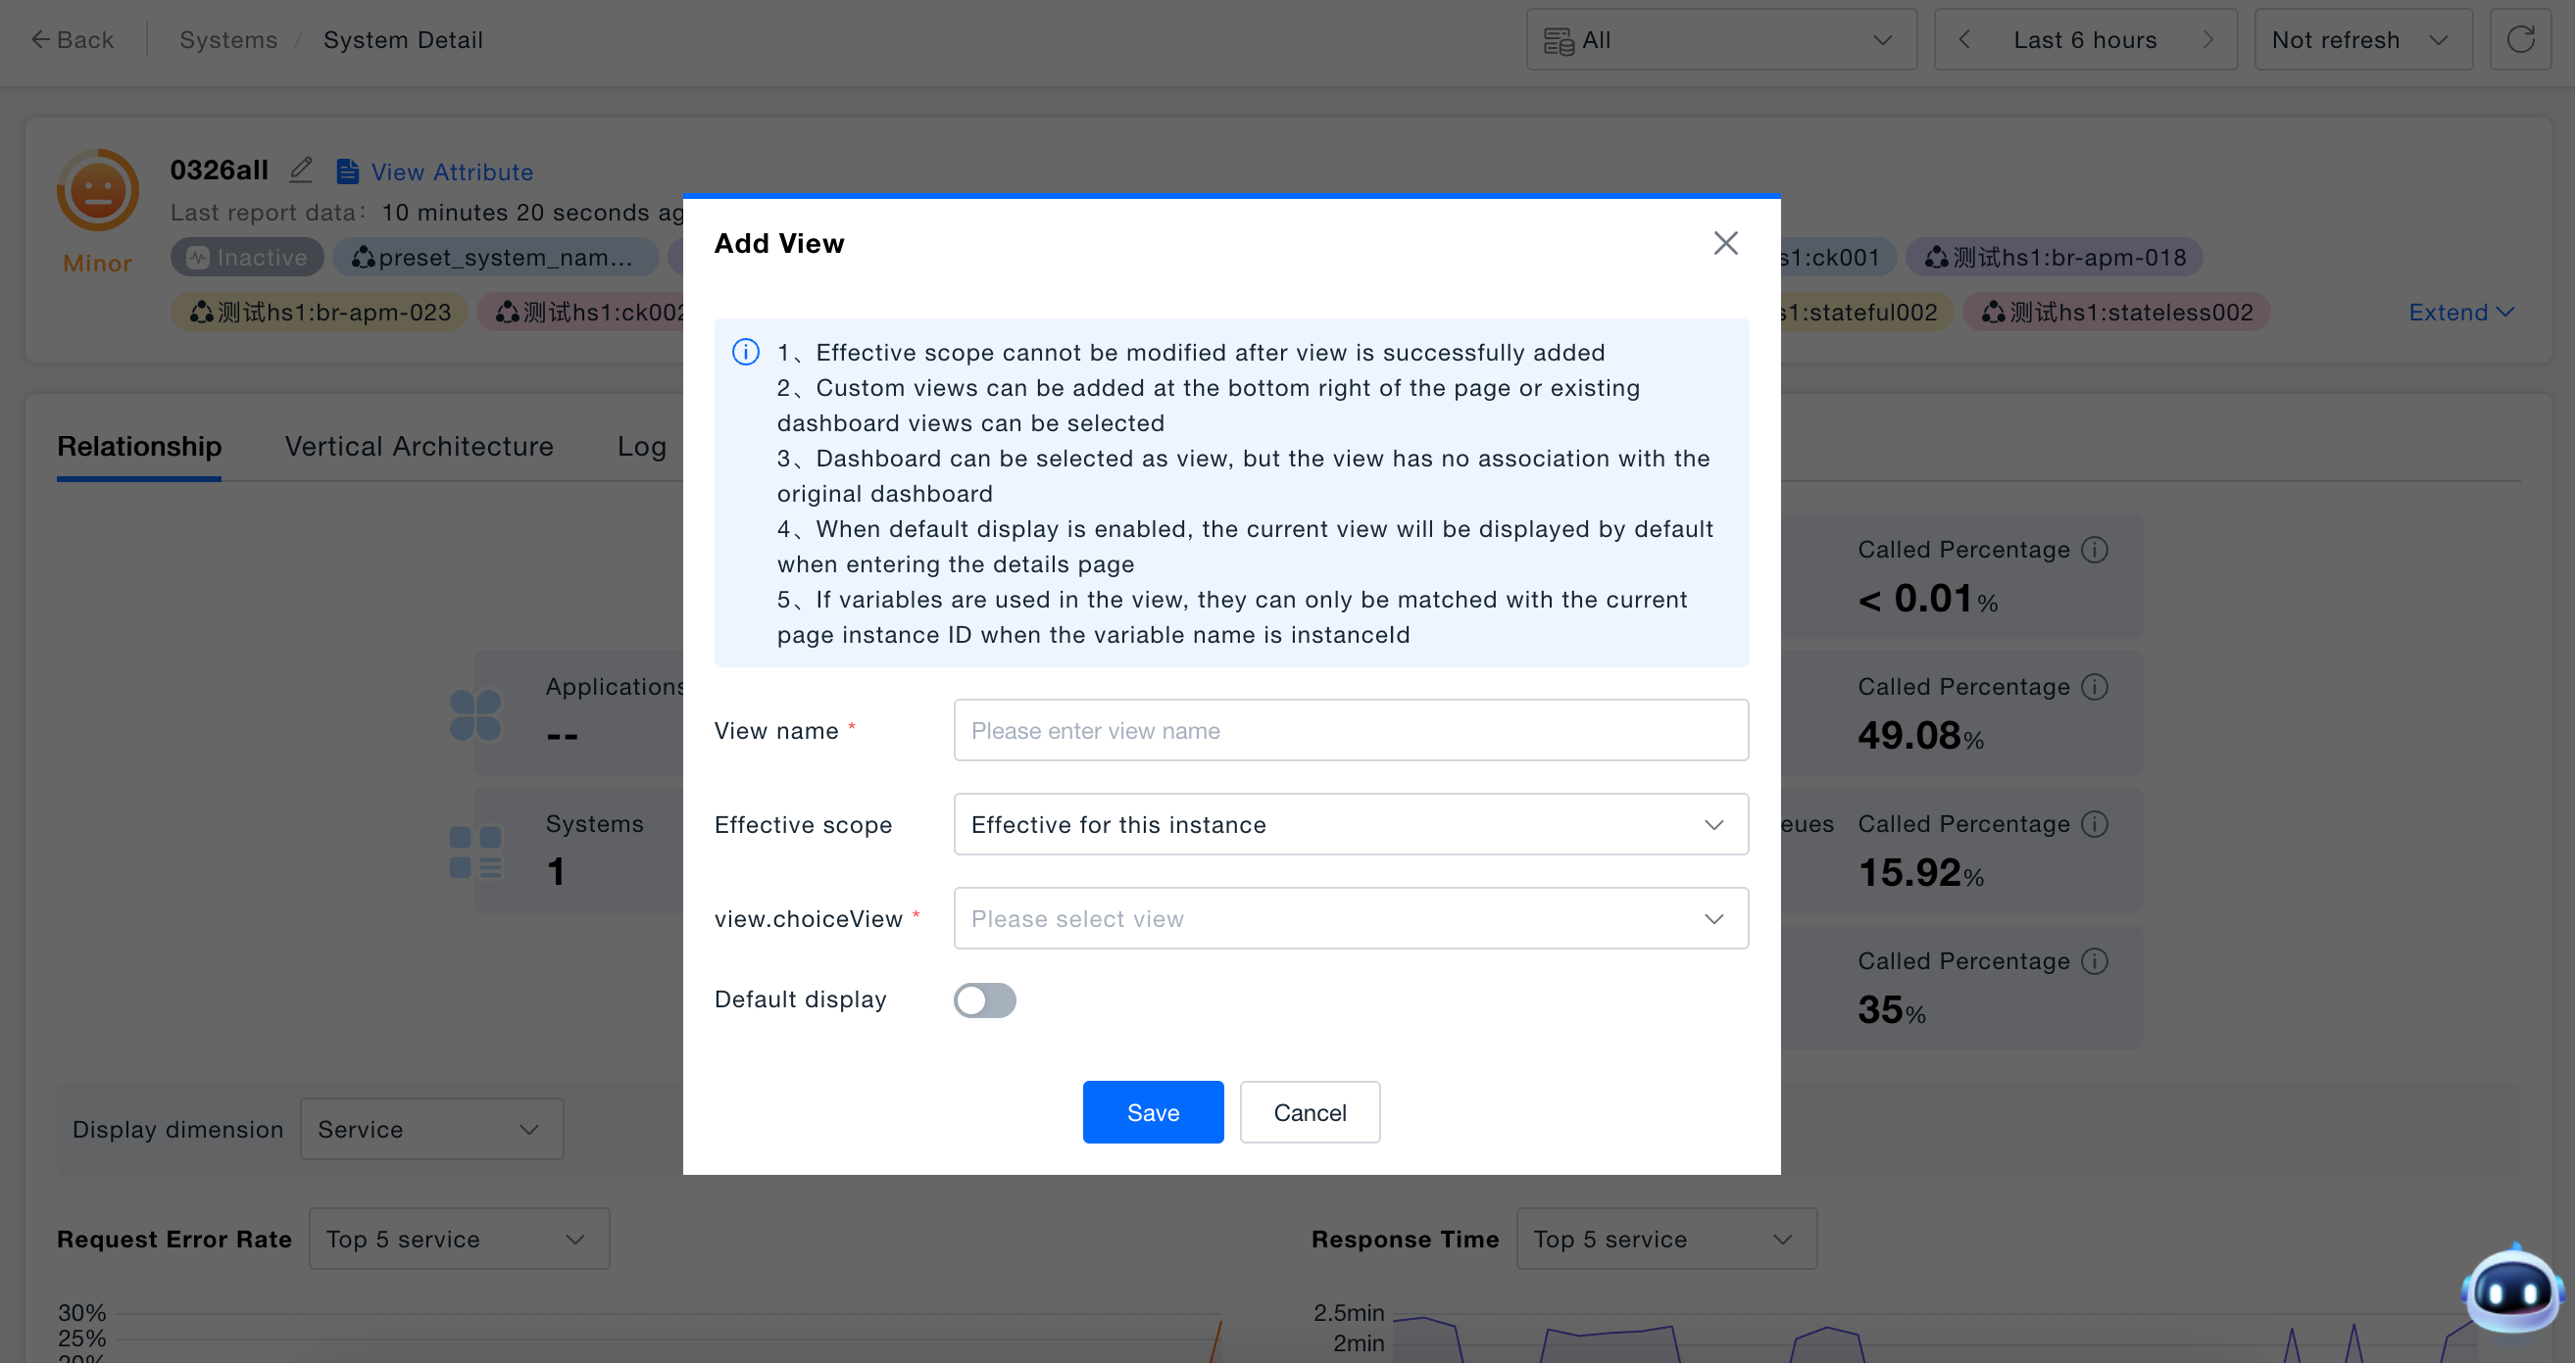
- Effective range cannot be modified: The effective range can only be modified when creating the view, and cannot be modified when editing.
- Views and dashboards are independent of each other: After the view is created, it is no longer associated with the selected dashboard. Editing the view will not affect the original dashboard (historical logic). When editing the view, the dashboard drop-down box is disabled (new logic); if the original dashboard has been deleted, or the shared dashboard has been unshared, the drop-down box will display "Dashboard does not exist", but it will not affect other editing operations of the view.
- Priority rules for default display: Each details page can only display one view by default. The "Default Display" switch status of each view will be synchronized to all instances within the effective range, but the view actually displayed by default by the instance is judged according to the following priority: Effective for this instance > Effective for some instances > Global effective. Within the same effective range, the view with "Default Display" enabled and the latest creation time is displayed; only views with the switch in the enabled state will participate in the priority judgment.