Remote Calls
Through the remote calls module, you can quickly discover performance issues in third-party services or inter-service calls from two dimensions: Remote Service Instances and Remote Interfaces, and locate the root cause of anomalies.
- Third-party Remote Calls: Processes with agents installed make requests to services without agents installed.
- Inter-service Remote Calls: Processes with agents installed make requests to services also with agents installed.
Core Capabilities
- Bubble Chart Anomaly Location: Through the remote call statistics bubble chart, quickly identify abnormal calls from multiple dimensions of throughput, error rate, and average response time.
- Dual-dimension Analysis Entrance: Supports independent analysis from two dimensions of remote service instances and remote interfaces, covering different troubleshooting scenarios.
- Key Interface Marking: Supports marking high-value remote interfaces as key interfaces to quickly focus on core links.
- Drill-down Detail Analysis: Click on any instance or interface to enter the detail page, where you can view relationship, metric, call chain, error, analysis, insight and other data.
Use Cases
Scenario 1: Discovering High-latency Third-party Services: The average response time of a remote service instance increases abnormally. Locate through the bubble chart and enter the details to check the call chain to confirm the source of slow requests.
Scenario 2: Batch Screening Interface Errors: Switch to the Remote Interface tab, sort by error rate, quickly find interfaces with high error rates, and directly jump to error call chains to locate the cause.
Scenario 3: Monitoring Core Business Interfaces: Mark key business interfaces as "Key Remote Interfaces", quickly filter through tab switching, and focus on core link quality.
Getting Started
Navigate to System Services → Remote Calls to access the remote calls page, which displays the "Remote Service Instances" tab by default.
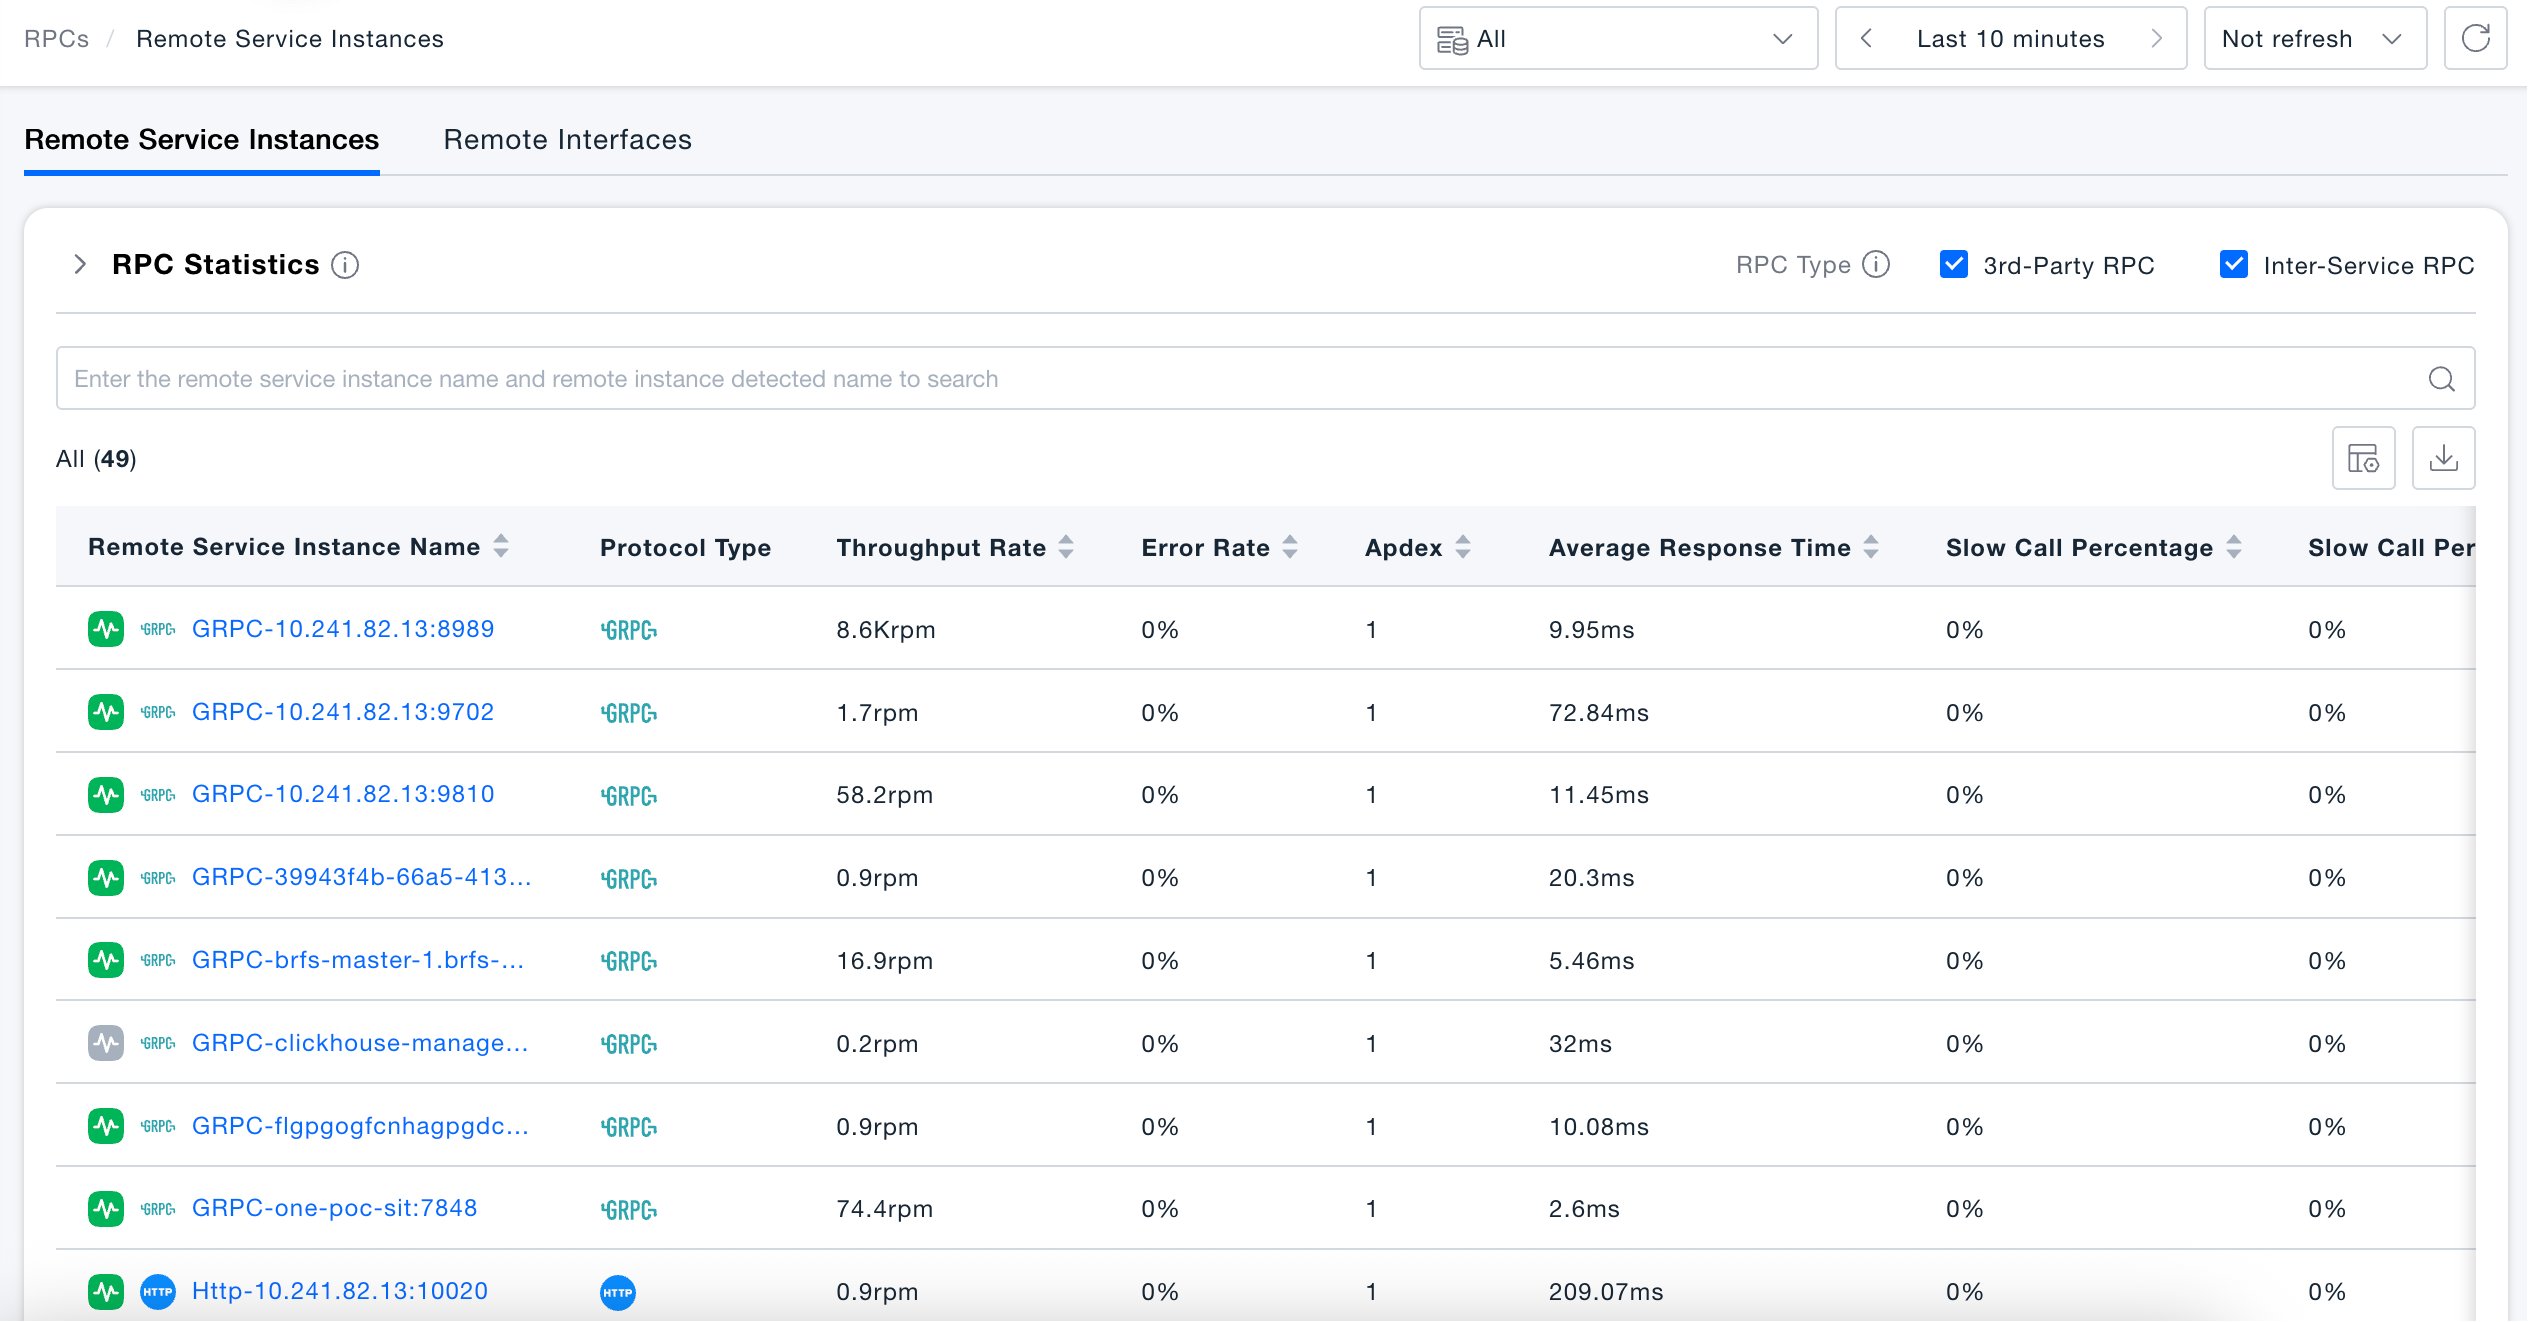
Remote Service Instances
The list presents instance data for all remote calls within the current time range, including metrics such as throughput, error rate, Apdex, average response time, proportion of slow/very slow calls, and tags.
You can:
- Use the top search box to search by Remote Service Instance Name or Remote Instance Identifier Name.
- Check the Third-party Remote Calls / Inter-service Remote Calls in the upper right corner to quickly filter call types.
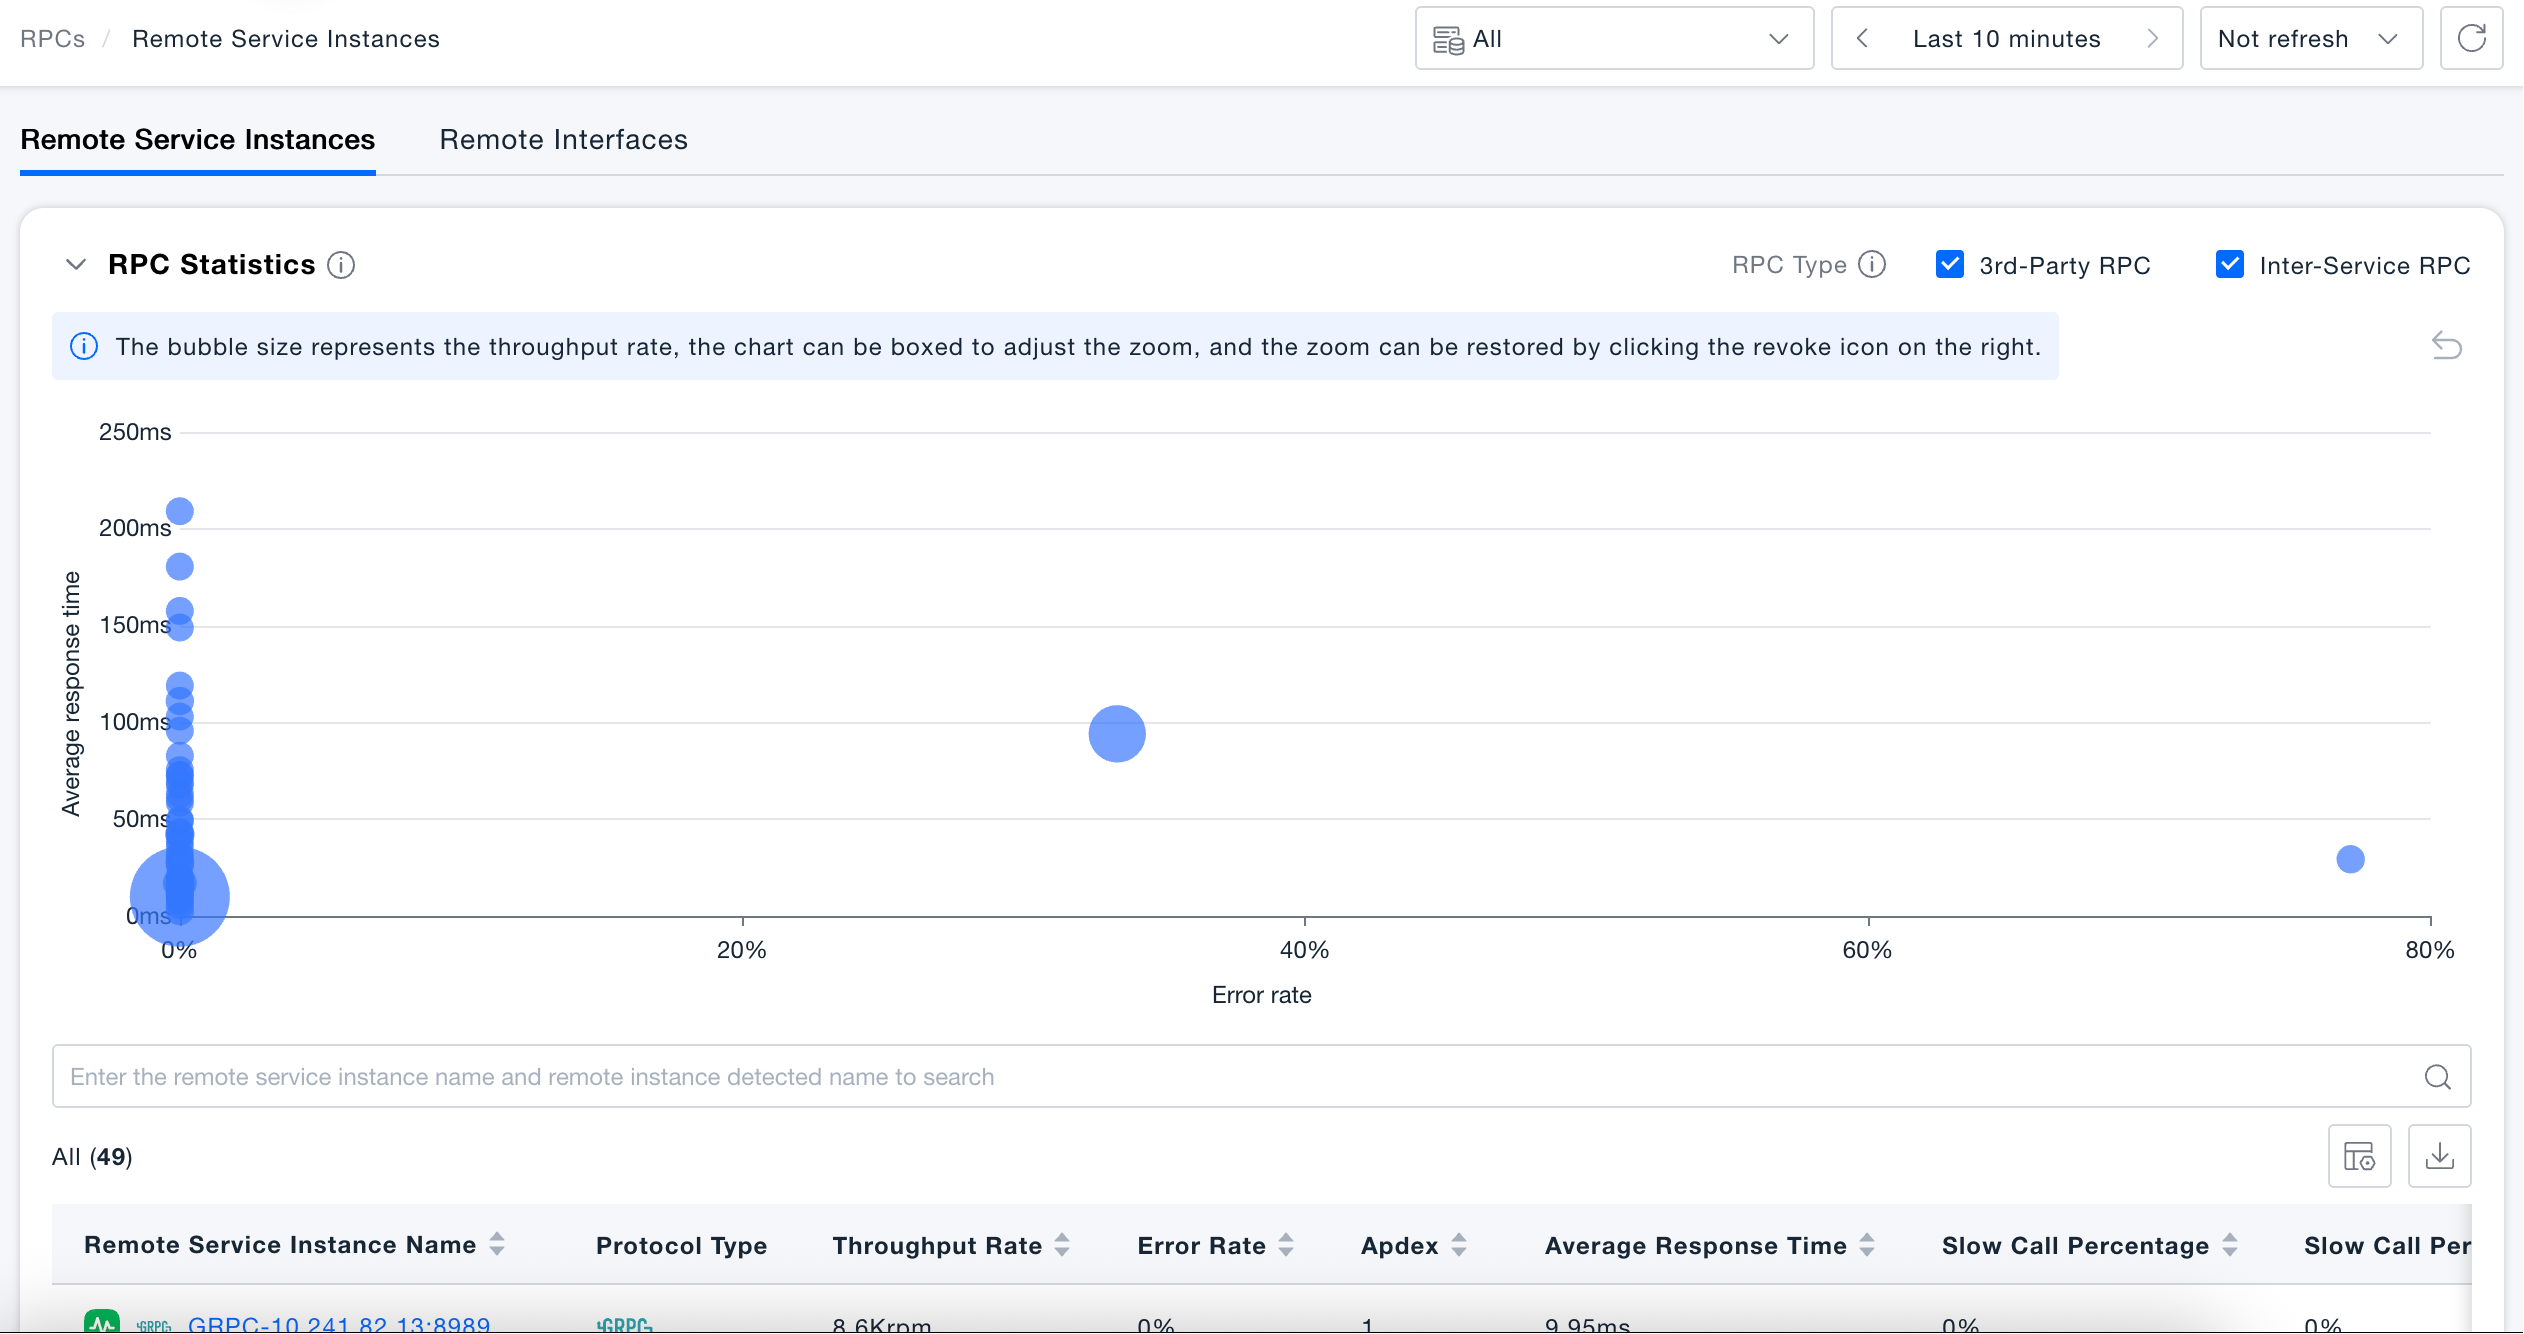
- Expand the "Remote Call Statistics" area to view the bubble chart composed of average response time (Y-axis) × error rate (X-axis) × throughput (bubble size). You can box-select areas to zoom in locally.
- Click on the instance name in the list to enter the Remote Call Details page for drill-down analysis.
- Support custom table header fields (including protocol type, call address), and export the current list as CSV (file name:
Remote service instances_Selected time range.csv).
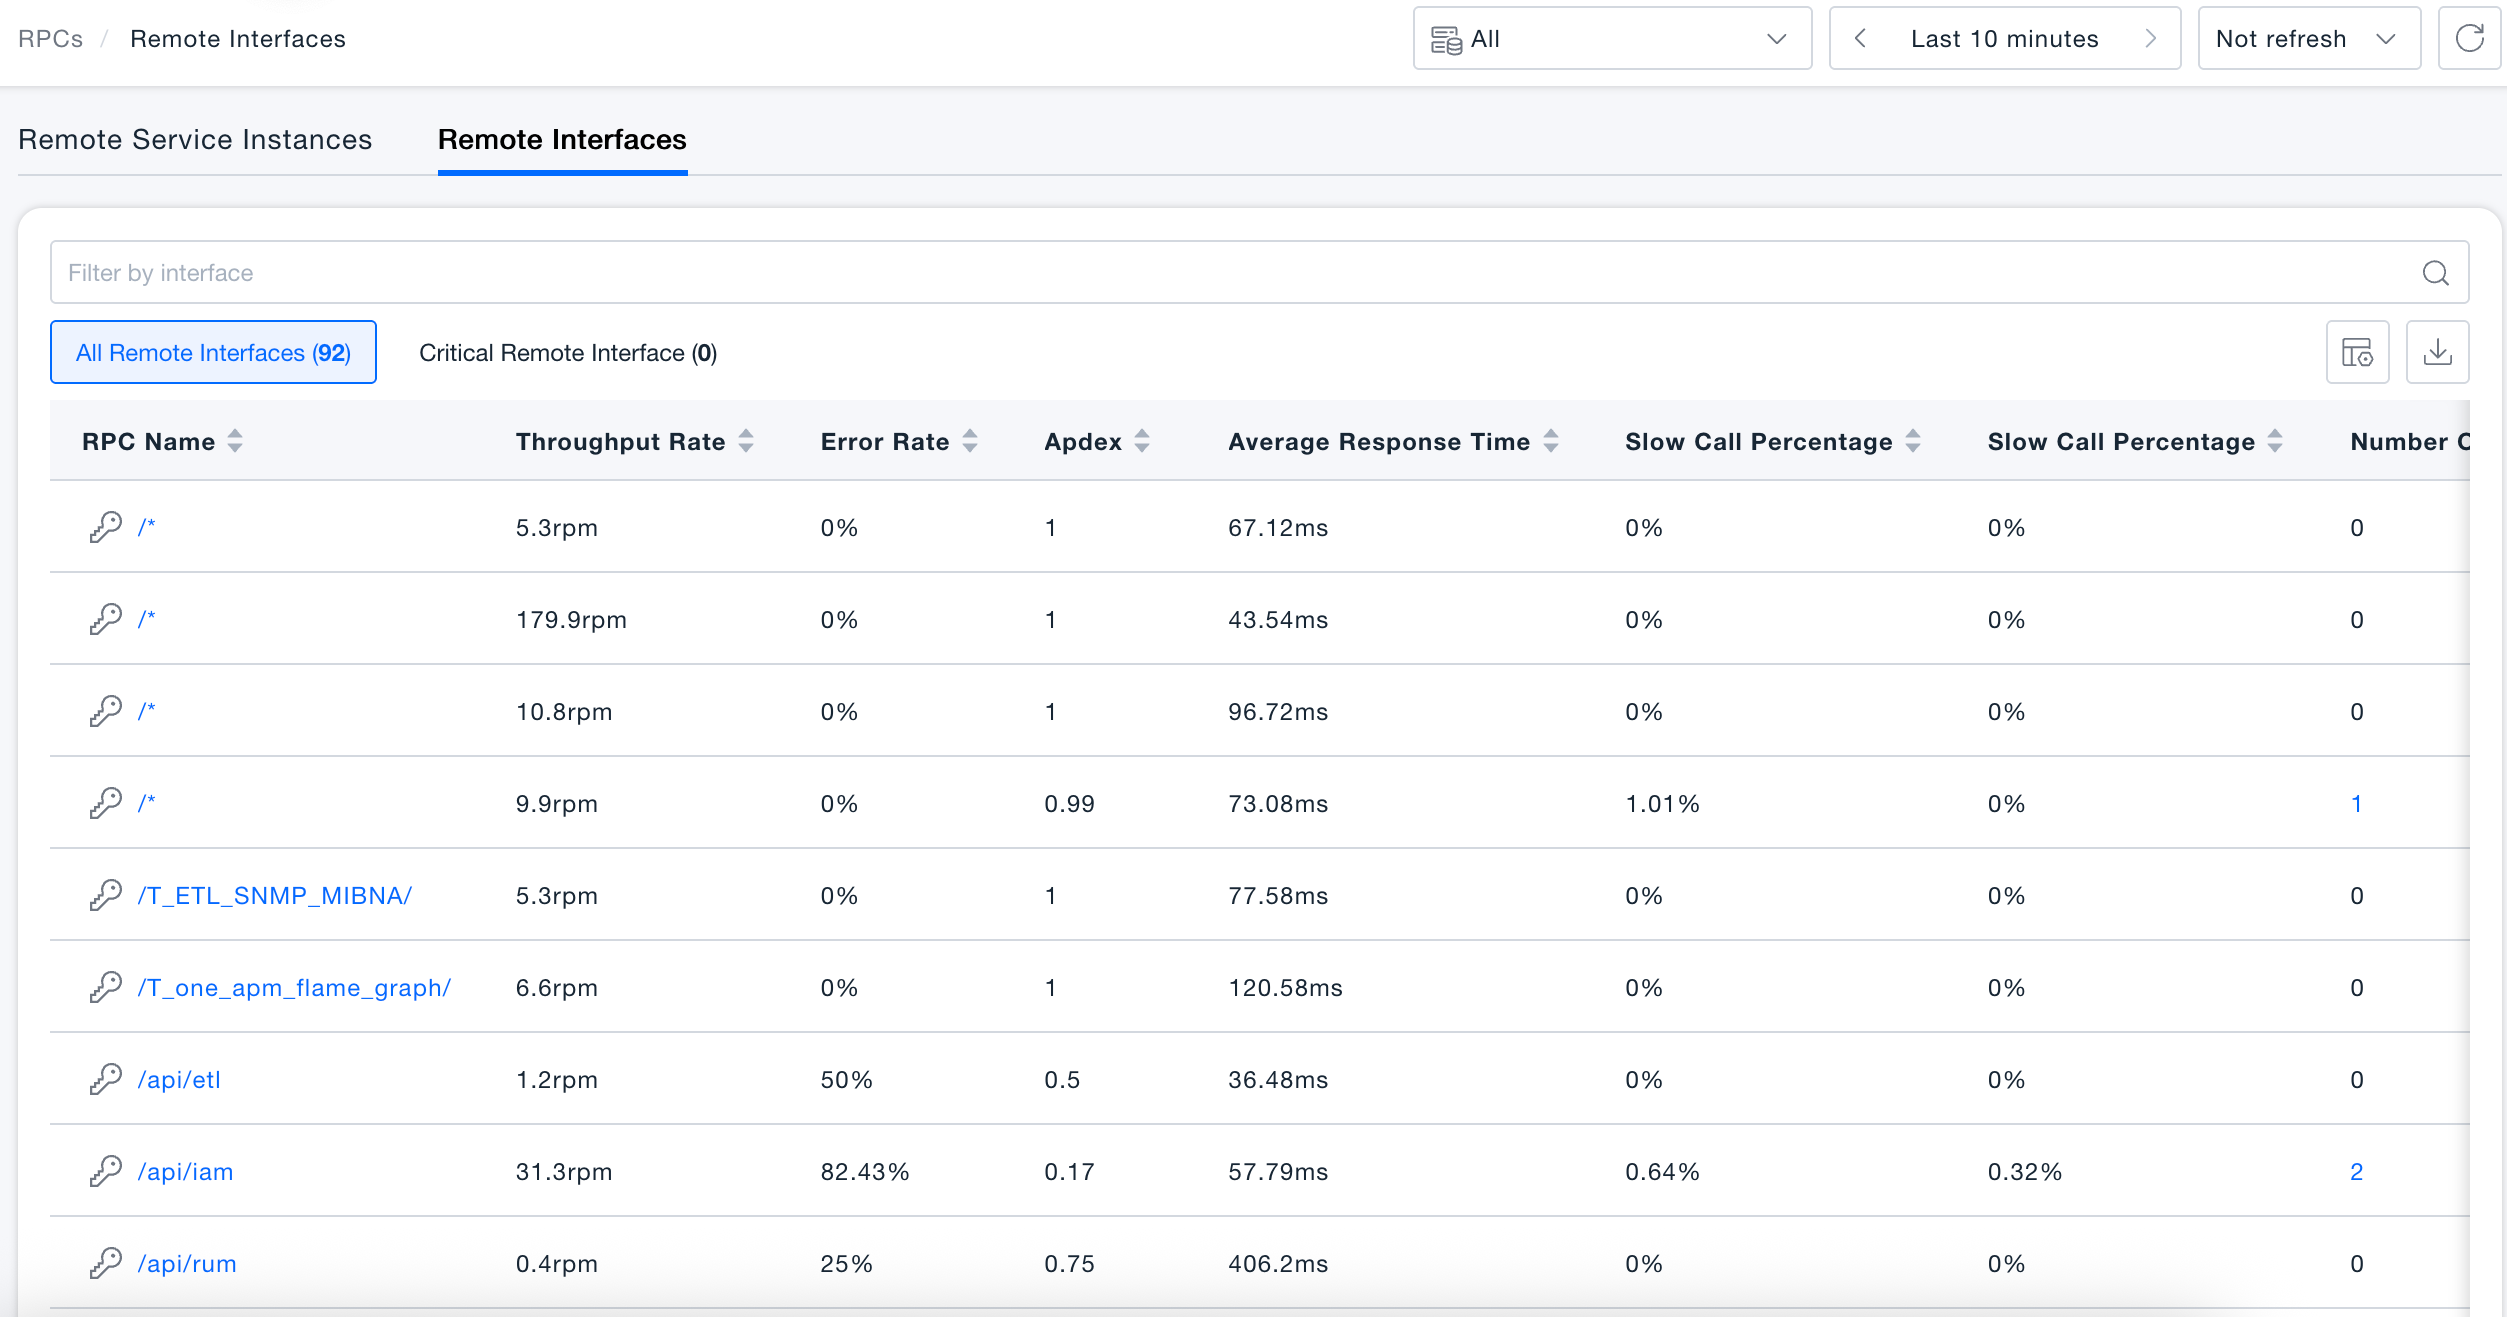
Remote Interfaces
Switch to the "Remote Interfaces" tab to analyze remote call performance from the interface granularity, supporting quick filtering of all remote interfaces or key remote interfaces.
Filtering
- Attribute Filtering: Supports remote interface name, remote interface identifier name, domain name, remote service instance name, remote instance identifier name, affiliated service, affiliated service identifier name.
- Metric Filtering: Supports call count, throughput, error rate, Apdex, average/maximum/minimum response time, P50/P75/P95/P99 response time, slow/very slow call count and proportion, error call count.
Key Interfaces
- Click the 🔑 icon in the list row to mark or unmark the interface as a Key Remote Interface.
- Click the "Key Remote Interfaces" tab to quickly filter out the list of marked interfaces.
List Fields and Drill-down
The list displays remote interface name, throughput, error rate, Apdex, average response time, proportion of slow/very slow calls, and tags by default, supporting custom table headers. You can directly jump by clicking the following fields:
| Clickable Fields | Jump Target |
|---|---|
| Remote Interface Name | Interface Details - Relationship Page (Path: Remote Interface / Interface Details) |
| Remote Service Instance Name | Remote Service Instance Details Page |
| Error Call Count | Interface Details - Call Chain - Error Call Chain |
| Slow Call Count | Interface Details - Call Chain - Slow Call Chain |
| Very Slow Call Count | Interface Details - Call Chain - Very Slow Call Chain |
Support exporting the interface list as CSV (file name: Remote instances_Selected time range.csv).
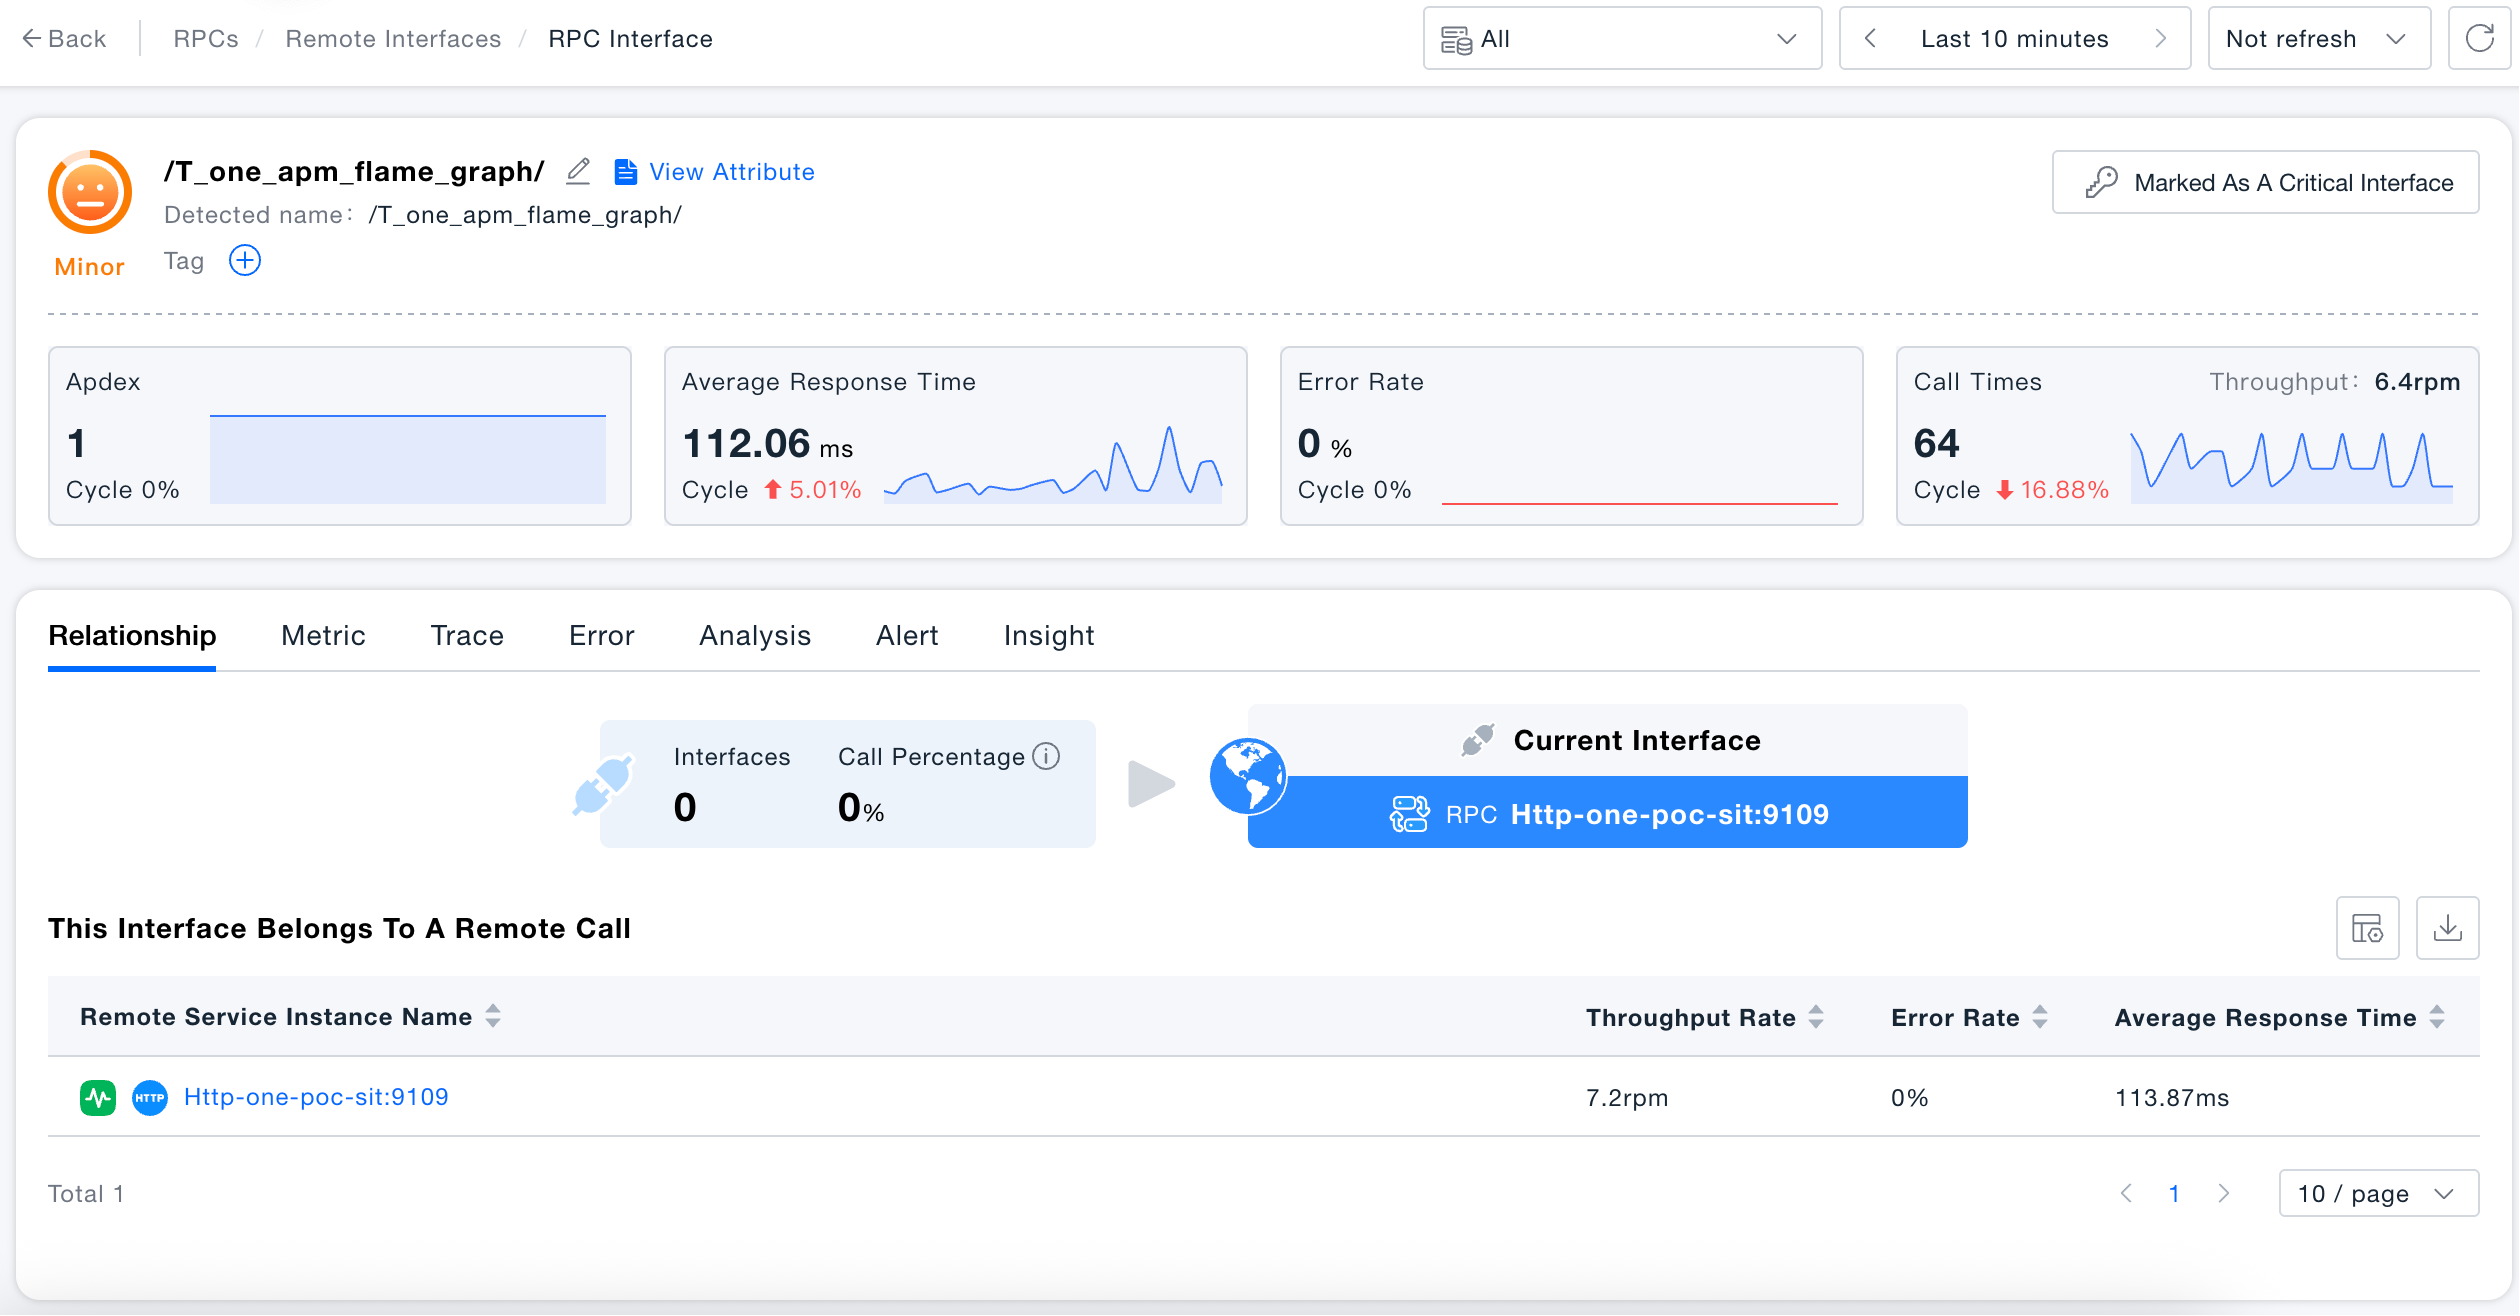
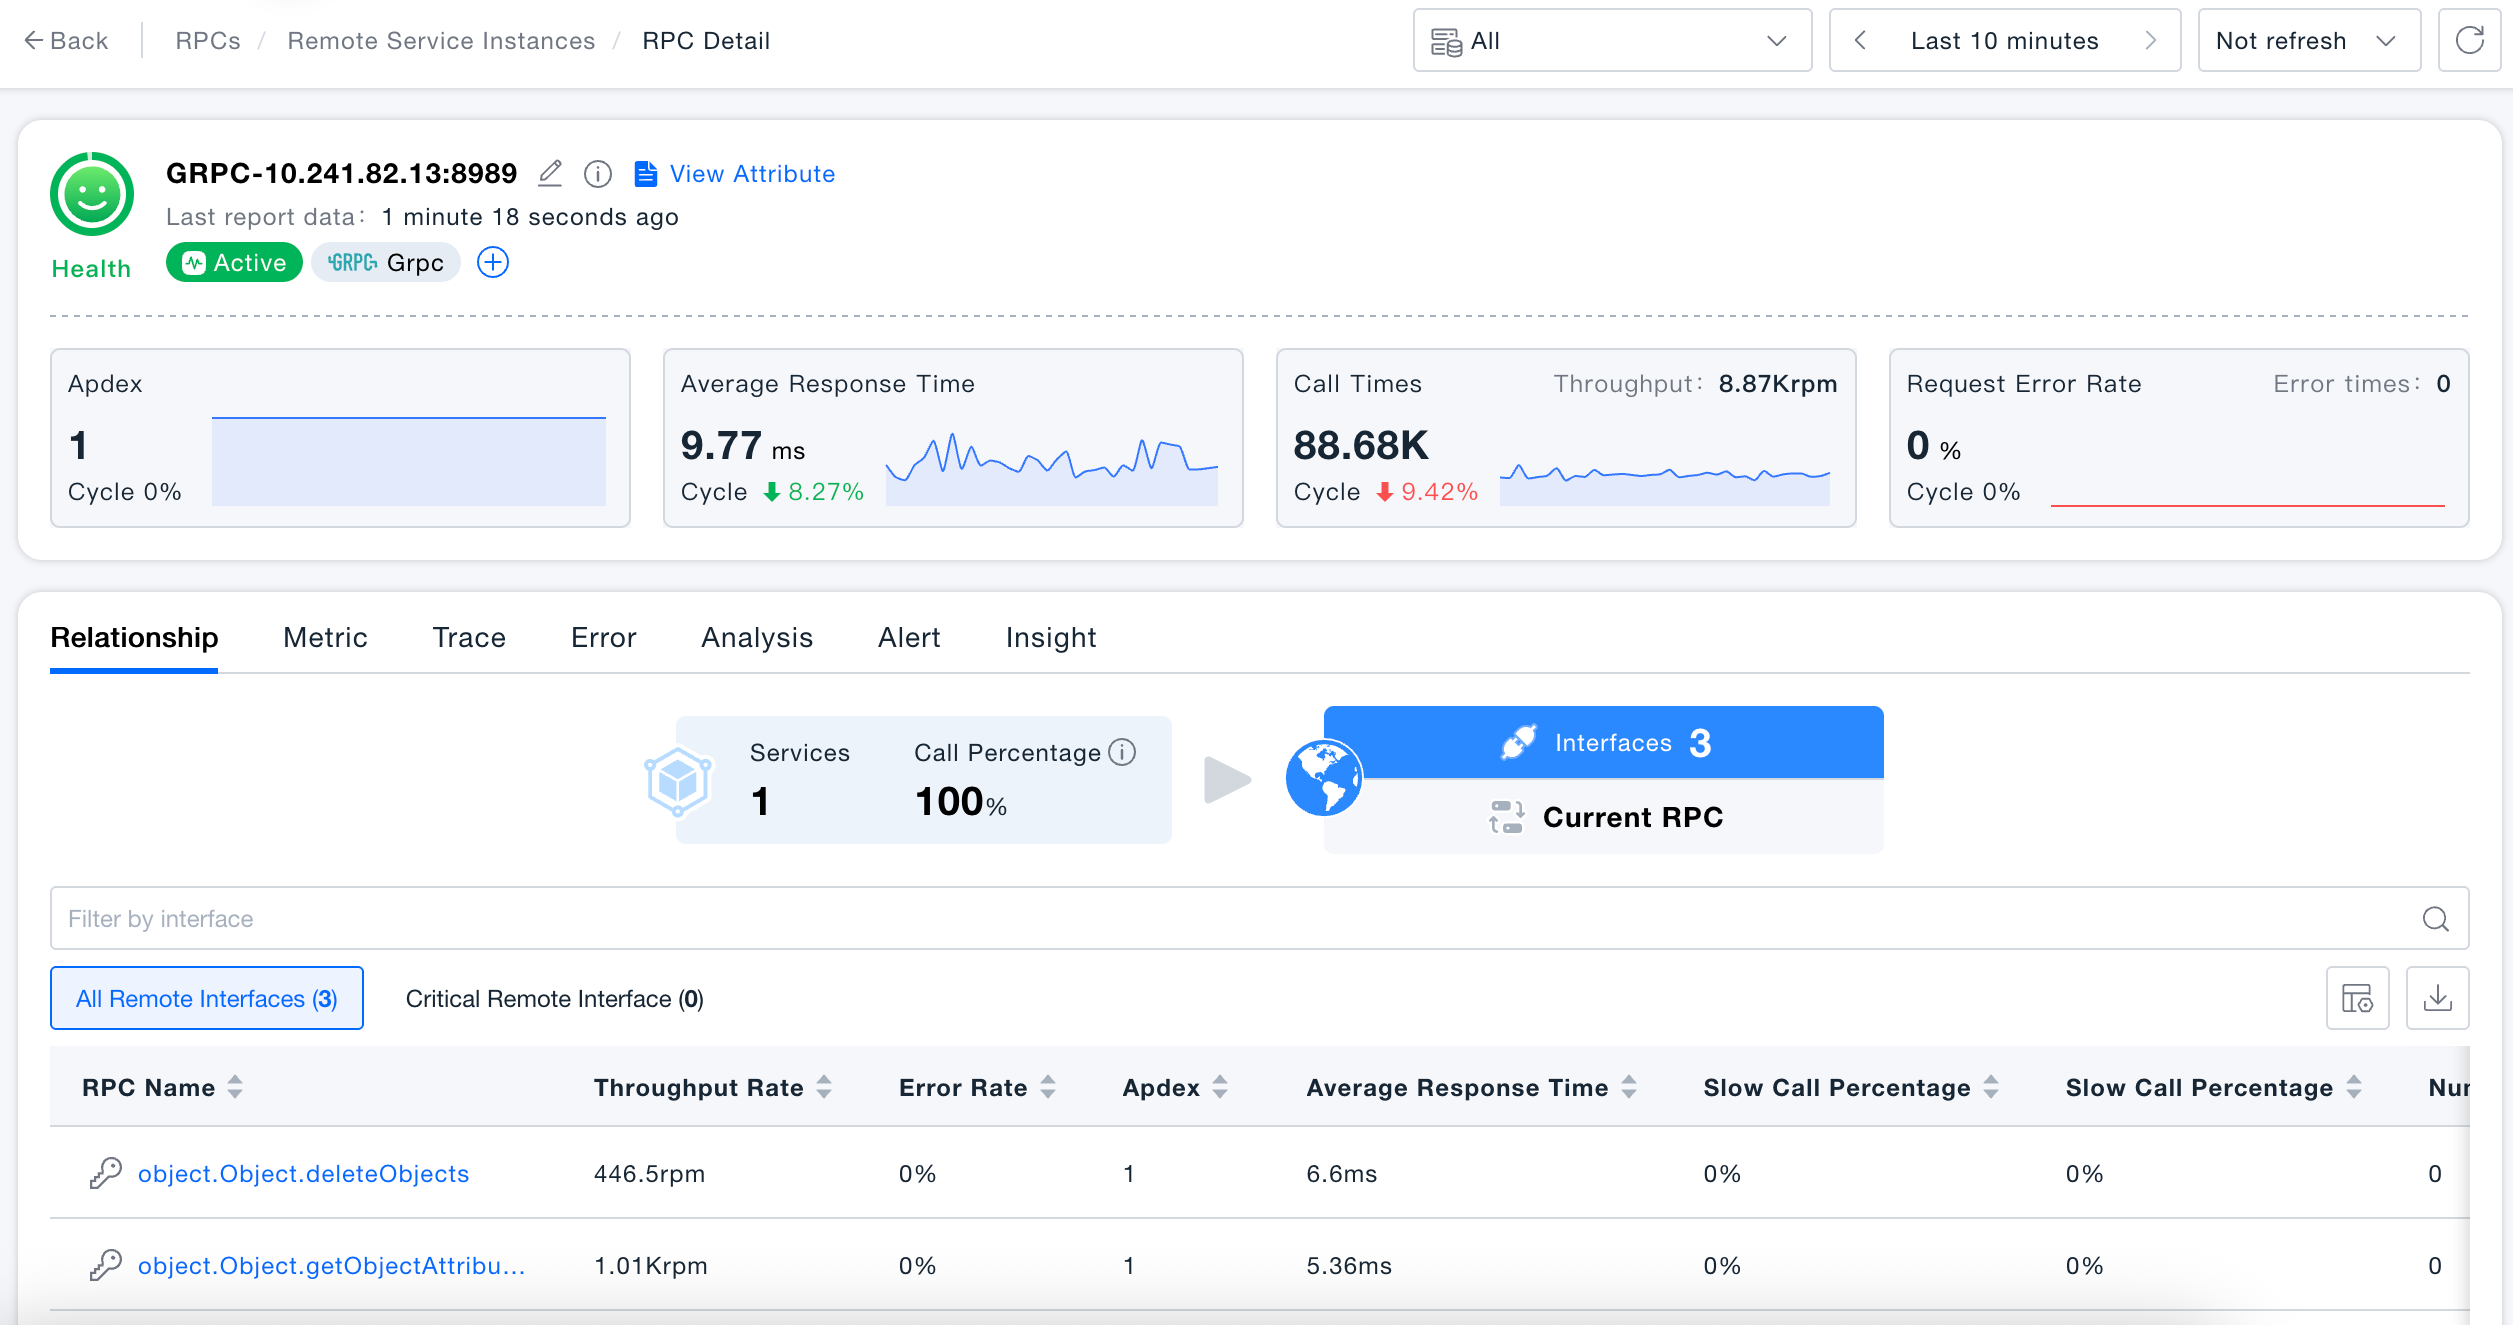
Remote Call Details
Click on the remote service instance name to enter the details page. The top displays the current instance's health status and four core metrics: Apdex, average response time, call count, and request error rate (including month-on-month trends).
The details page provides the following analysis tabs:
- Relationship: Visually displays the number of services calling this instance and the call proportion, as well as the list of remote interfaces included in the current instance.
- Metrics: View time trend charts of key performance indicators.
- Call Chain: View call chain data for this instance, supporting filtering by error, slow, and very slow.
- Errors: Display error information captured by current remote calls.
- Analysis: Provide multi-dimensional analysis such as impact analysis and topology analysis.
- Alerts: View alert records associated with the current instance.
- Insights: Display information such as health score and data collection for this instance.
Remote Interface Details
Click on the remote interface name to enter the interface details page. You can click "Mark as Key Interface" in the upper right corner to add the current interface to the key interface list. The rest of the page structure and functionality are consistent with remote call details.