Analyze Business Trace
This document describes how to utilize the health dashboard, topology drill-down, vertical application architecture, and multi-dimensional data correlation capabilities to perform analysis on core business flows.
Analysis Process
Core Business Flow Views
Core business flows can be viewed in three different formats: Statistical, Topology, and List.
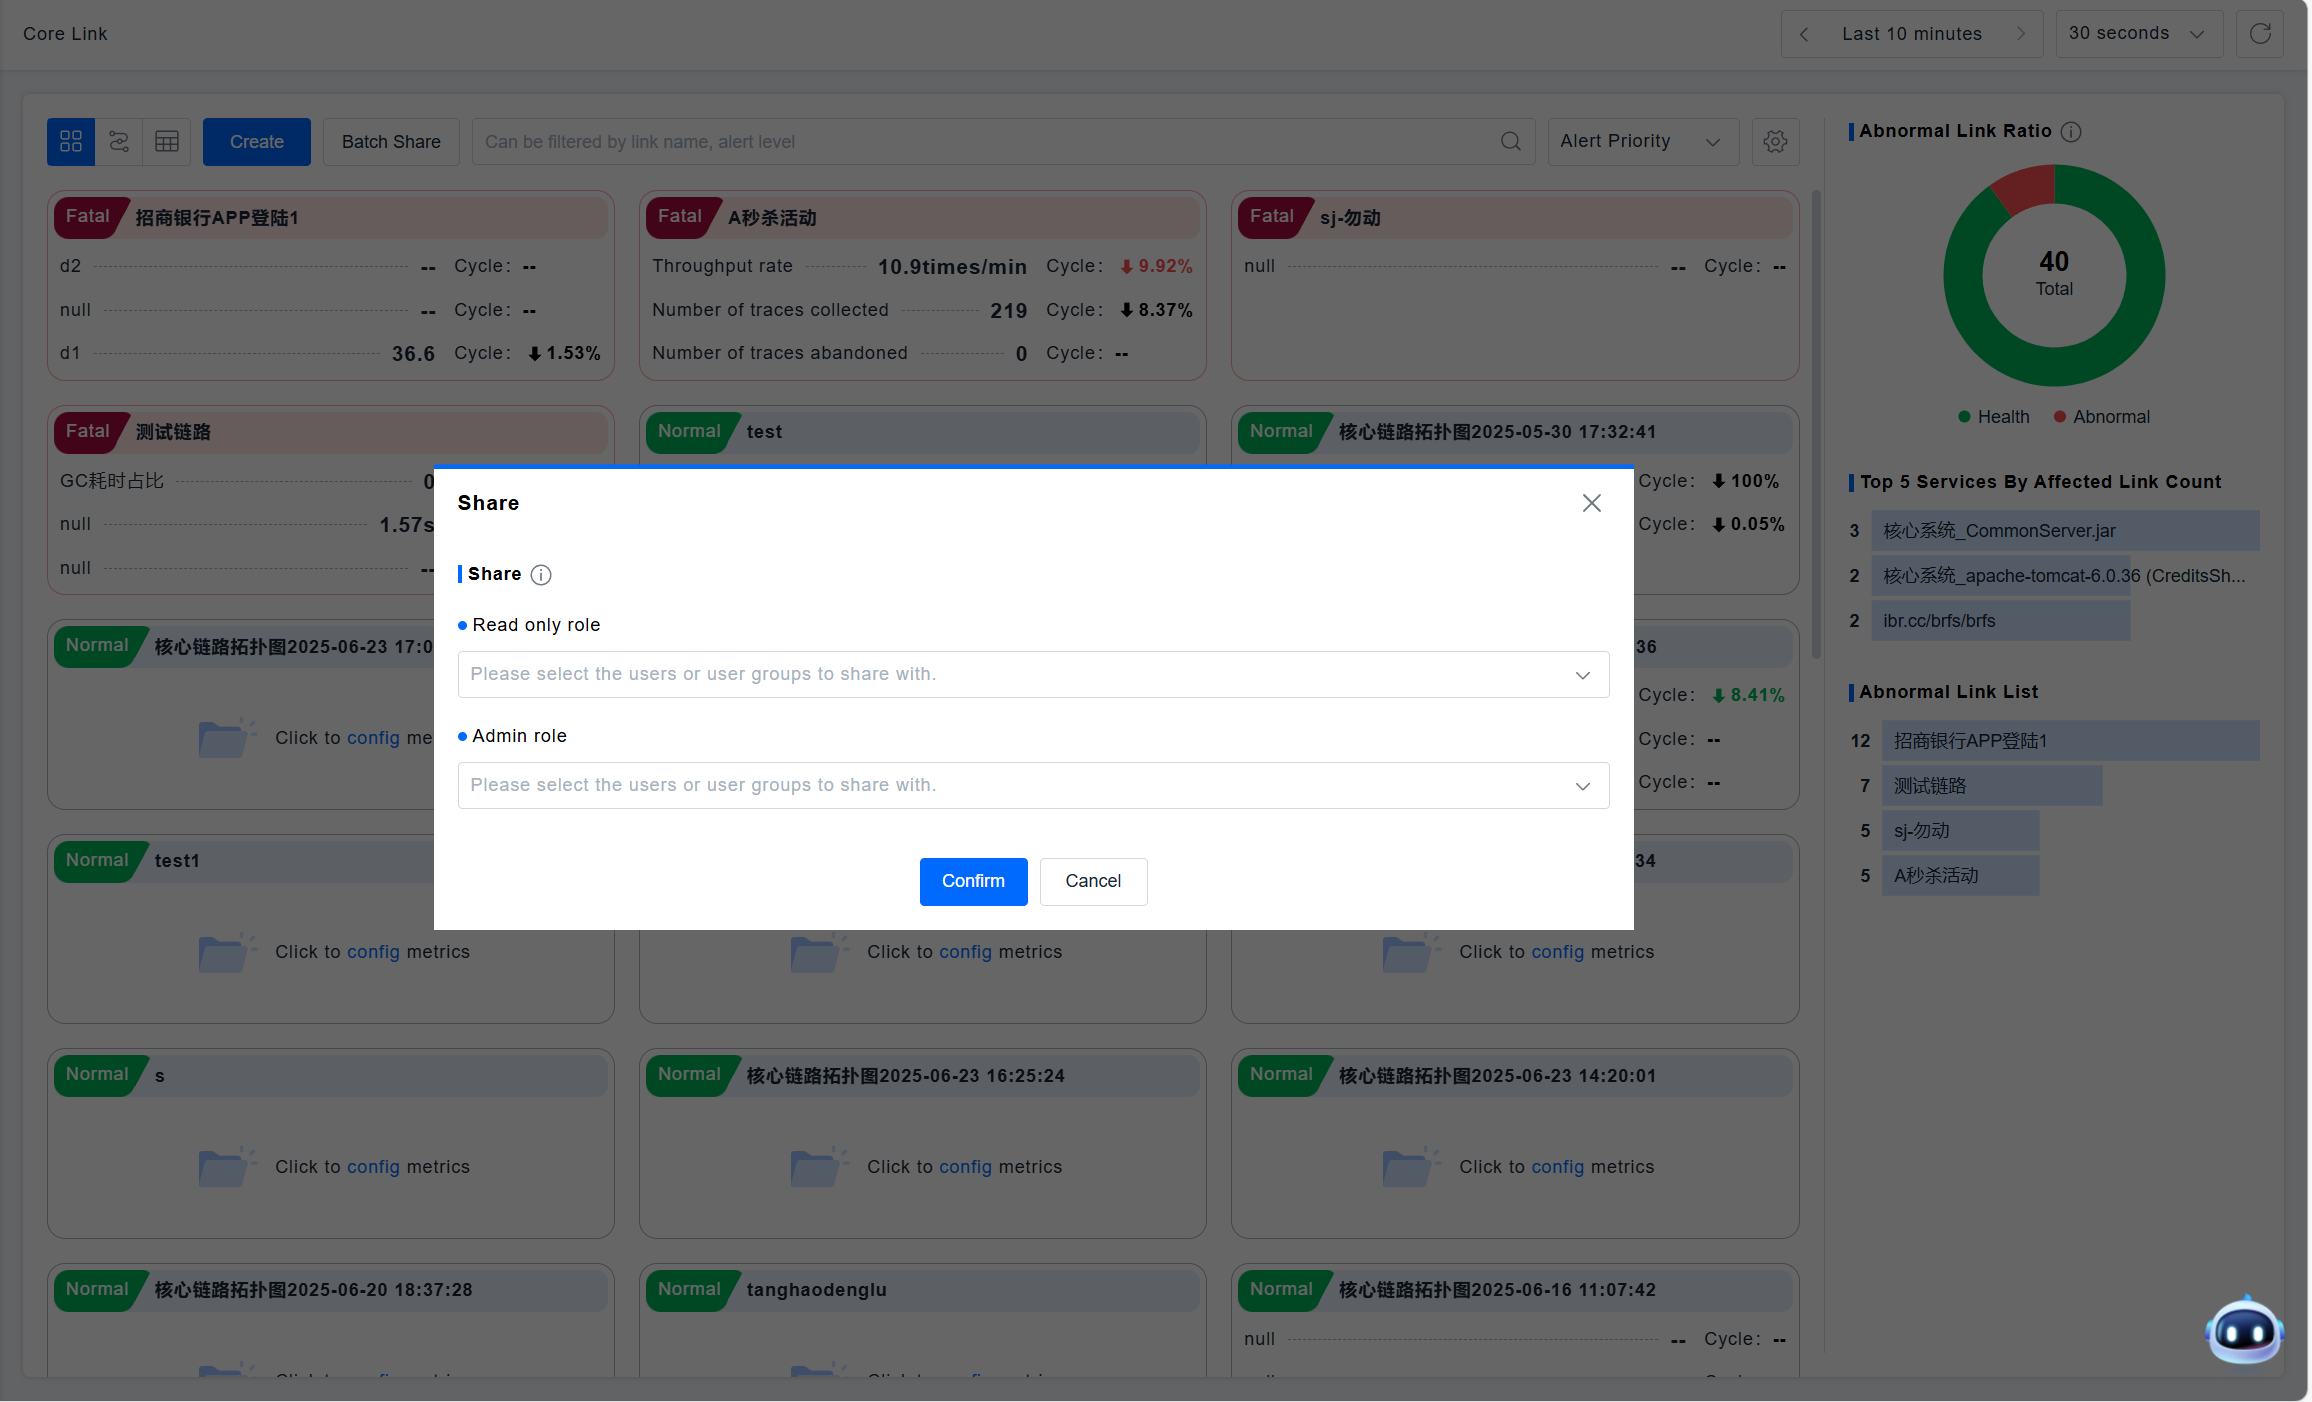
share
The permission scope of business trace cards is divided based on user permissions. In the initial state, users can only view the business traces created by themselves; after sharing, users can additionally view the shared business traces. Sharing permissions are classified into edit permission and read-only permission: with edit permission, the shared user can edit the business trace; with read-only permission, the user only has the viewing function. The specific steps are as follows:
- Click the edit icon of the business trace card. Editing is available in list/topology/statistics views.
- Click the "Share" button.
- Select the user or user group to share with.
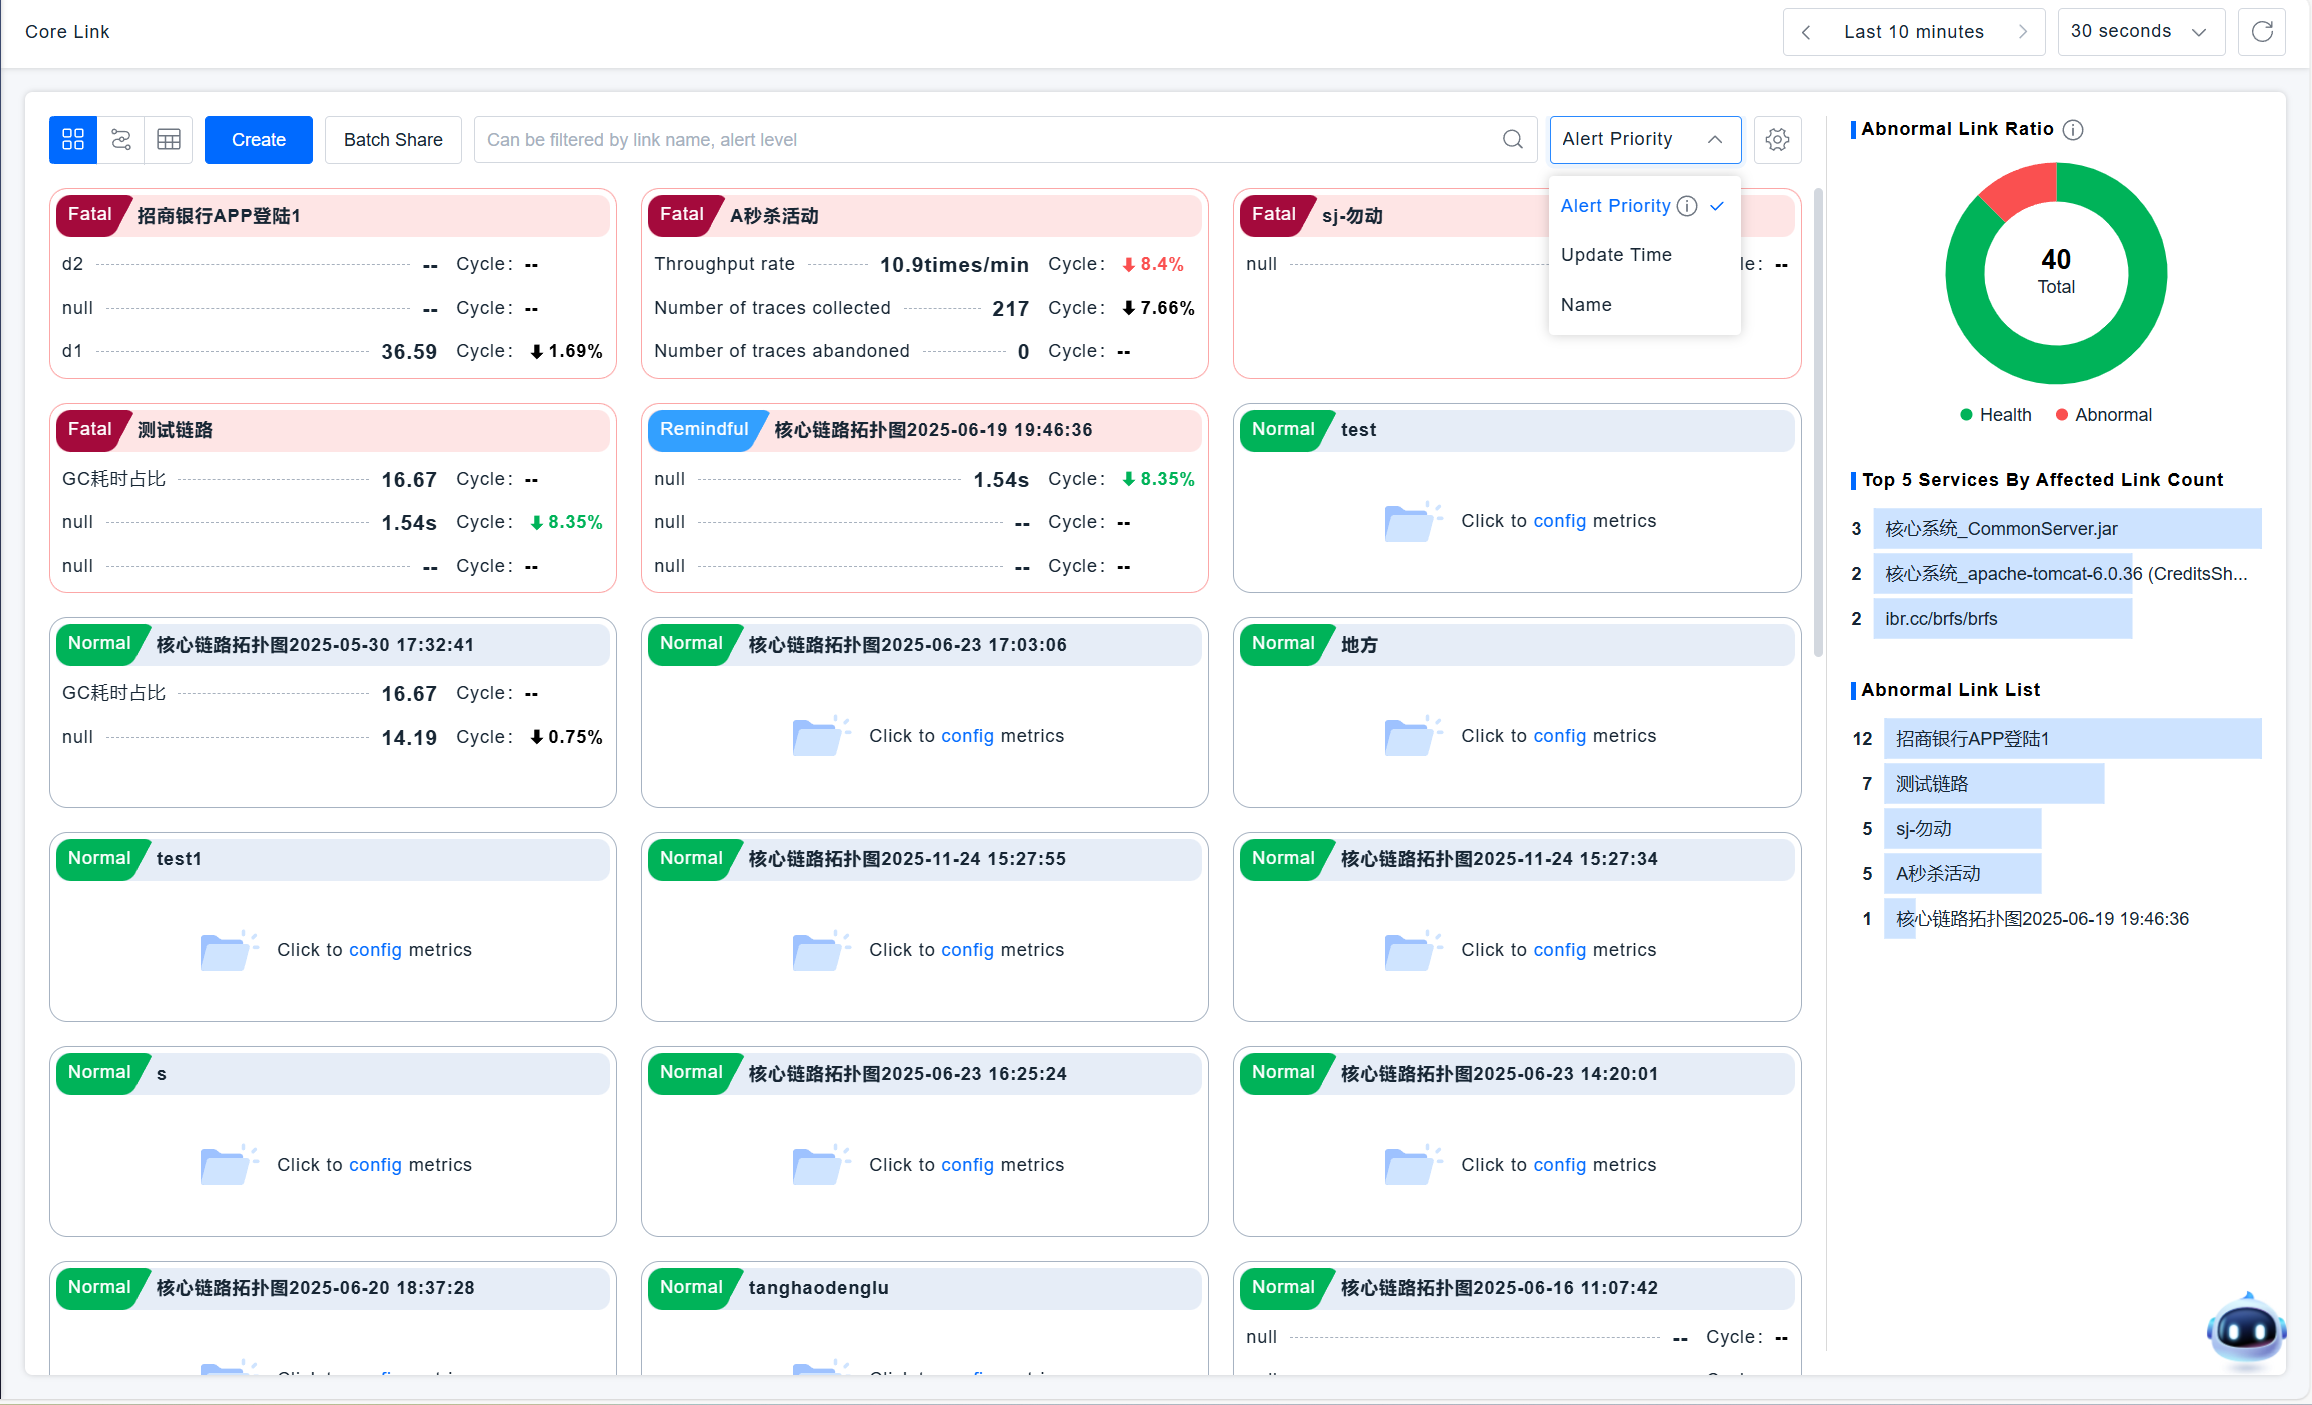
Sorting
business traces support specifying card sorting methods in statistics/topology/list modes. The specific operation steps are as follows:
- Click the sorting icon.
- Select the sorting rule.
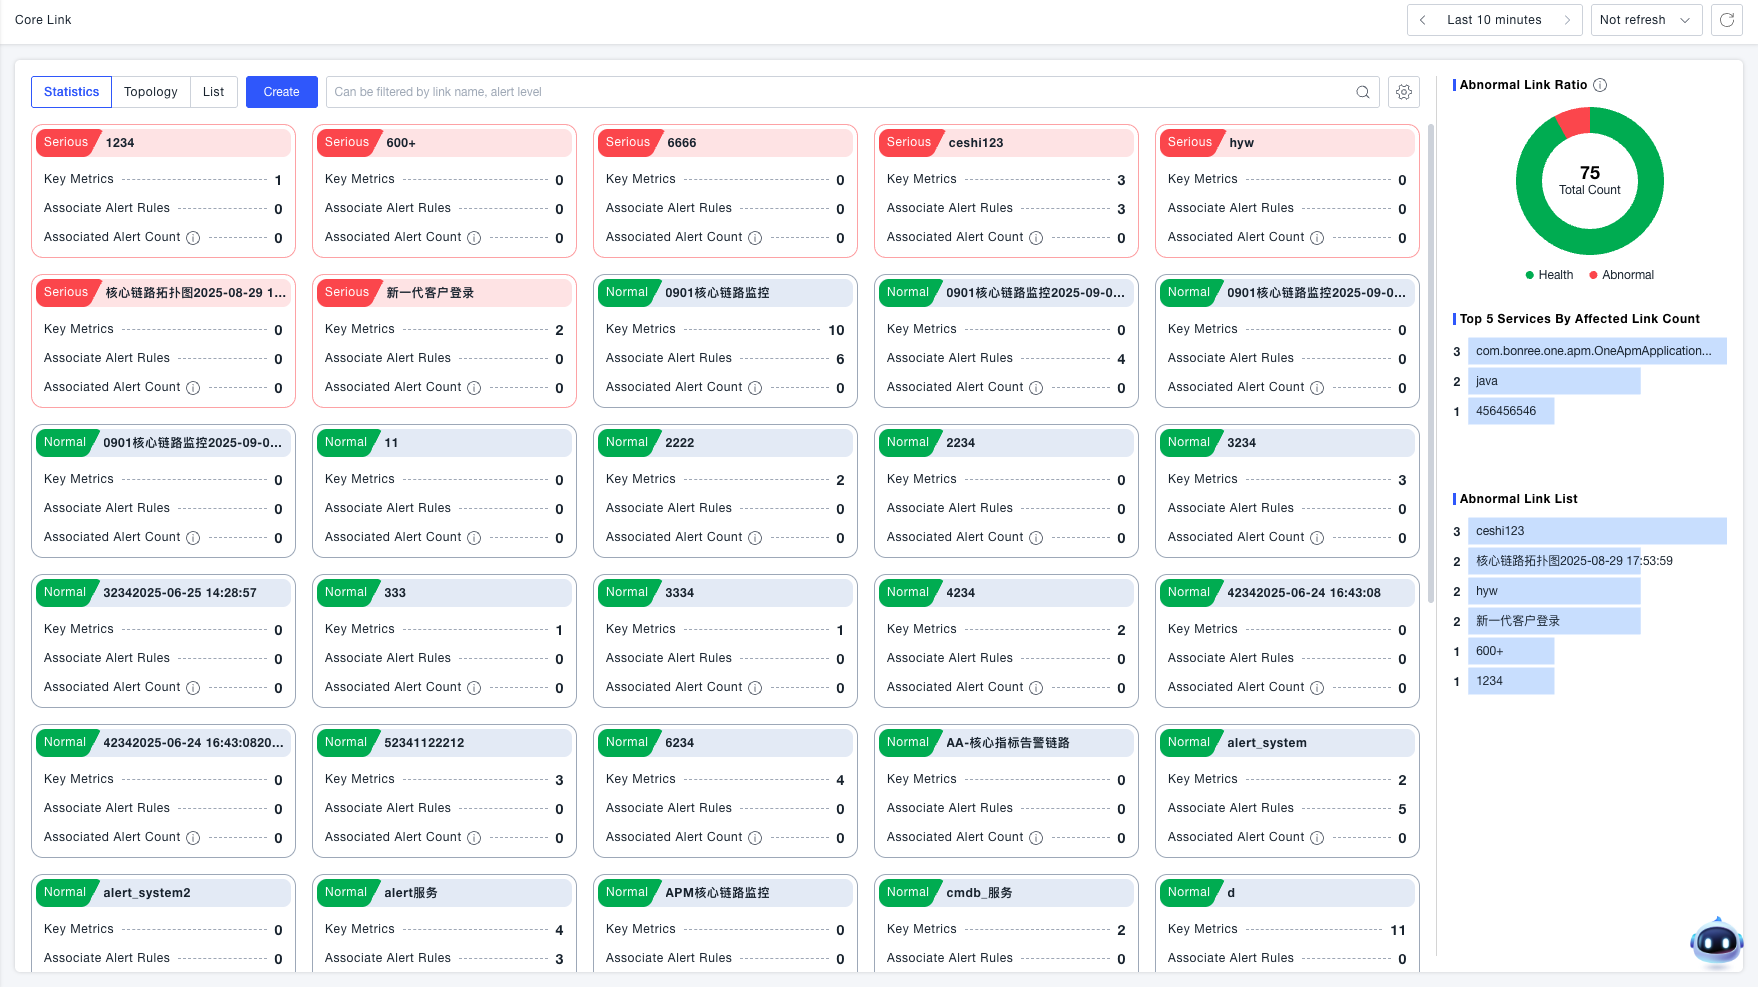
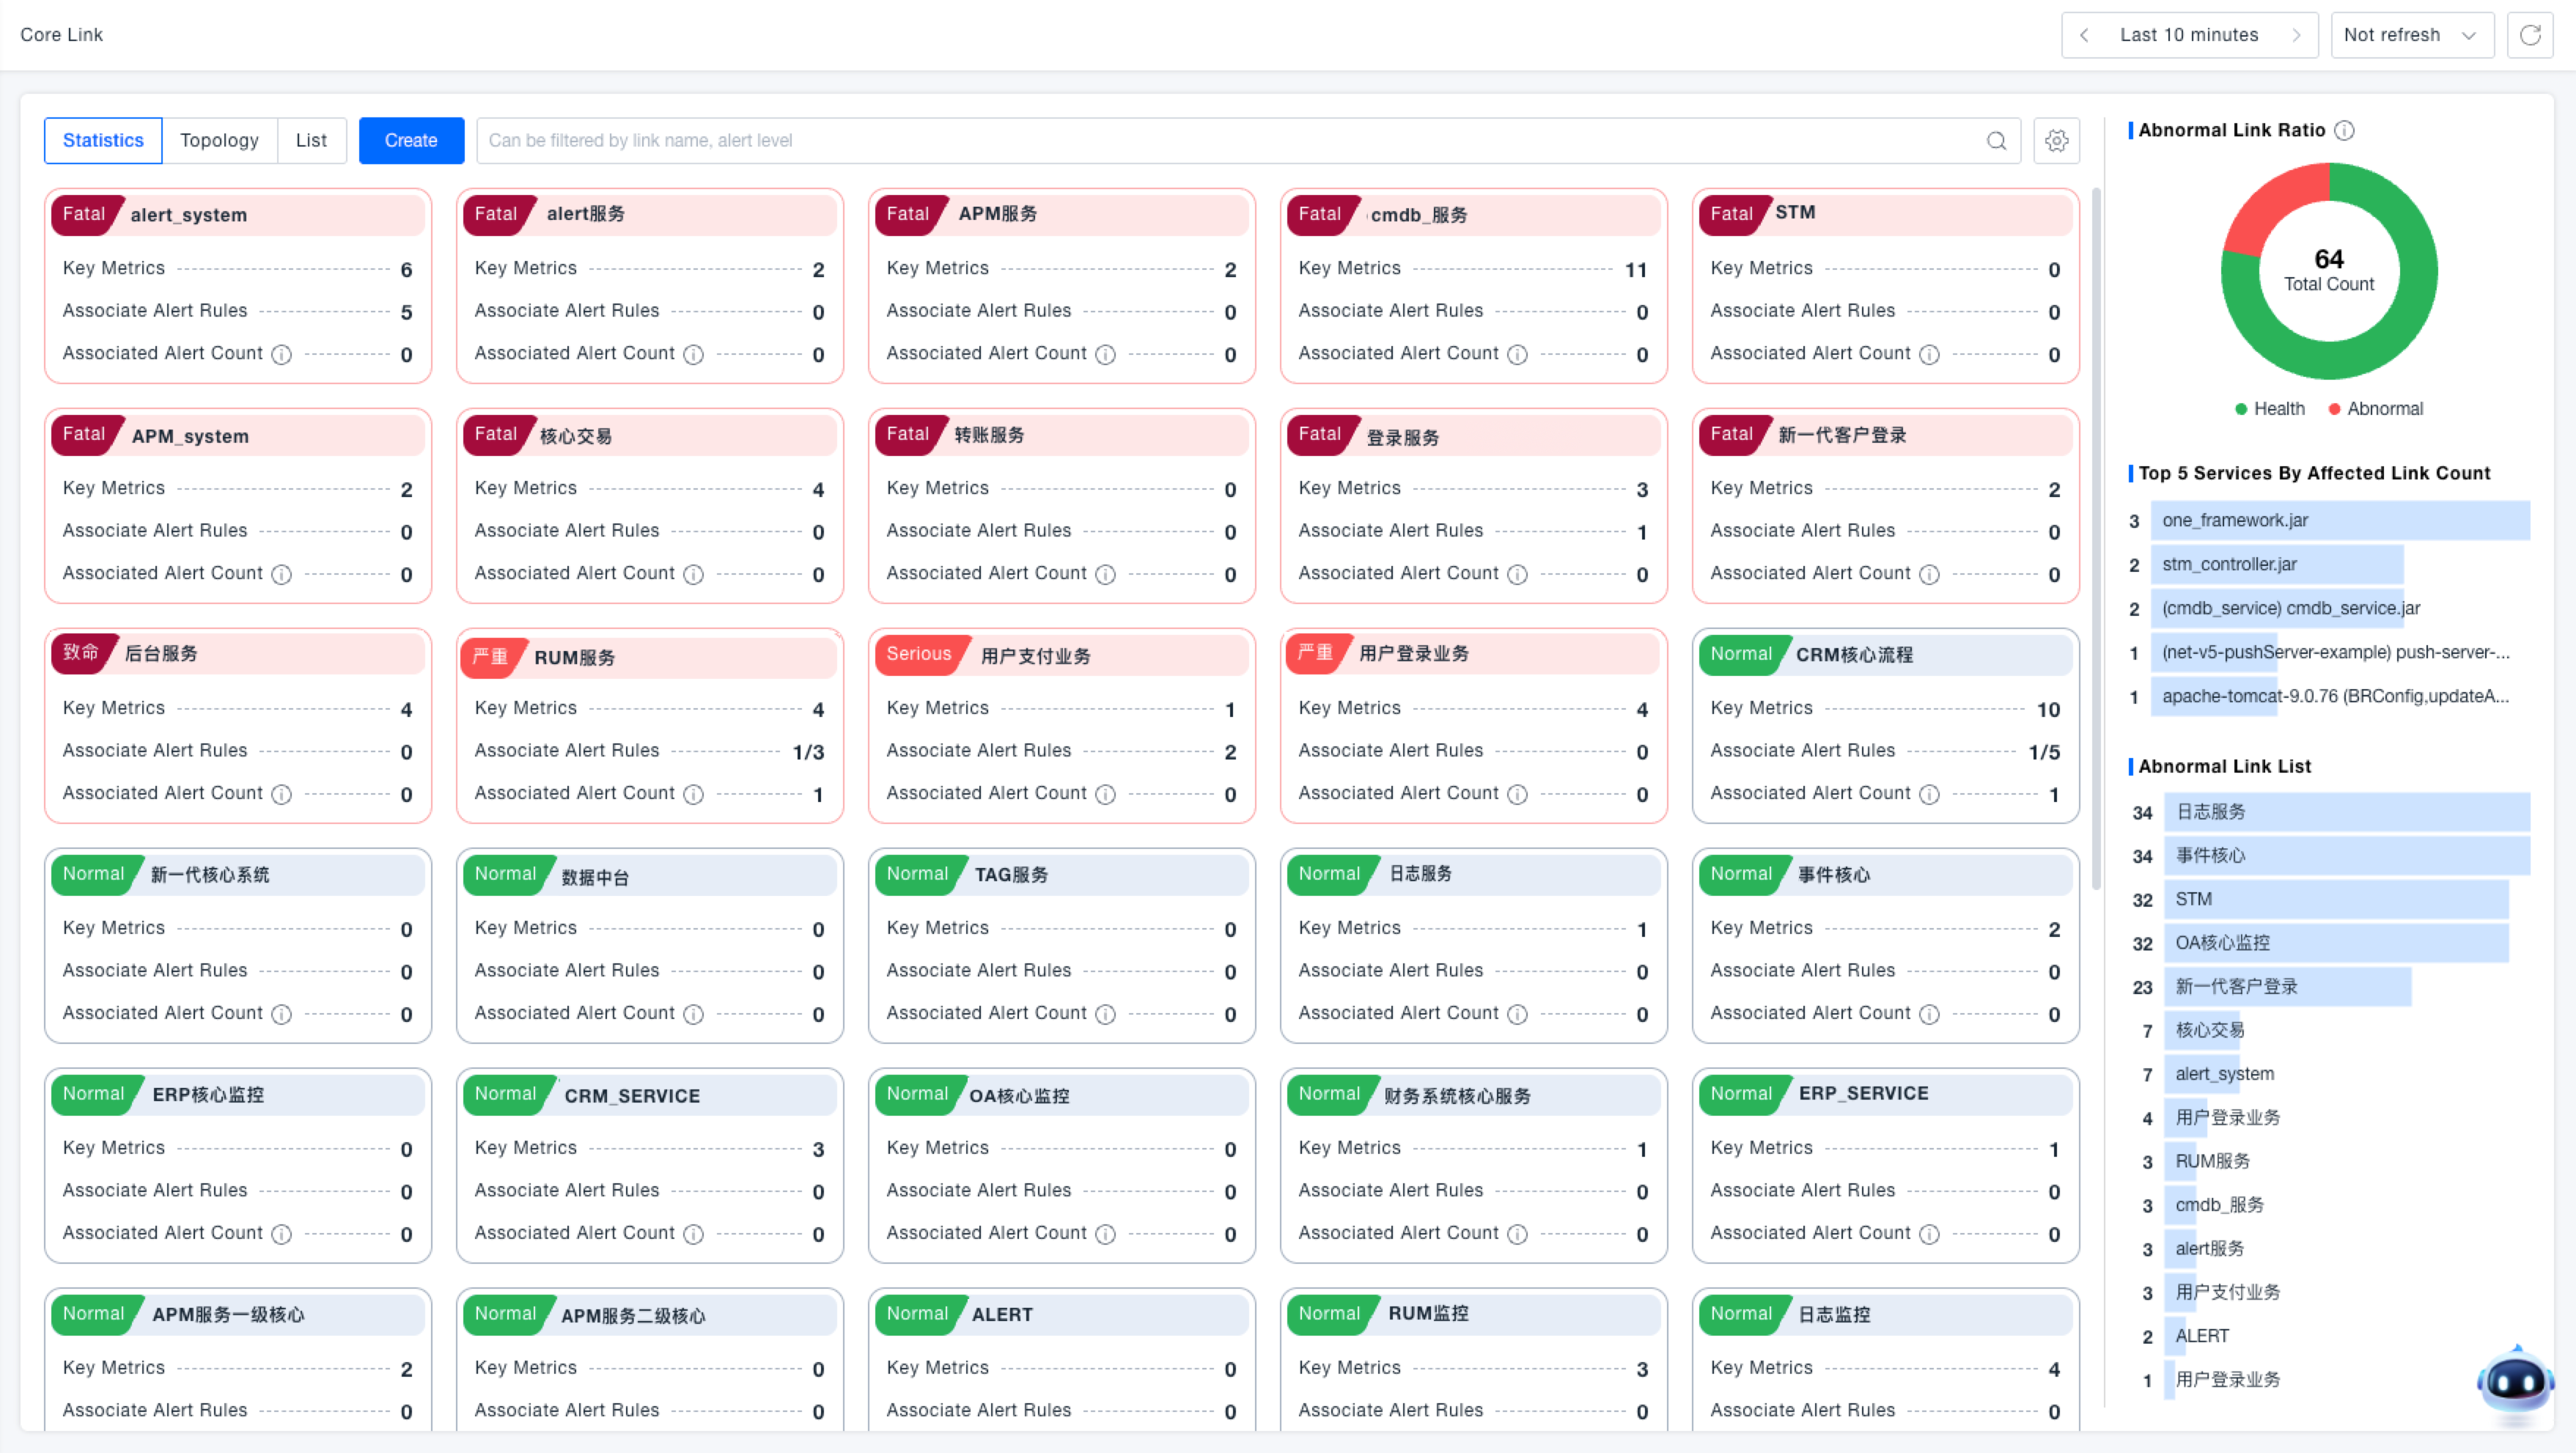
Statistical View
Displays all created core business flows as cards. Monitor the status of core flows based on card color, alert indicators, key metrics, associated alert rules, and alert counts. Supports editing, cloning, configuring key metrics, associating alert rules, and deleting core business flows.
Abnormal Status Configuration: Click the configuration icon next to the filter bar to define which alert severity levels constitute an 'abnormal' state based on business needs. Available alert severities include: Critical, Severe, Warning, Info, and Notice. Manually select the severity levels to be considered abnormal (at least one level must be selected). This configuration controls both the visual rendering of core flows and the scope of alert queries. For example: If only the 'Critical' severity is selected as abnormal, then only alerts of Critical severity will cause a core flow to be rendered as abnormal; all other severities will be considered normal.
Alert Query Scope: Based on the configured abnormal status, the system queries all alerts related to entities associated with the current core business flow. This result is used for the visual rendering and alert tagging of the core flow.
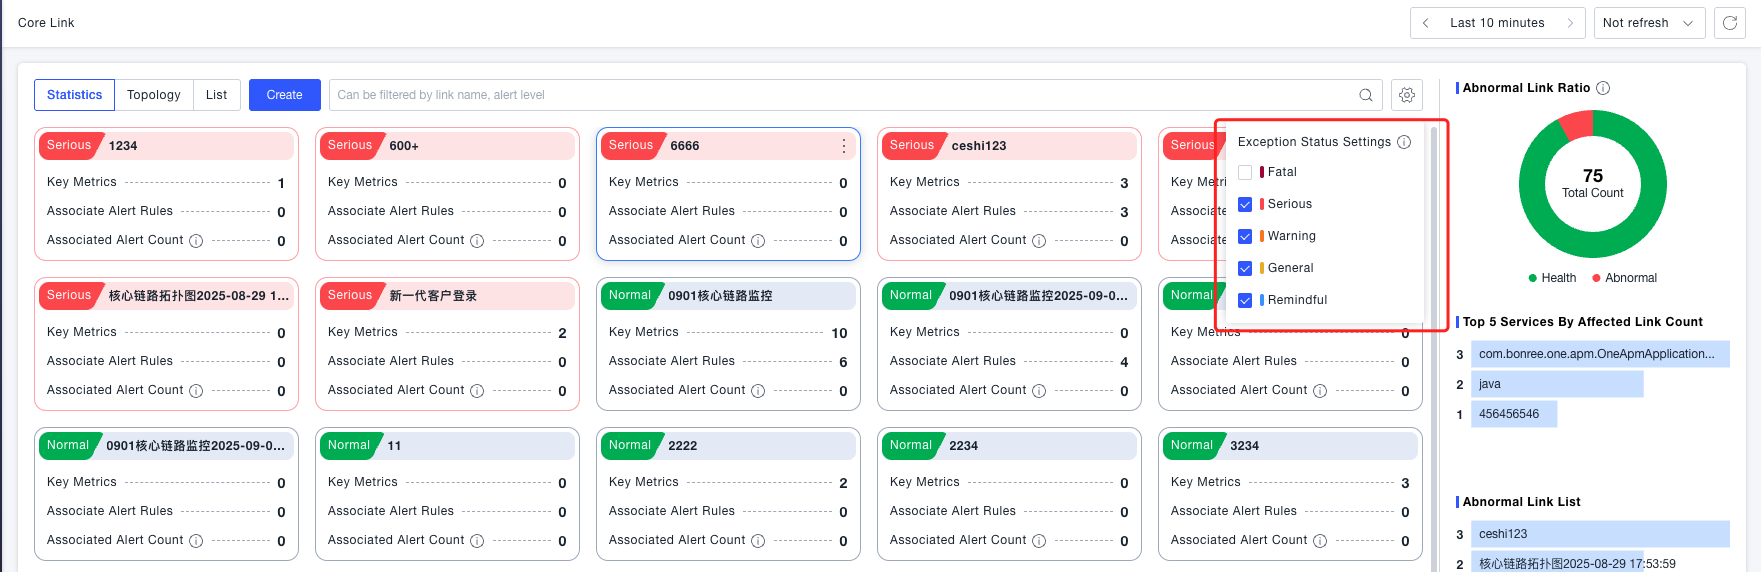
- Card Color: Cards in an abnormal state are rendered red, while cards in a normal state are gray.
- Alert Indicator: The highest severity alert level for the abnormal core flow is displayed in the top-left corner of the card.
- Key Metrics: Click the edit button in the top-right corner of a card and select 'Configure Key Metrics' to define key business indicators for the current core flow.
- Associated Alert Rules: Click the edit button in the top-right corner of a card and select 'Associate Alert Rules' to link alert rules to the current core flow. Click the 'Associated Alert Rules' link on the card itself to view all linked rules.
- Associated Alert Count: This count represents the number of active alerts triggered by the alert rules associated with the core flow. Click the 'Associated Alert Count' on the card to view details for all triggered alerts.
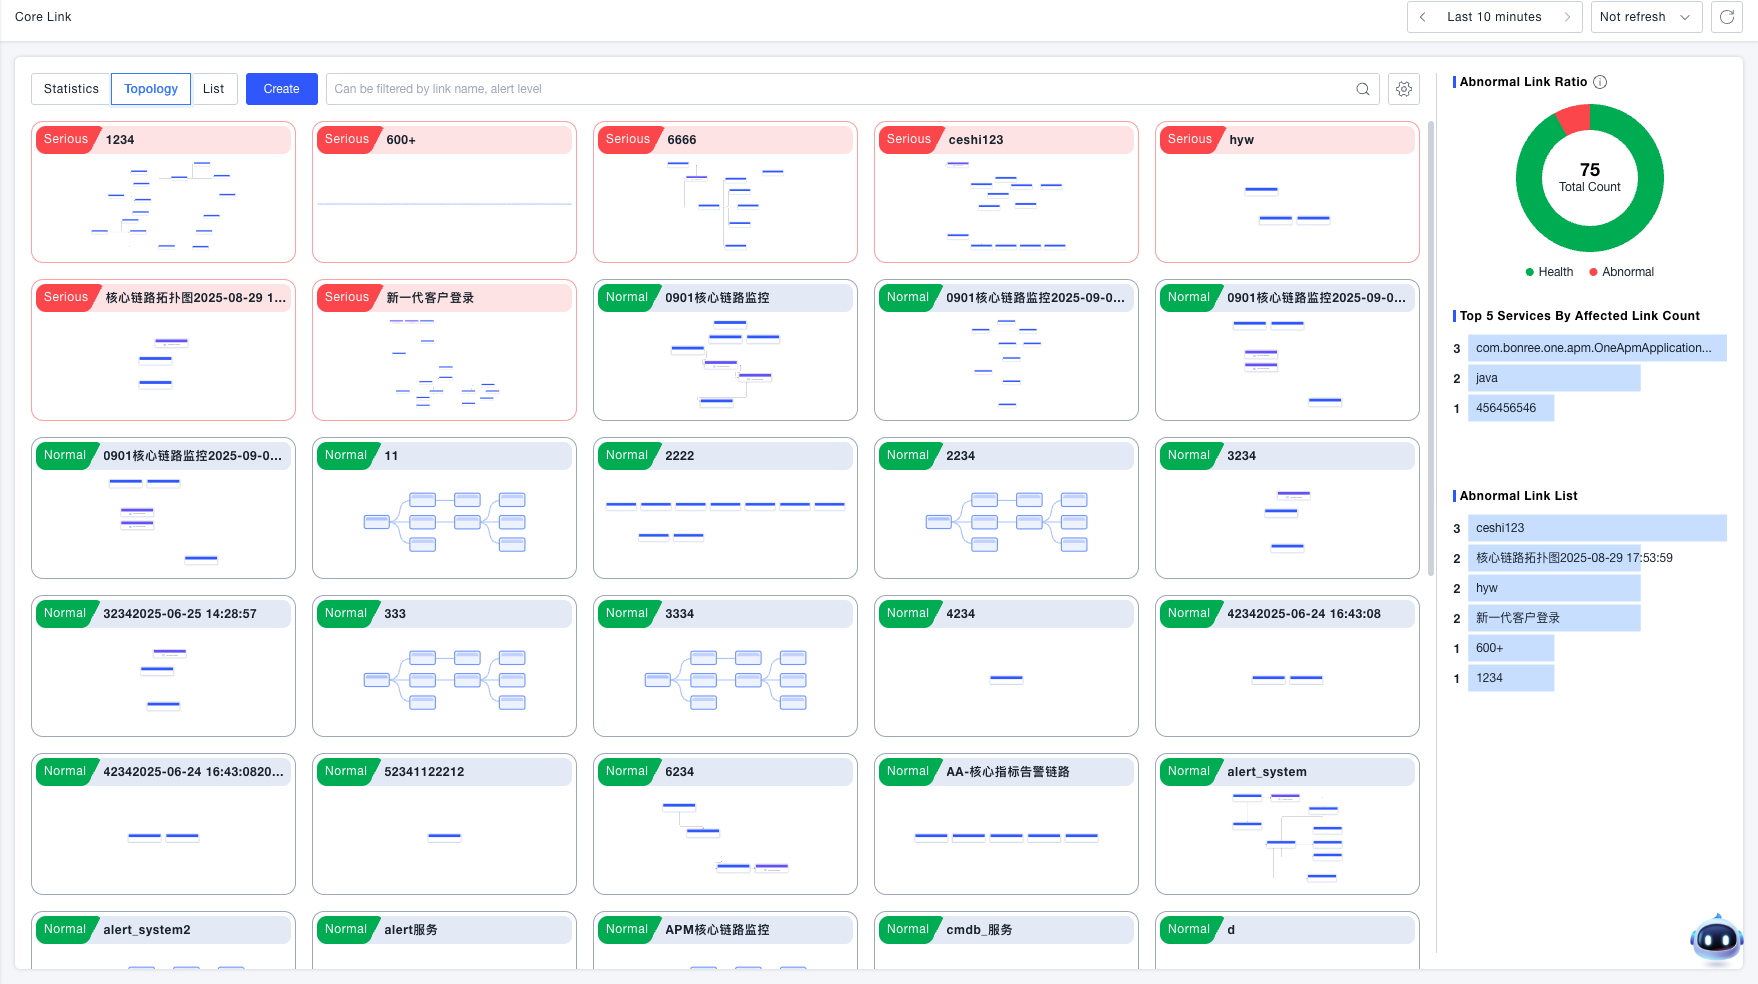
Topology View
Displays all created core business flows as topology cards. For flows that have been orchestrated, a thumbnail of the current topology is shown. The rendering logic (colors, indicators) is the same as in the Statistical View. Supports editing, cloning, configuring key metrics, associating alert rules, and deleting core business flows.
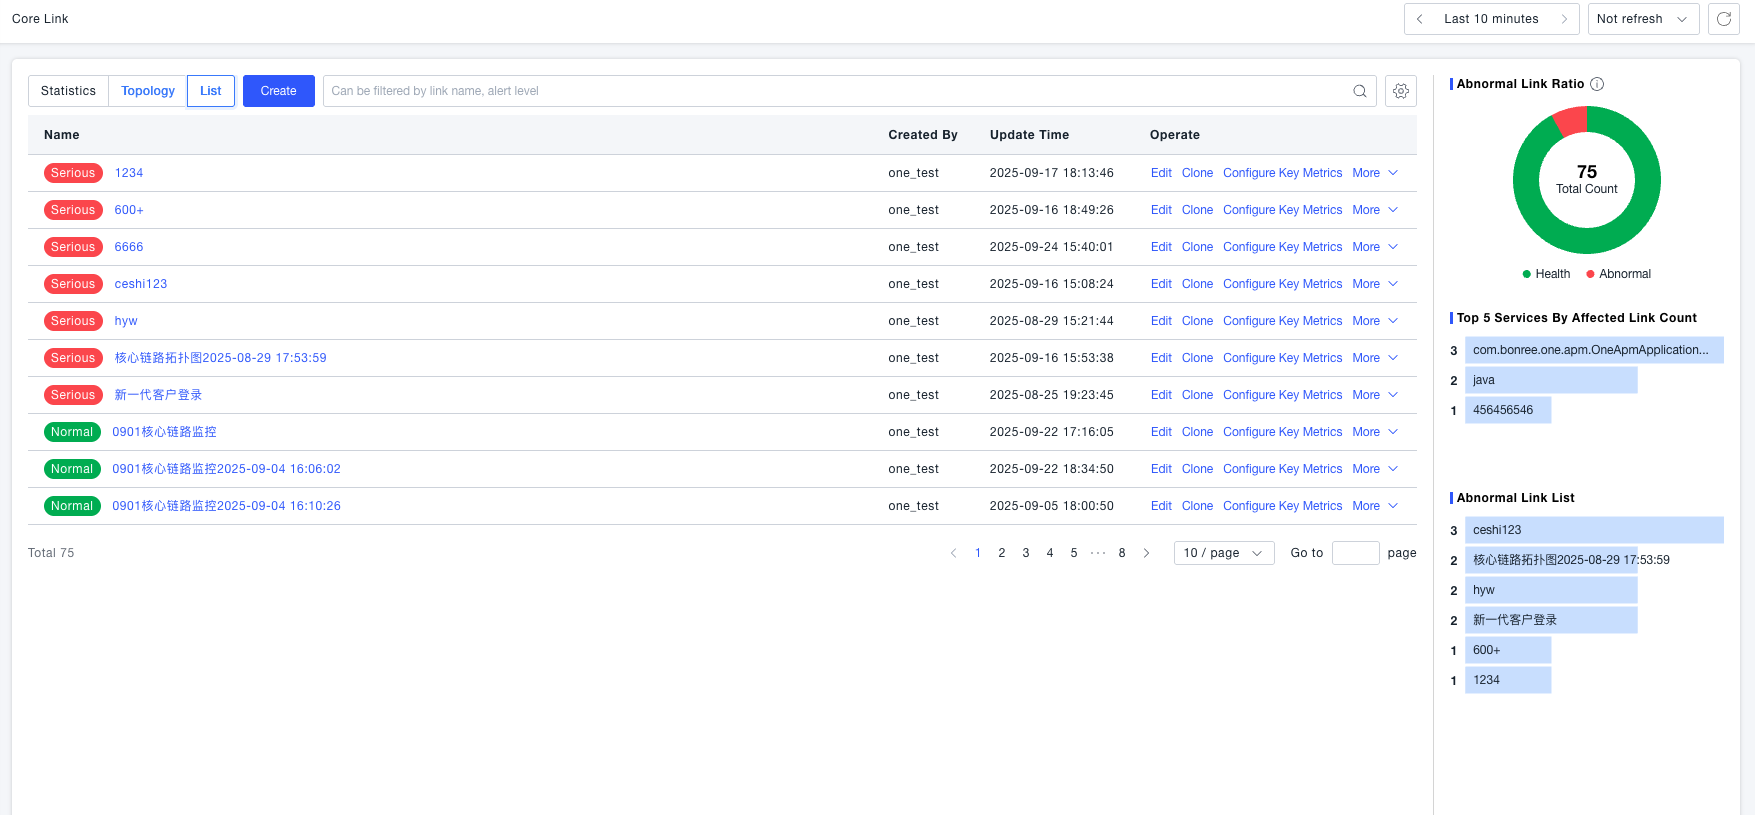
List View
Displays all created core business flows in a list format, showing the current alert status for each flow. Supports editing, cloning, configuring key metrics, associating alert rules, and deleting core business flows.
Identify Issues (Using the Statistical View as an example)
Quickly identify anomalous flows based on alert rendering. Follow these steps:
- Navigate to the Observability & Insights -> Core Business Flows page.
- Identify core business flows in an abnormal state based on card color, alert severity level indicators, etc.
- Refer to the "Abnormal Flow List" and "Top 5 Flows Impacted by Service异常" charts to help assess the incident impact scope.
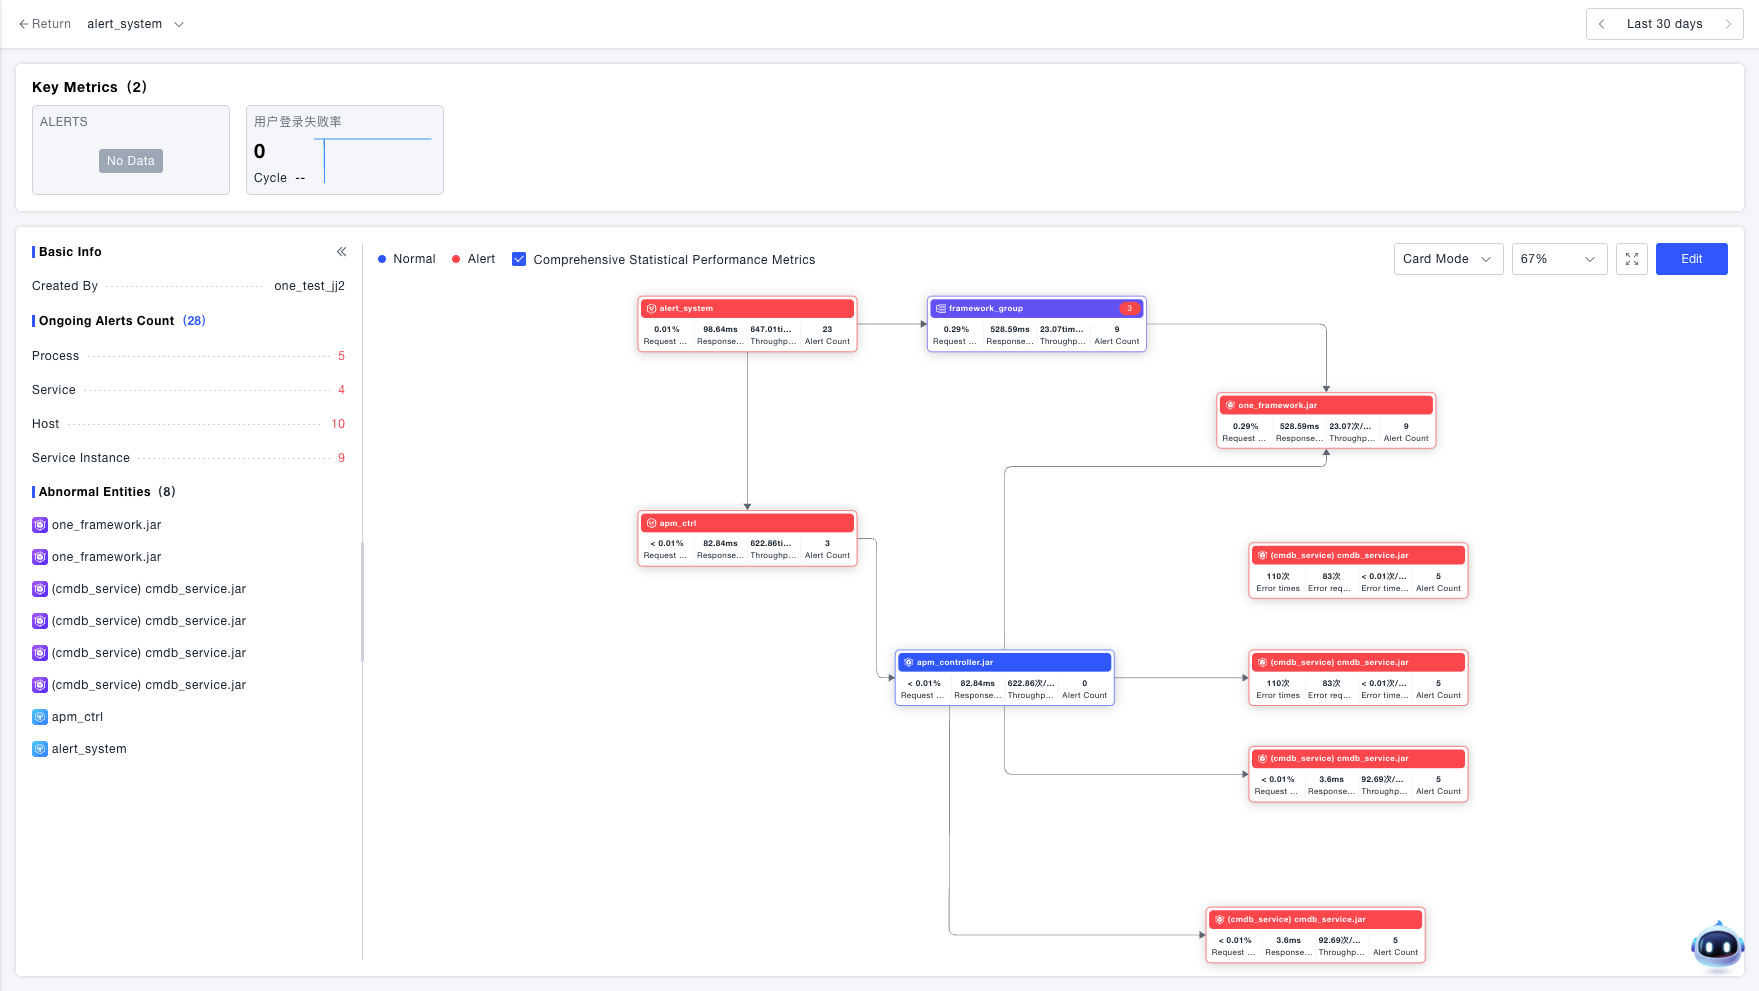
Drill-Down and Locate
Locate the nodes causing the flow anomaly. Follow these steps:
- Select an anomalous core business flow and click its card to enter its details page.
- Review the trend charts of key metrics at the top to confirm anomalies in flow key metrics (e.g., success rate, latency).
- Identify anomalous nodes through the abnormal status displayed on the flow topology.
Additional auxiliary analysis methods:
- Check the list of ongoing alerts associated with the current flow.
- View all anomalous entities for the current flow and click to navigate directly to a specific node.
- Examine the metrics of the nodes within the flow.
Root Cause Investigation (Using a Service Node as an example)
Click on an anomalous node to enter the Flow Node Details page for multi-dimensional data analysis.
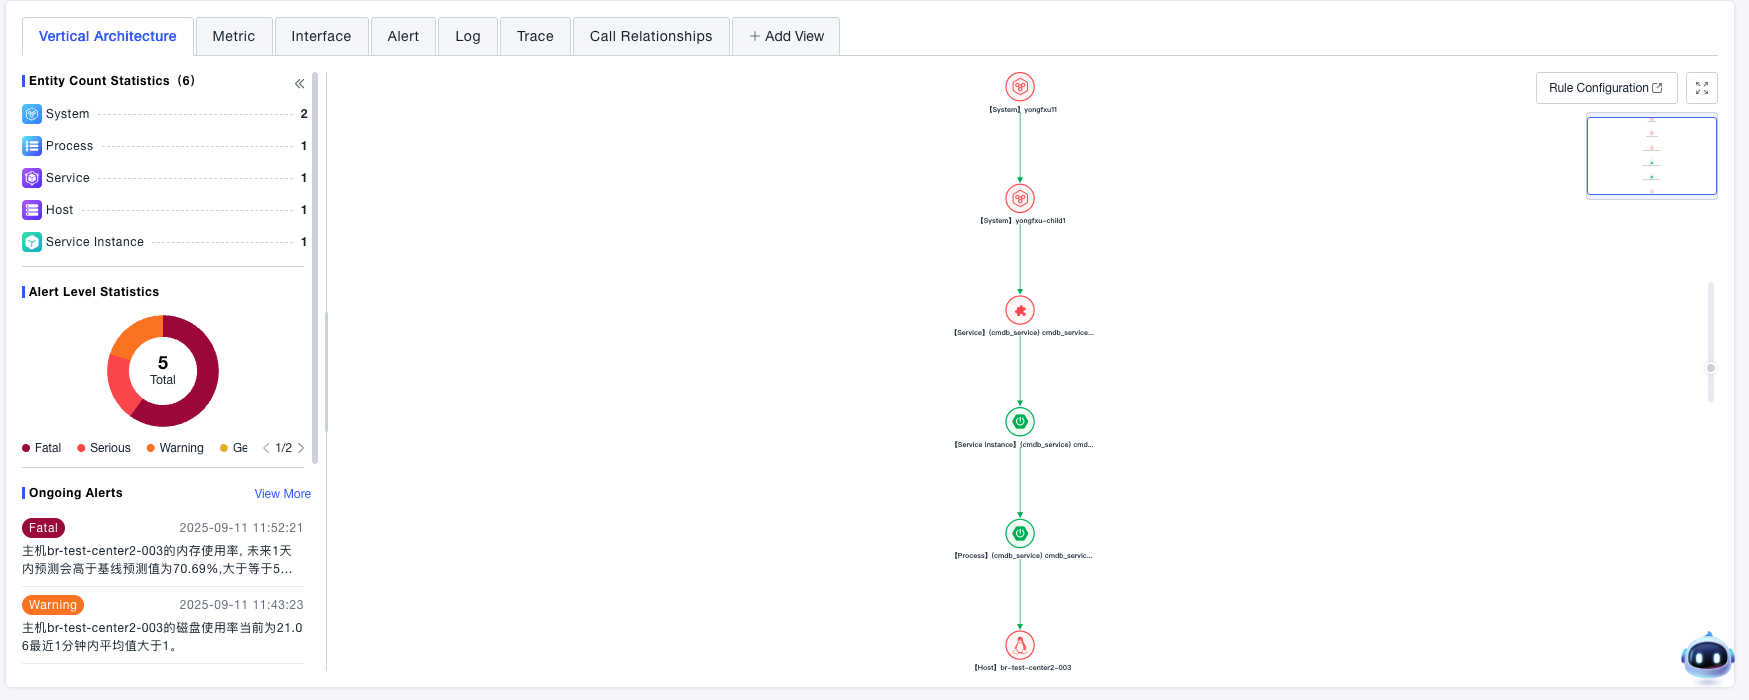
Vertical Application Architecture
Data Statistics
- Count entities associated with the current vertical architecture by entity type.
- Count ongoing alerts for entities related to the current node's vertical architecture; view specific alert details.
- Count entities within the current vertical architecture that are anomalous; click to locate the anomalous entity.
Topology Map Analysis
- Visually inspect the vertical hierarchy relationships of the current node (e.g., System -> Service -> Service Instance -> Process -> Host). Identify anomalous nodes by their color.
- Click on an anomalous node to view its details for in-depth analysis.
- Analyze the metrics, logs, traces, and alerts related to the anomalous node.
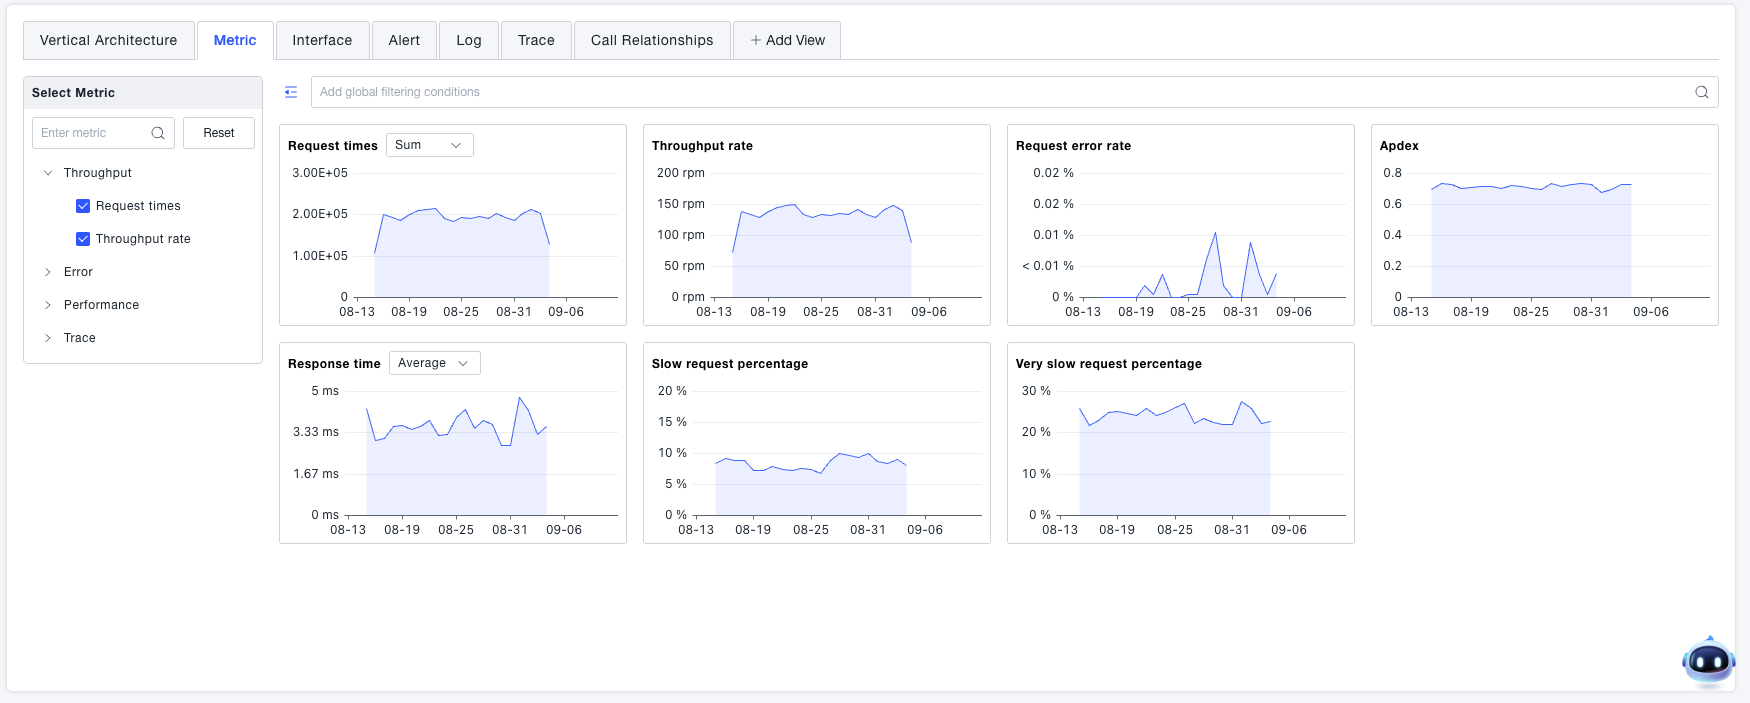
Metrics
View all metrics related to the current service.
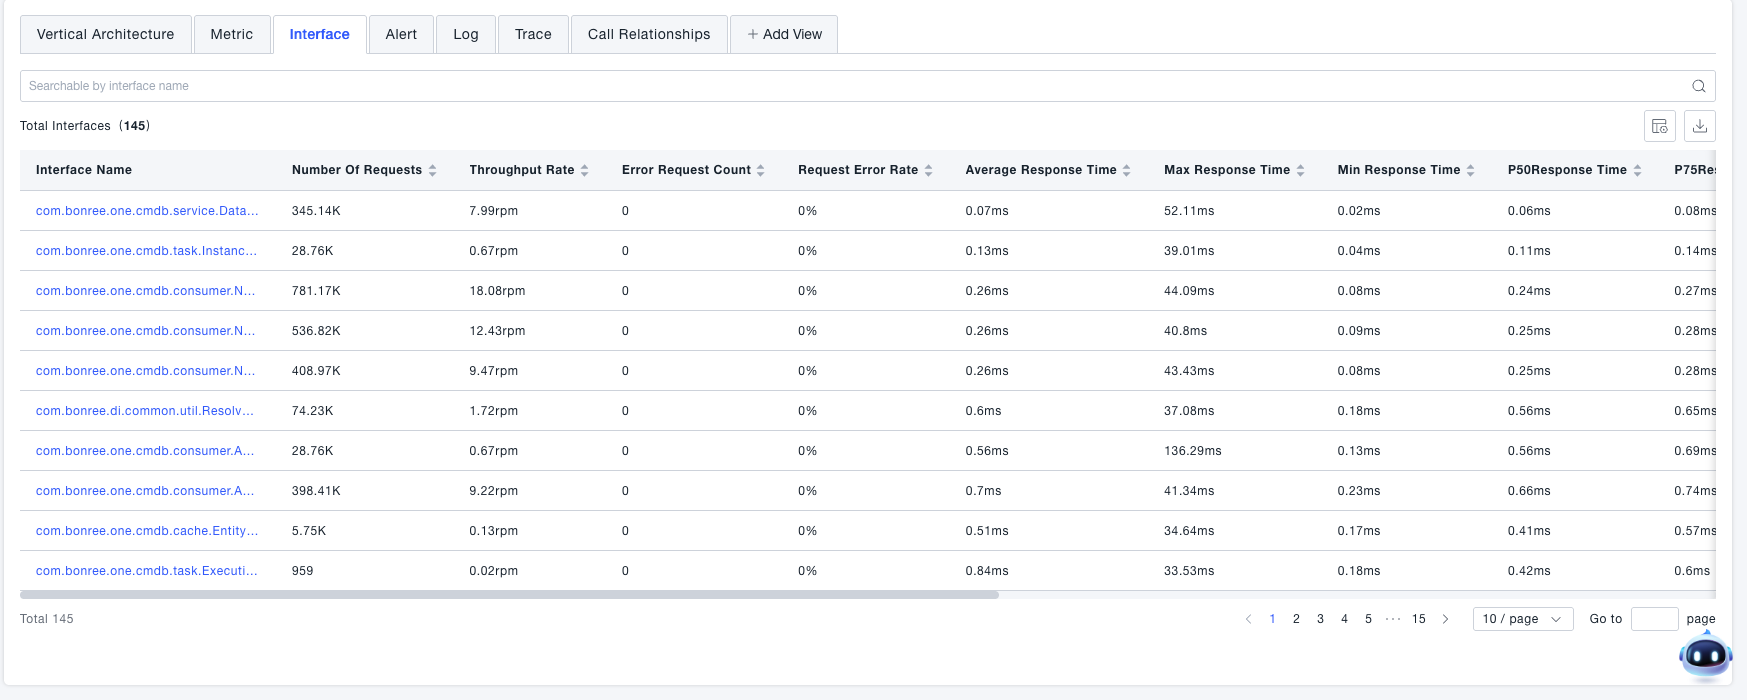
Interfaces
View all interfaces associated with the current service.
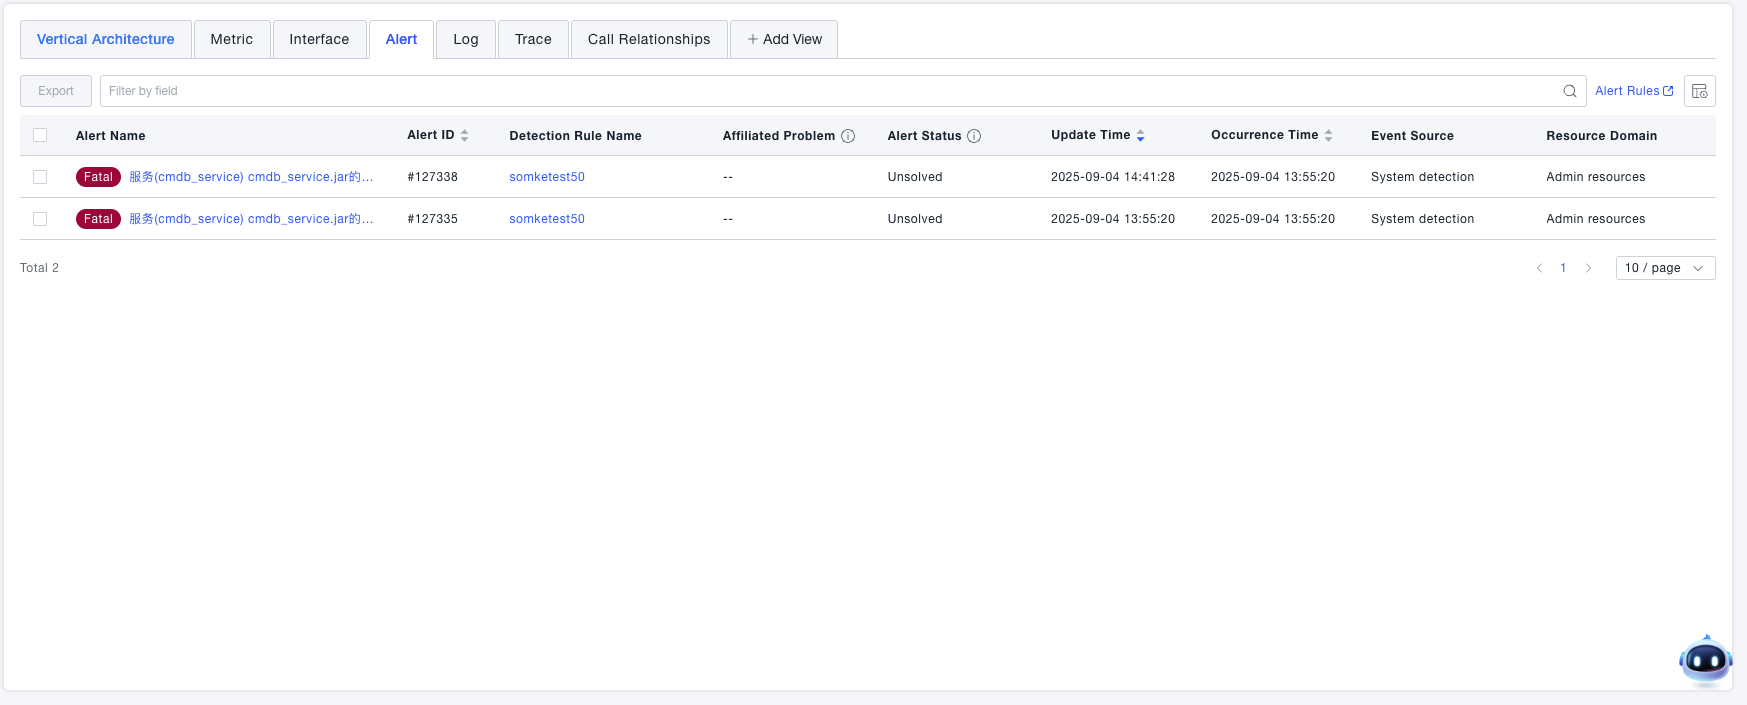
Alerts
View all alerts associated with the current service.
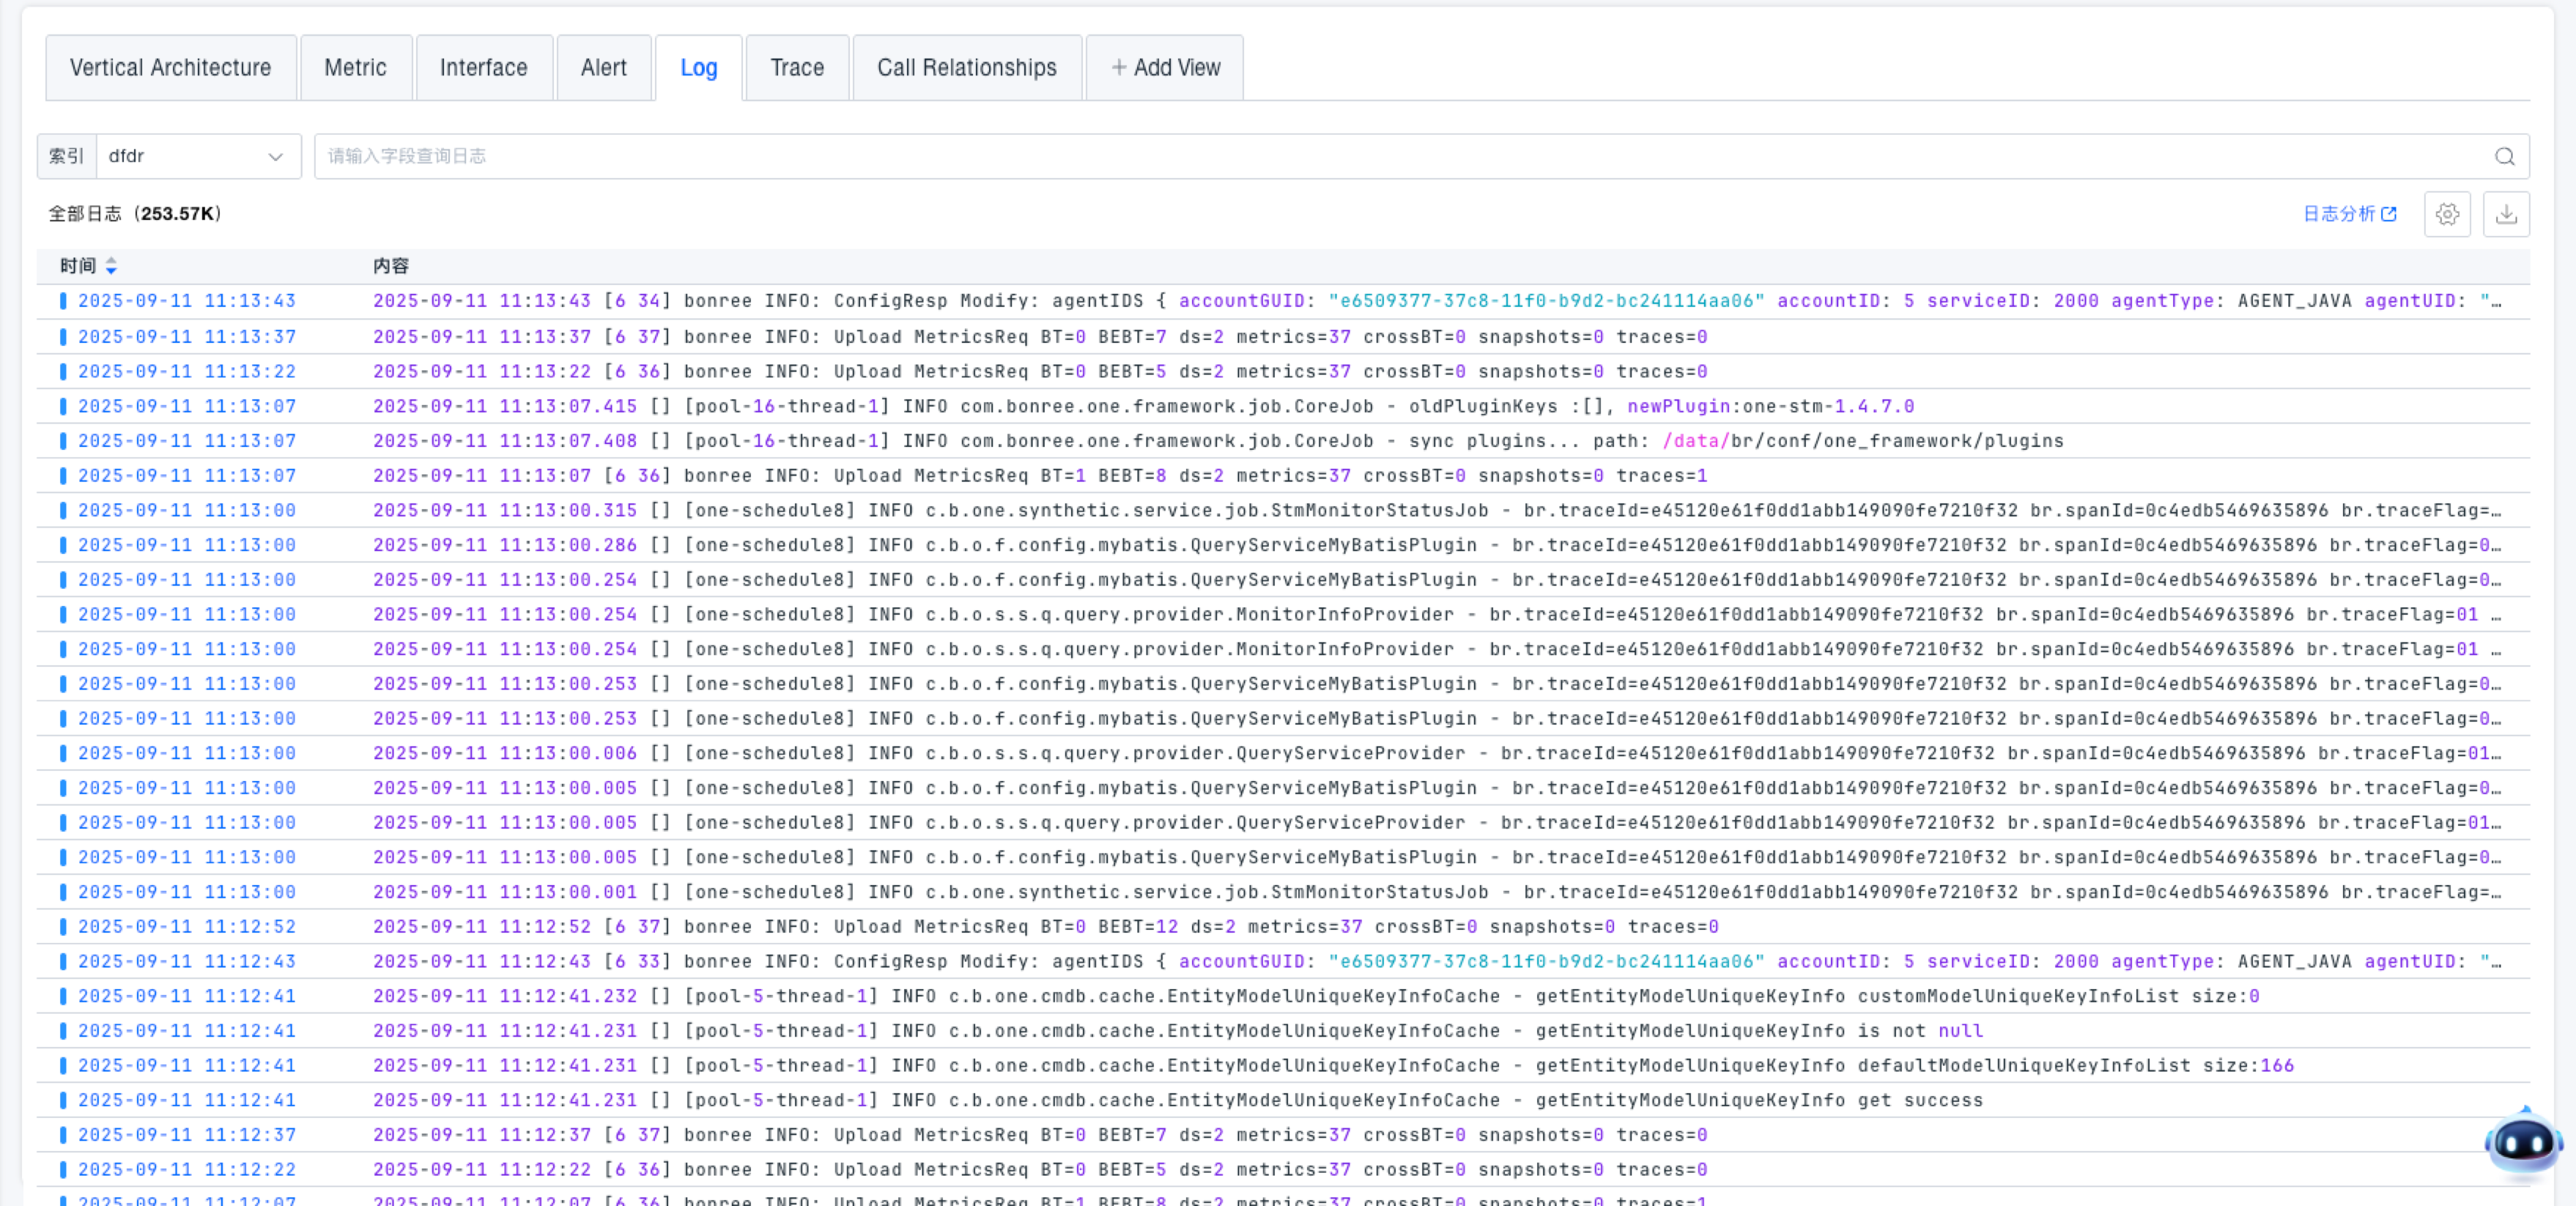
Logs
View all logs associated with the current service.
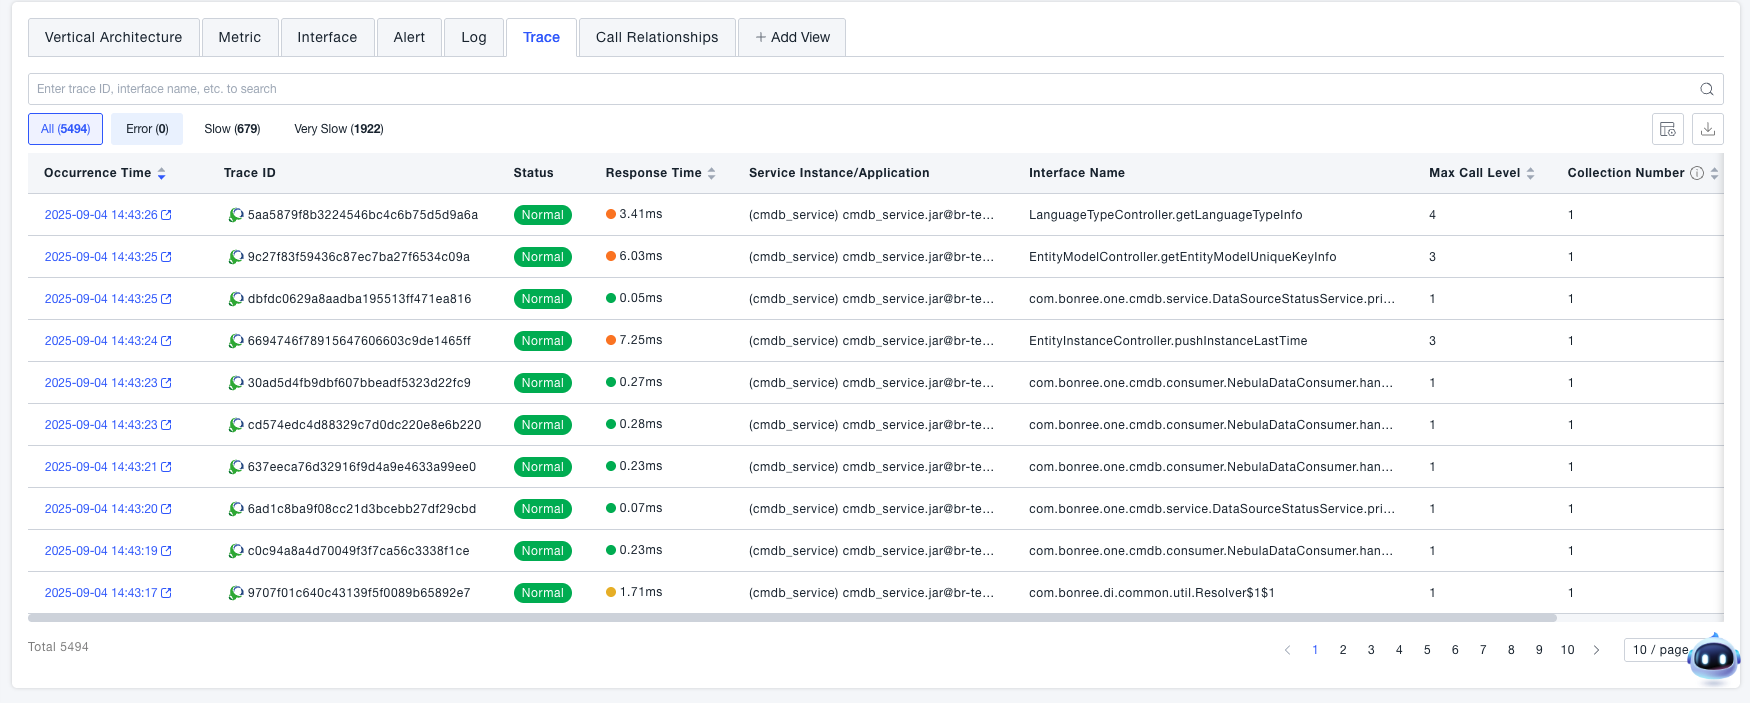
Traces
View all traces associated with the current service.
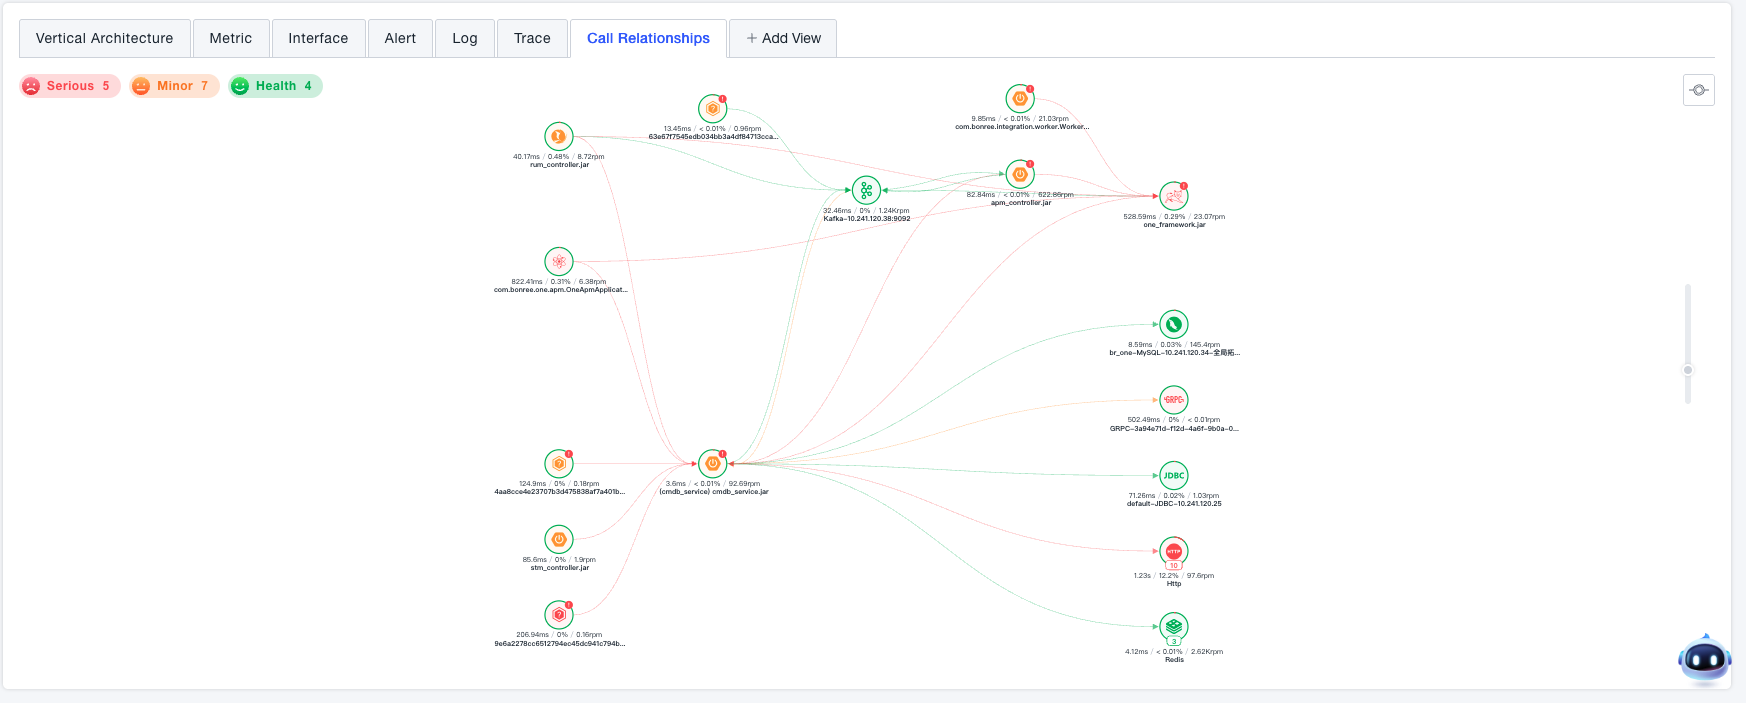
Call Relationships
View the horizontal call relationships of the current service.
Recovery Validation
Based on the step-by-step analysis, locate the anomaly and apply remediation. If the resolution is effective, the abnormal state should clear. Monitor whether the related alerts are closed and if the metric data returns to its normal trend.