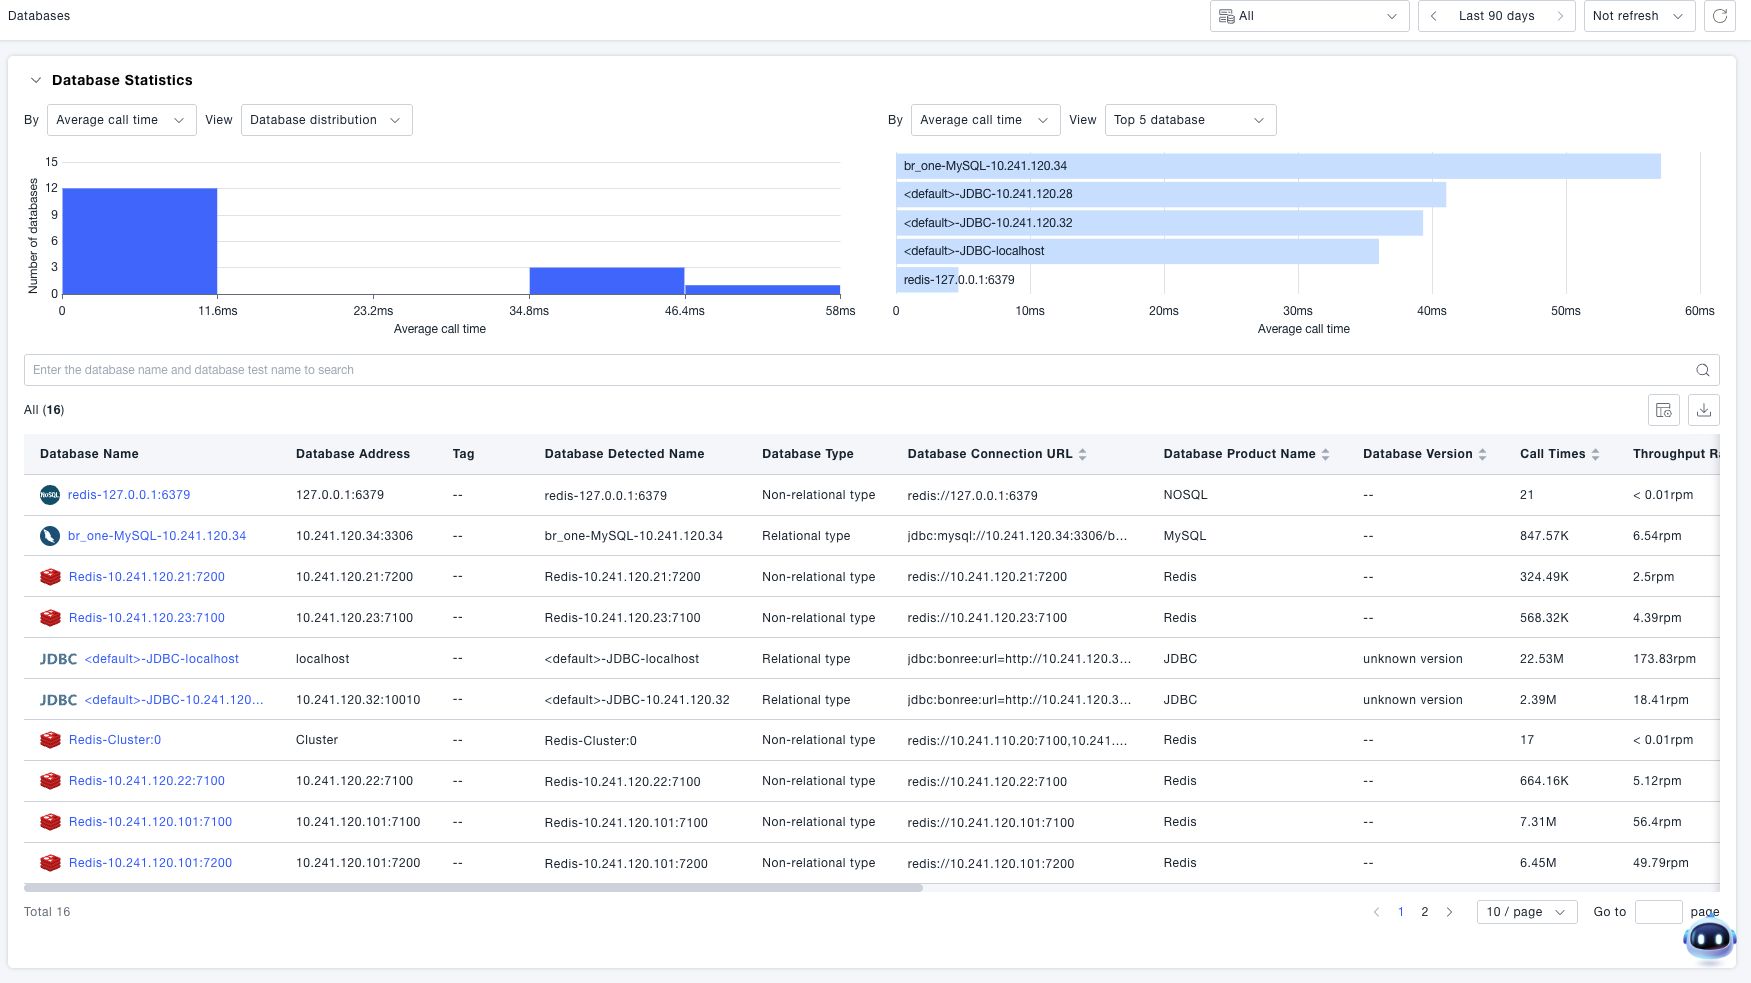
Databases
- Database: Identified through APM based on the pattern: Protocol + Host IP + Port + Database Name. (e.g.,
jdbc:mysql://127.0.0.1:3306/imooc) - Statement: Refers to database statements, including SQL queries for relational databases and query operations for non-relational (NoSQL) databases.
- Connection Pool: The connection pool used by the corresponding database.
Database Analysis
Anomaly Identification
During daily monitoring, operations personnel can analyze metrics such as average call latency, call count, error rate, and error count. By reviewing database distribution charts, Top 5 databases lists, combined with metrics from calling services and alert status, they can quickly identify anomalous databases.
Drill-Down Analysis
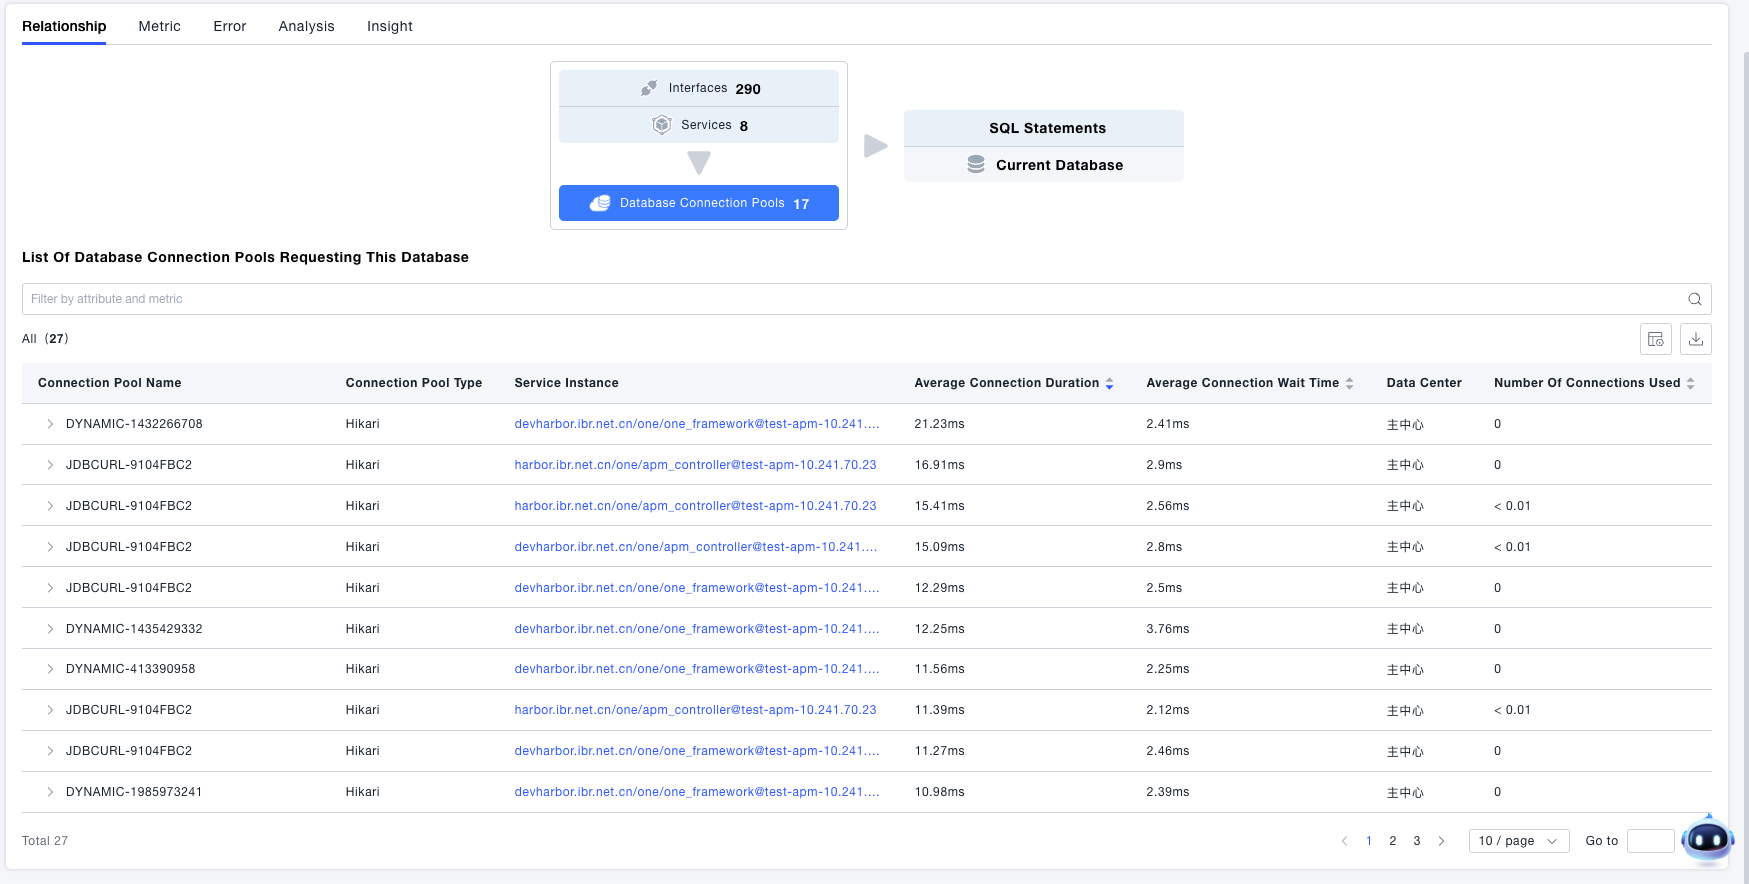
Provides functionality to view database relationships, metrics, errors, analysis, and insights. You can analyze database performance and status by examining horizontal/vertical relationships, metric data, and platform insights.
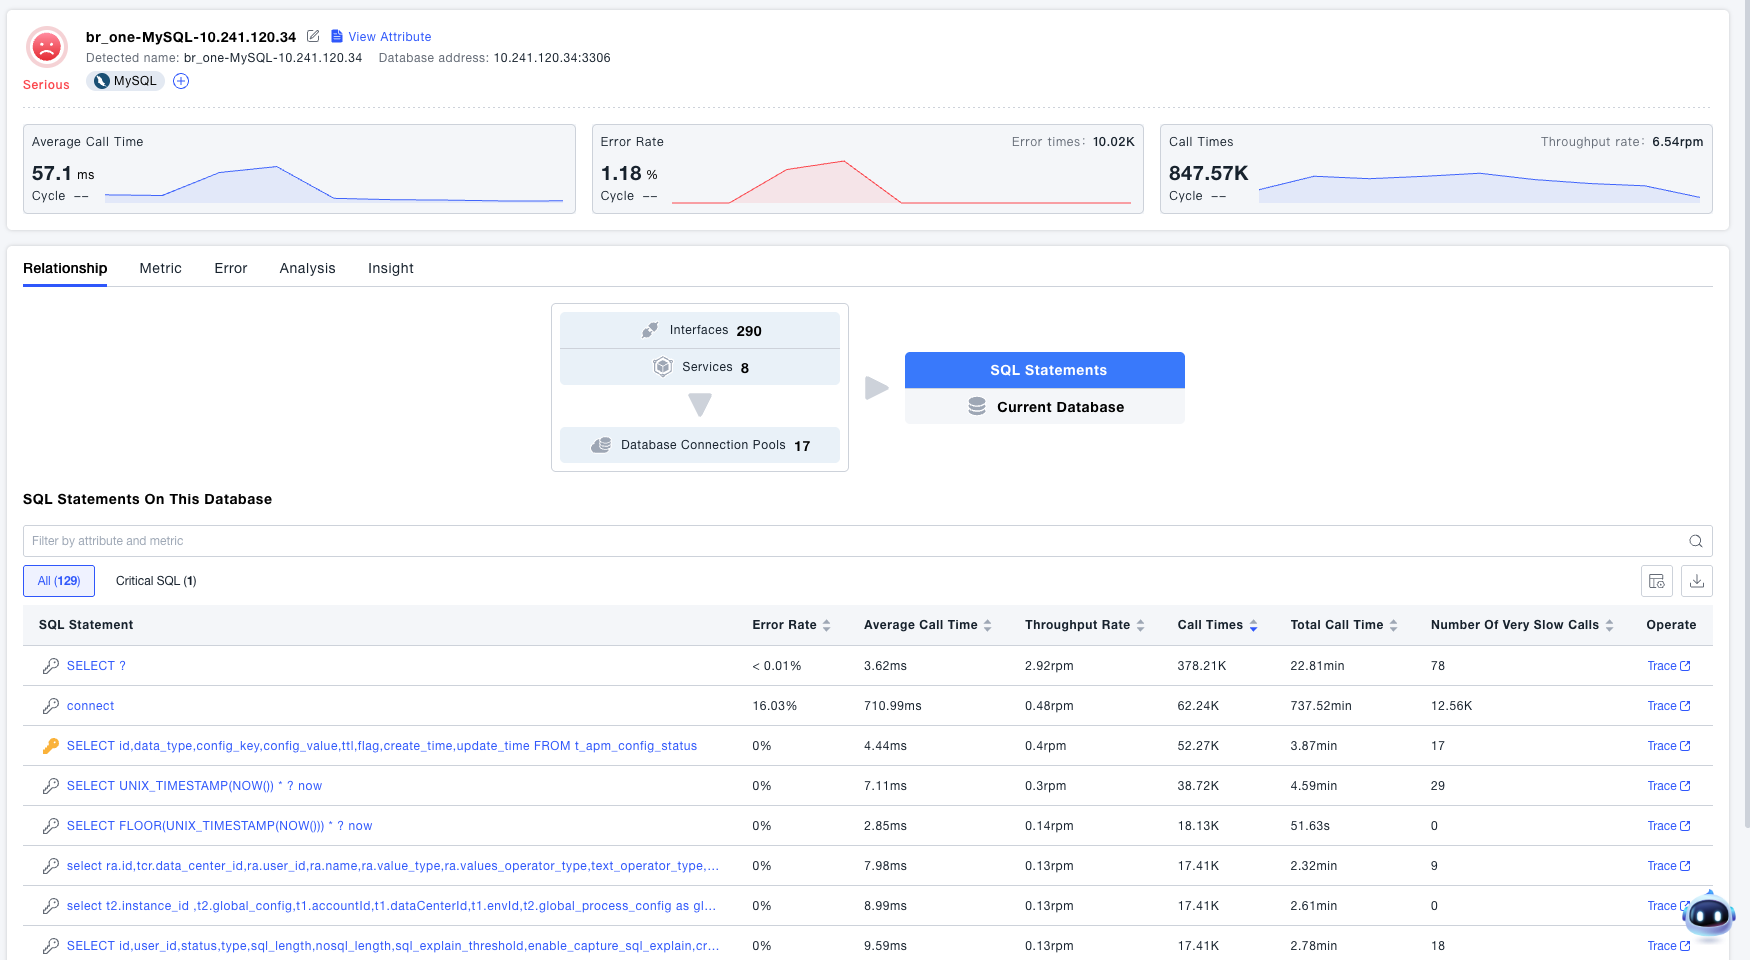
Relationships
-
View information about interfaces and services that are making requests to this database.
-
View connection pool information for applications connecting to this database.
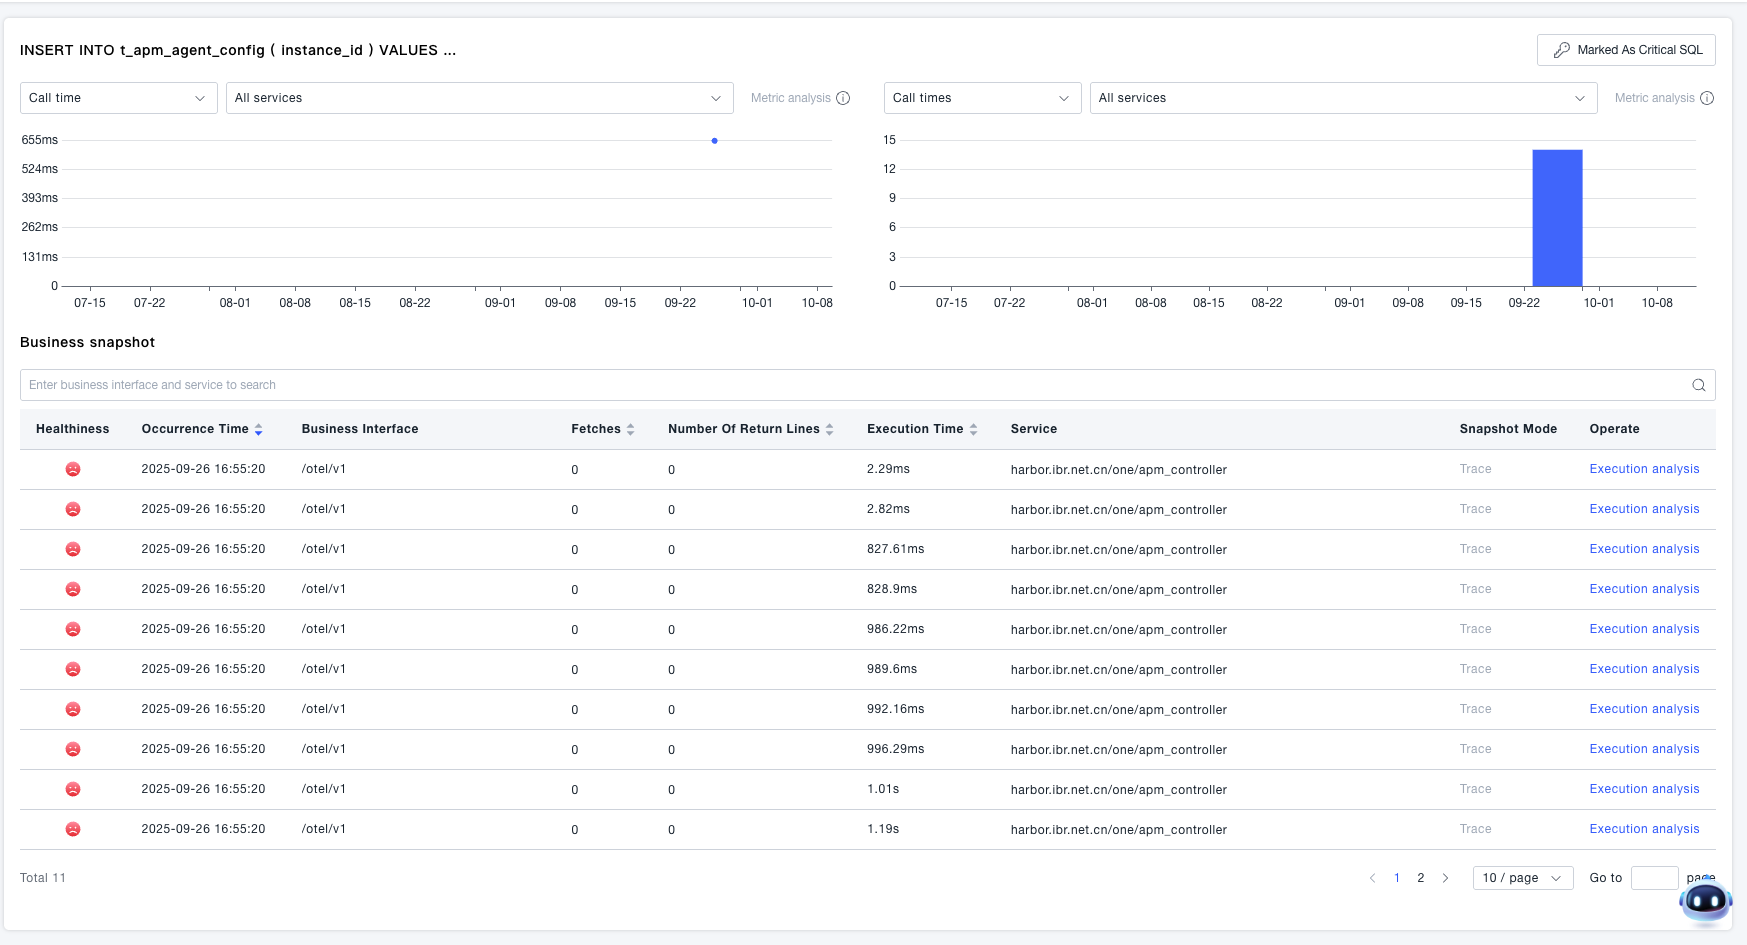
- View SQL statements executed on the database (or NoSQL operations for non-relational databases).
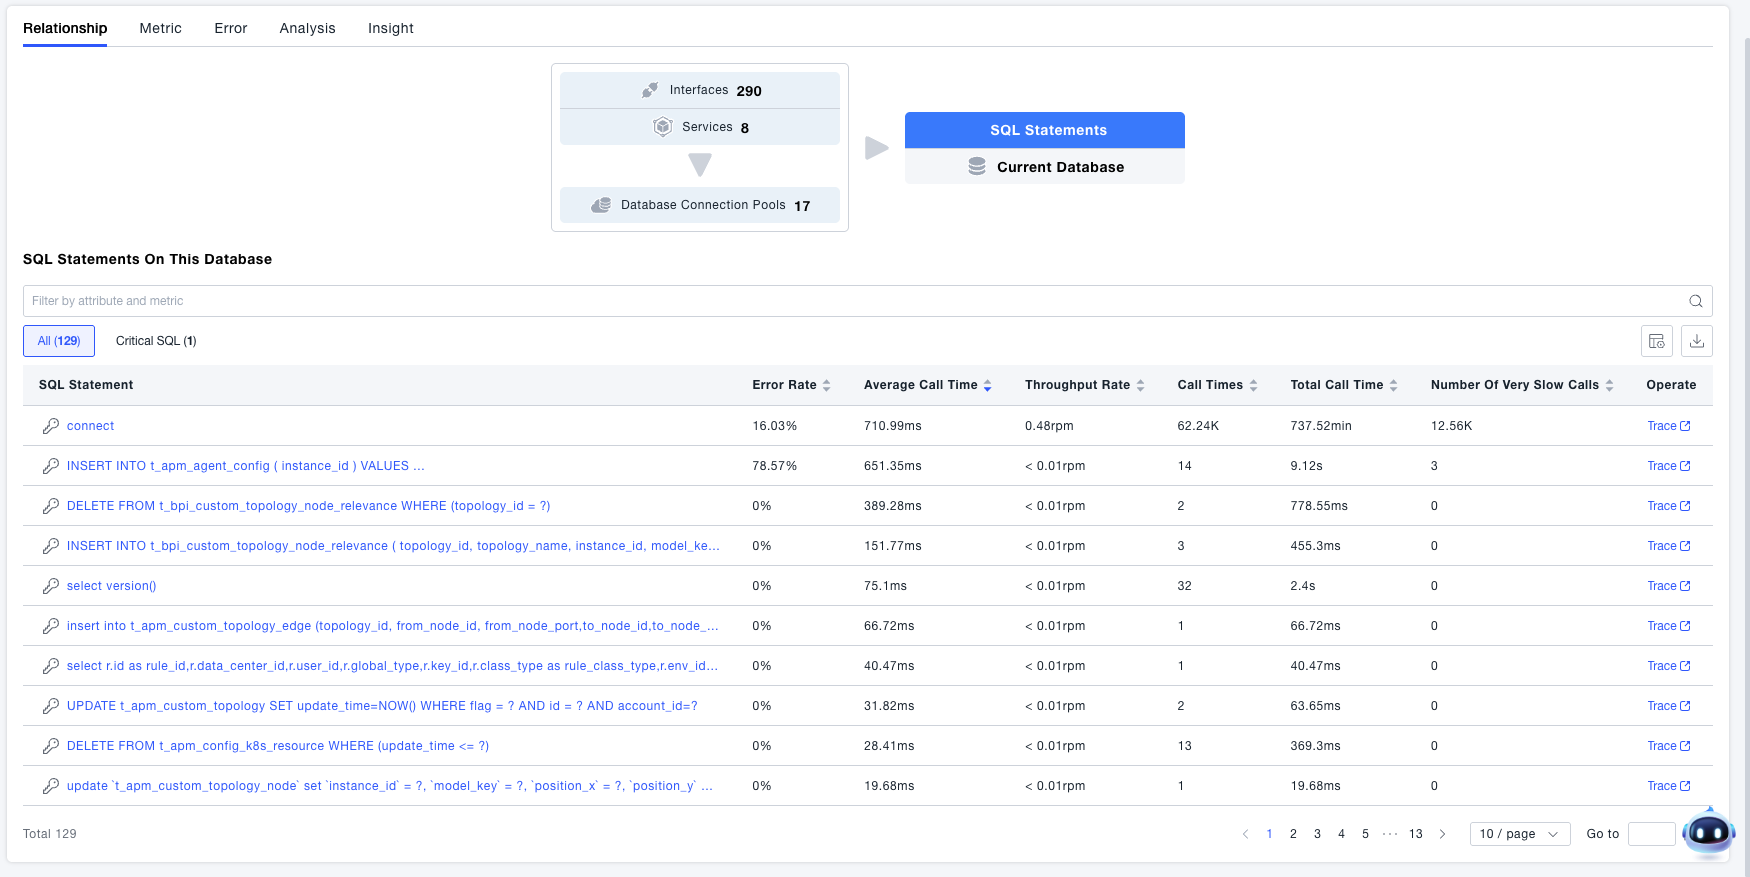
Drill into SQL/NoSQL operation details to analyze relevant information (such as occurrence time, business interface, rows returned, etc.). You can also view trace information or perform execution analysis.
Metrics, Errors, Analysis, Insights
Similar to the Service drill-down details, you can view data related to the current database. This section will not elaborate further; please refer to Services.