Metric-Based Rules
Prerequisites
- Metric-based (including availability-based) and event-based alert rules differ fundamentally in their data characteristics: metrics are continuously reported time-series data reflecting the status trends of systems or services, while events are instantaneously triggered discrete data recording anomalies or actions at specific points in time. This fundamental difference in data nature dictates that these two types of rules require completely distinct design systems in terms of detection logic, configuration methods, and response mechanisms.
- This document focuses on explaining the differences in configuring metric-based and event-based rules
Interface Configuration
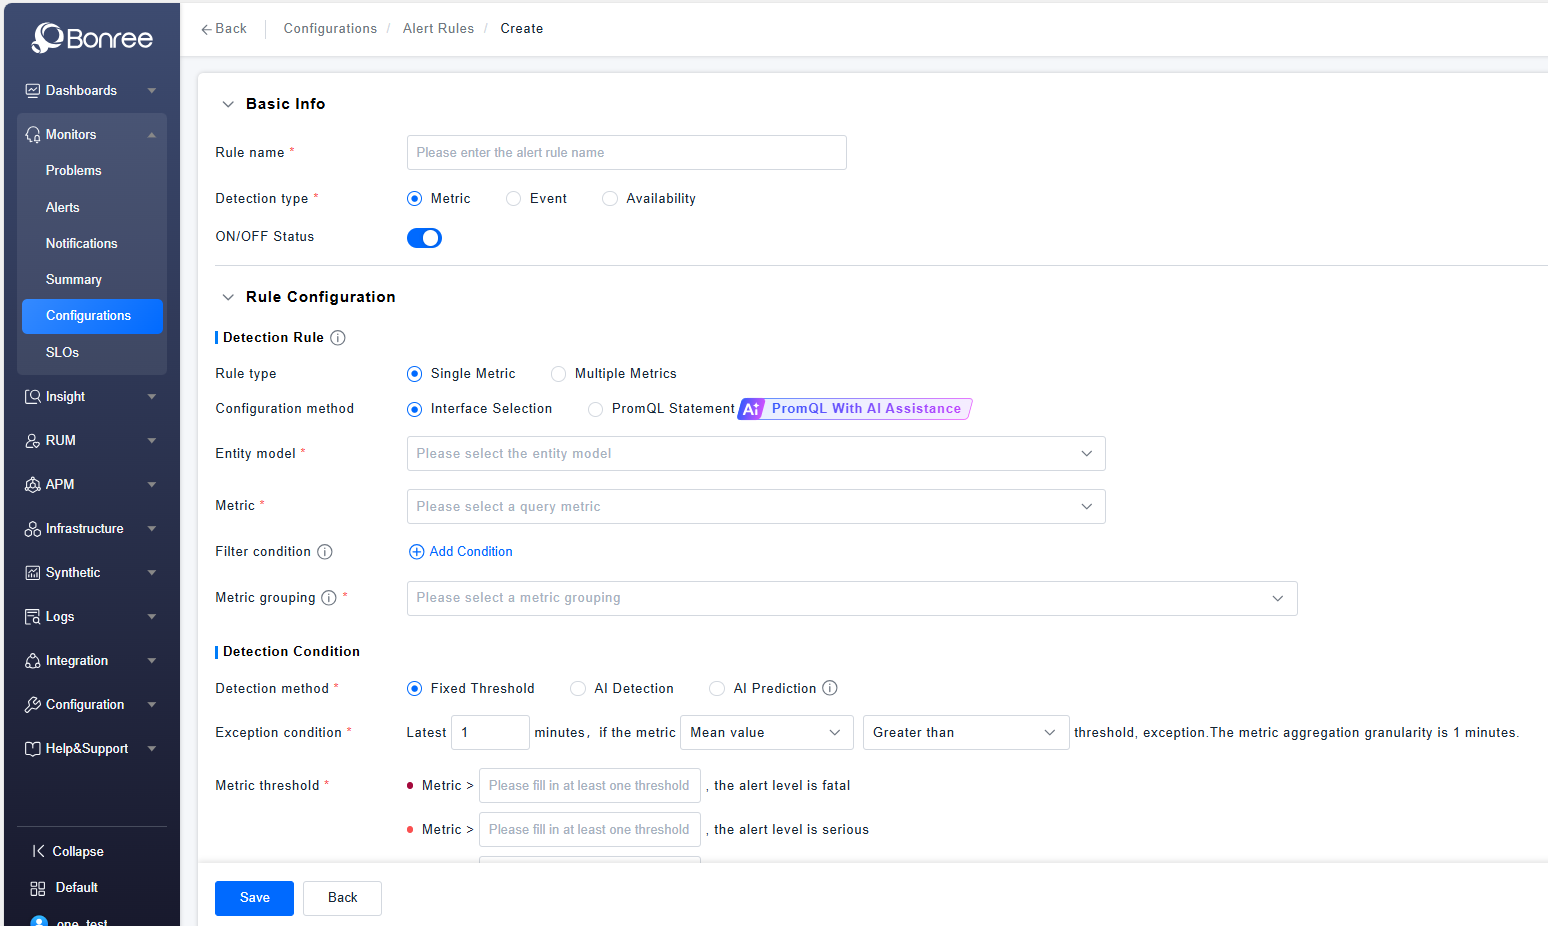
Detection Rules
- You can choose to configure the rule type as single-metric or multi-metric. Single-metric rules are configured for only one metric, while multi-metric rules support up to 5 metrics under the same entity model for configuration. Logical AND or OR relationships can be configured: AND means an alert is triggered only when all metrics meet the detection conditions, while OR means an alert is triggered when one or more metrics meet the detection conditions.
- The style of the metric selector when choosing a metric is consistent with the metric system. If no metric system is defined for the current resource domain, the default metric system will be used. Hovering over a metric name displays a tooltip with its key information, including the description, and dimensions.
- For filter conditions, the first level includes Entity Model, Related Entities, and Related Dimensions. The second level for Entity Model and Related Entities includes Entity Attributes and Entity Tags, while the second level for Related Dimensions includes the involved dimensions. Up to 10 conditions are supported, with an AND relationship between multiple conditions. Filter values for high-cardinality entities come from key instances custom-labeled in the entities. If no key instances are labeled, no data will be available for filtering.
- If the selected entity model is an entity, the grouping will default to the selected entity model and cannot be deselected. Additionally, roll-up entities of the entity model and intersections of related entities' entity attributes and independent metric dimensions are provided, which may be multiple. If the selected entity model is a non-entity (indicating it belongs to a third-party or custom entity model), no default grouping is provided, and only related dimensions are available for user selection. In this case, AI root cause analysis problems cannot be generated.
Detection Conditions
- The detection methods are divided into Fixed Threshold, AI Detection, and AI Prediction. The method chosen affects the configuration of anomaly conditions. Fixed Threshold means users directly configure thresholds to compare with metrics, and those triggering the thresholds will generate alerts based on the conditions. AI Detection refers to the AI training on the past 30 days of data (if fewer than 30 days of data are available, it uses the actual available data; if the metric was just registered, a fallback logic is applied where training starts the next day, with relatively lower baseline accuracy in the fallback logic), providing upper and lower baselines for the metric, which are compared with the actual metric values. Values outside the baselines are considered anomaly points, and whether the threshold is triggered is determined based on the configured proportion of anomaly points. AI Prediction uses past data (training method similar to AI Detection) to forecast future data, providing a predicted trend chart. If the predicted trend triggers the configured threshold, an alert will be generated.
- In anomaly conditions, Fixed Threshold can configure metrics such as average value, accumulated value, consecutive occurrences, frequency, and year-over-year or month-over-month comparisons. AI Detection can configure conditions for values above or below the normal range, while AI Prediction can configure conditions for values above or below a threshold. The detection cycle for AI Detection and Fixed Threshold is 1-30 minutes, while for AI Prediction, it is 1 hour to 1 week. For metric aggregation granularity, AI Detection and Fixed Threshold use 1-minute aggregation granularity for cycles of 1-15 minutes, meaning one aggregated point per minute, and 5-minute aggregation granularity for cycles of 16-30 minutes, meaning one aggregated point every 5 minutes. For example, for the last 17 minutes, 3 points would be generated, while for the last 10 minutes, 10 points would be generated. For AI Prediction, the aggregation granularity is 30 minutes for 12 hours and 60 minutes for 13-168 hours
- Anomaly thresholds mean that different thresholds correspond to different severity levels. For example, if a metric is configured to trigger an anomaly when it exceeds a threshold, the higher the threshold, the higher the severity level.
- The trend preview chart is used as a reference when configuring thresholds, displaying recent metric data. Fixed Threshold with year-over-year or month-over-month comparisons, AI Detection, and AI Prediction provide both historical data and evaluation charts, while others only provide historical charts.
- Advanced anomaly configuration is used to query metrics for delayed anomaly events. After setting up delayed anomaly events, data from a previous period is queried at the current time to avoid detection inaccuracies caused by data reporting delays, which may result in empty data for the most recent period. If there are no data delay issues, this item does not need to be configured. You can also check the option "If no data is queried within the selected time, it is determined as normal." This means that if no data is found within the selected range, it is not considered an abnormal situation, and no anomaly events or alerts will be generated.
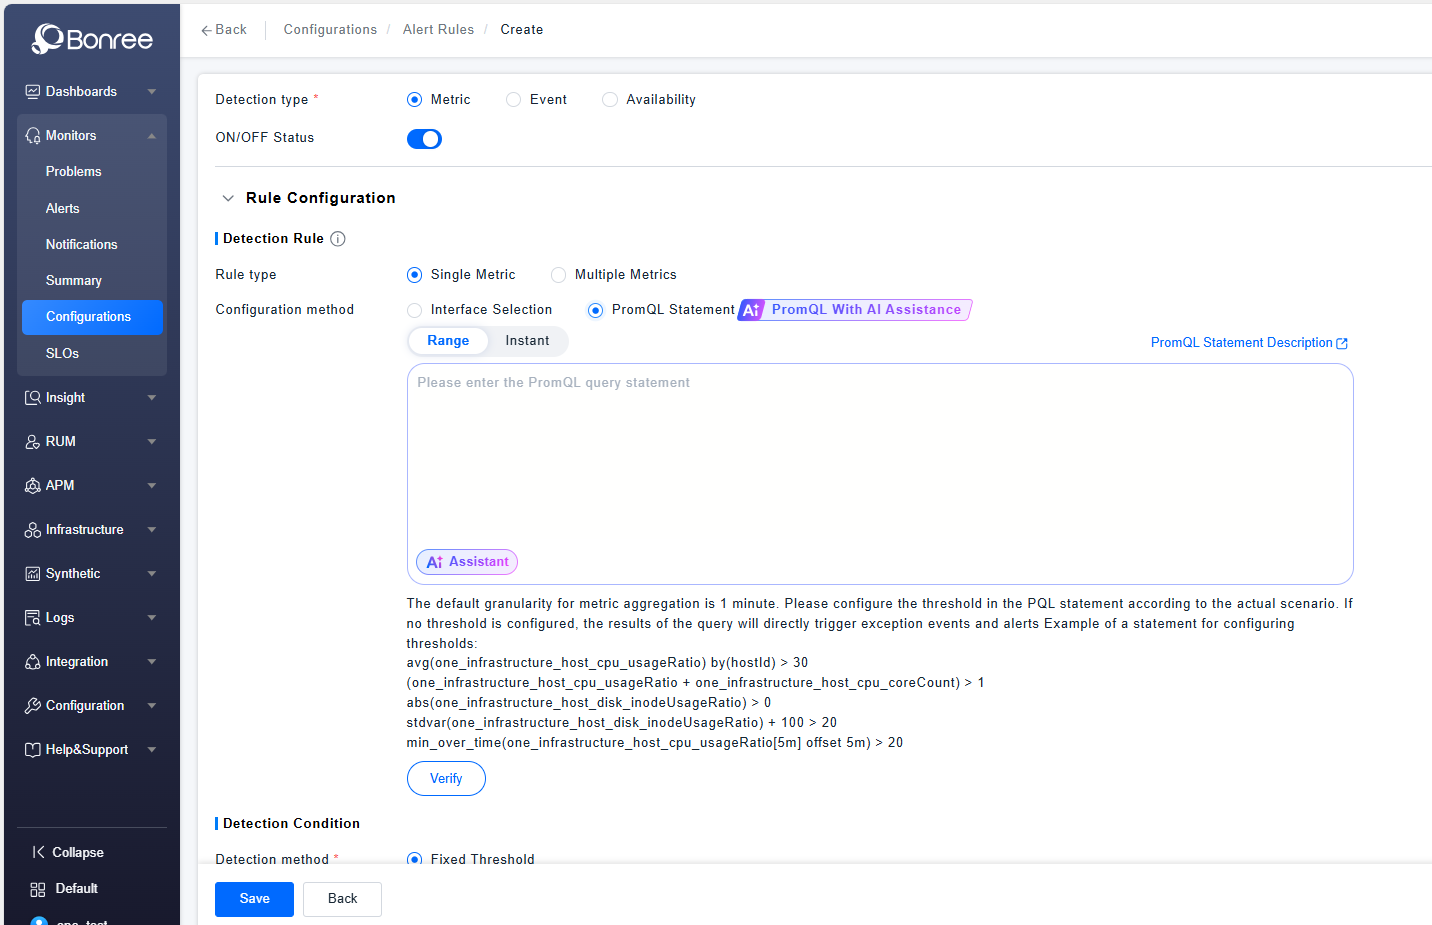
PromQL Statement
-
Anomaly conditions and thresholds are directly configured in the query statement box, while an "AI-Assisted Writing" feature is provided. By clicking the button, a pop-up window appears where you can input requirements for the statement to be written, and the AI will help generate the PQL statement. You can choose to fill it into the input box with one click.
-
If the "instant" method is selected, configuration of duration is also supported.
-
Labels are used for additional tagging of generated alerts. You can customize the key and value of labels. The value supports automatically obtaining relevant attribute values of alert entities in the form of $value, such as $hostDetectedName tagged as the corresponding operating system type; it also supports directly entering fixed values.
-
The alert level is selected in a single-choice format below the statement, with the warning level selected by default, and it can be changed to other levels.
-
The alert name supports user customization. You can input the concatenation content of the alert name, defined based on metric dimensions, current values, labels, or fixed content.
If a threshold is defined in the PQL statement, a description related to the threshold will be automatically appended after the alert name you defined.