How to Integrate Logs into ONE
The ONE platform offers diverse log integration methods to meet log collection needs across various scenarios. Whether it is server-side logs, client-side logs, or external system logs, they can all be integrated through a streamlined configuration process. This enables centralized log management, analysis, and monitoring, providing robust support for business stability and operations.
Prerequisites
- Environment Preparation : Ensure the ONE platform services are running properly. You can check the service status via the platform’s management interface. If external log integration is involved (e.g., using tools such as Logstash or FluentBit), these tools must be installed and configured on the corresponding servers in advance.
- Permission Configuration : Users must have the relevant “Log Configuration” permissions in the ONE platform to perform log integration settings. For server-side logs, ensure that the account used for log collection has read access to the log directories.
Instructions
You can log in to the ONE platform and navigate to the “Log Configuration” page under the “Log Analysis” section. Depending on the source of the logs, choose from the following integration methods and follow the corresponding installation commands and steps:
- Server Logs : Suitable for log collection from host devices such as Linux, Windows, and ARM. For detailed integration and usage steps, refer to Server Log Integration.
- Client Logs : Suitable for log collection from frontend applications such as JS, Android, and iOS. For detailed integration and usage steps, refer to Client Log Integration.
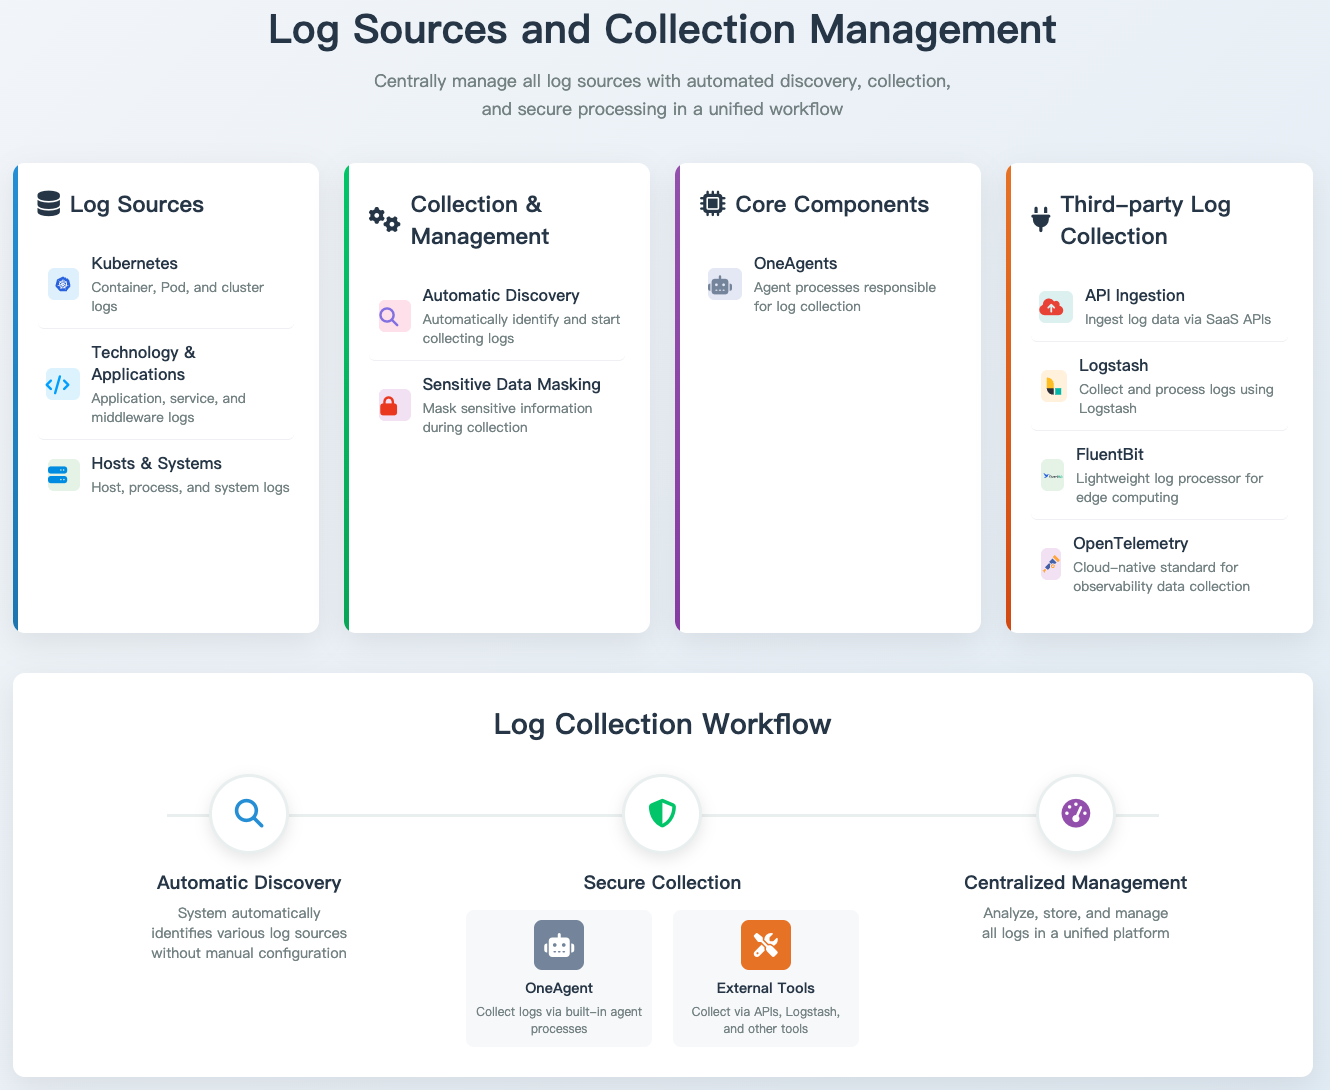
- External Logs : Supports log integration via API, Logstash, FluentBit, OpenTelemetry, and other methods. For detailed integration and usage steps, refer to External Log Integration.
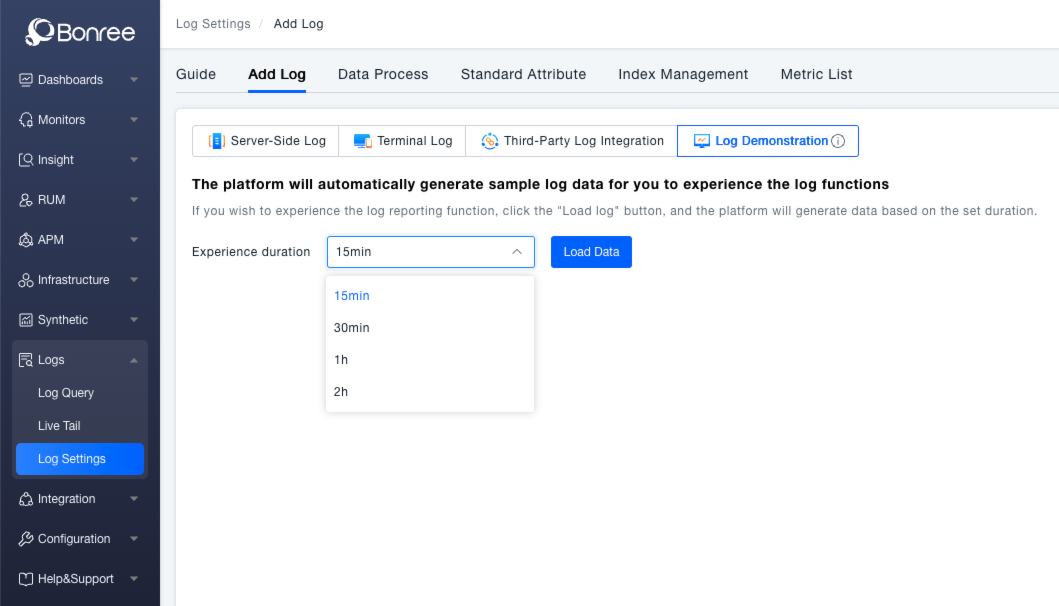
Log Demo (Optional)
To help users quickly experience the platform's capabilities, ONE provides a demo data feature.
You can log in to the ONE platform, navigate to the Log Configuration page under the Log Analysis section, and switch to the Log Demo tab within Add Log . Select a demo duration (e.g., 15 min), click the Load Data button, and the platform will automatically generate sample log data. This data is stored according to index rules, allowing users to get a hands-on experience of the log functionality.
Supported demo durations include 15 min, 30 min, 1 h, and 2 h.
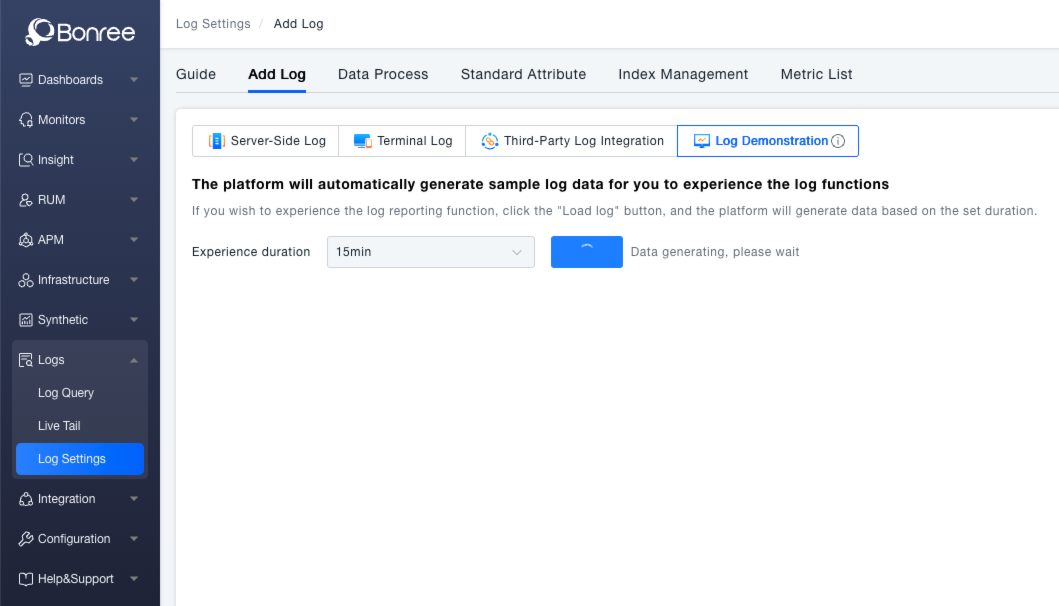
Clicking "Load Data" will show a "Generating data, please wait" message.
Upon completion, a "Data preparation complete. View Data" message appears. Click "View Data" to jump to the log EVENT search mode.