Metrics List
The Log Analysis module provides capabilities for analyzing raw log data. In addition, the ONE platform offers metric generation features, allowing users to create relevant metrics based on log data and use them directly in dashboards and alerting modules.
Use Cases
- Create a metric for the count of error logs. Use this metric to configure a dashboard widget to observe the trend of error log occurrences.
- Create a keyword-related metric and configure an alert rule to trigger when a specific keyword appears in the logs.
Getting Started
Metrics List

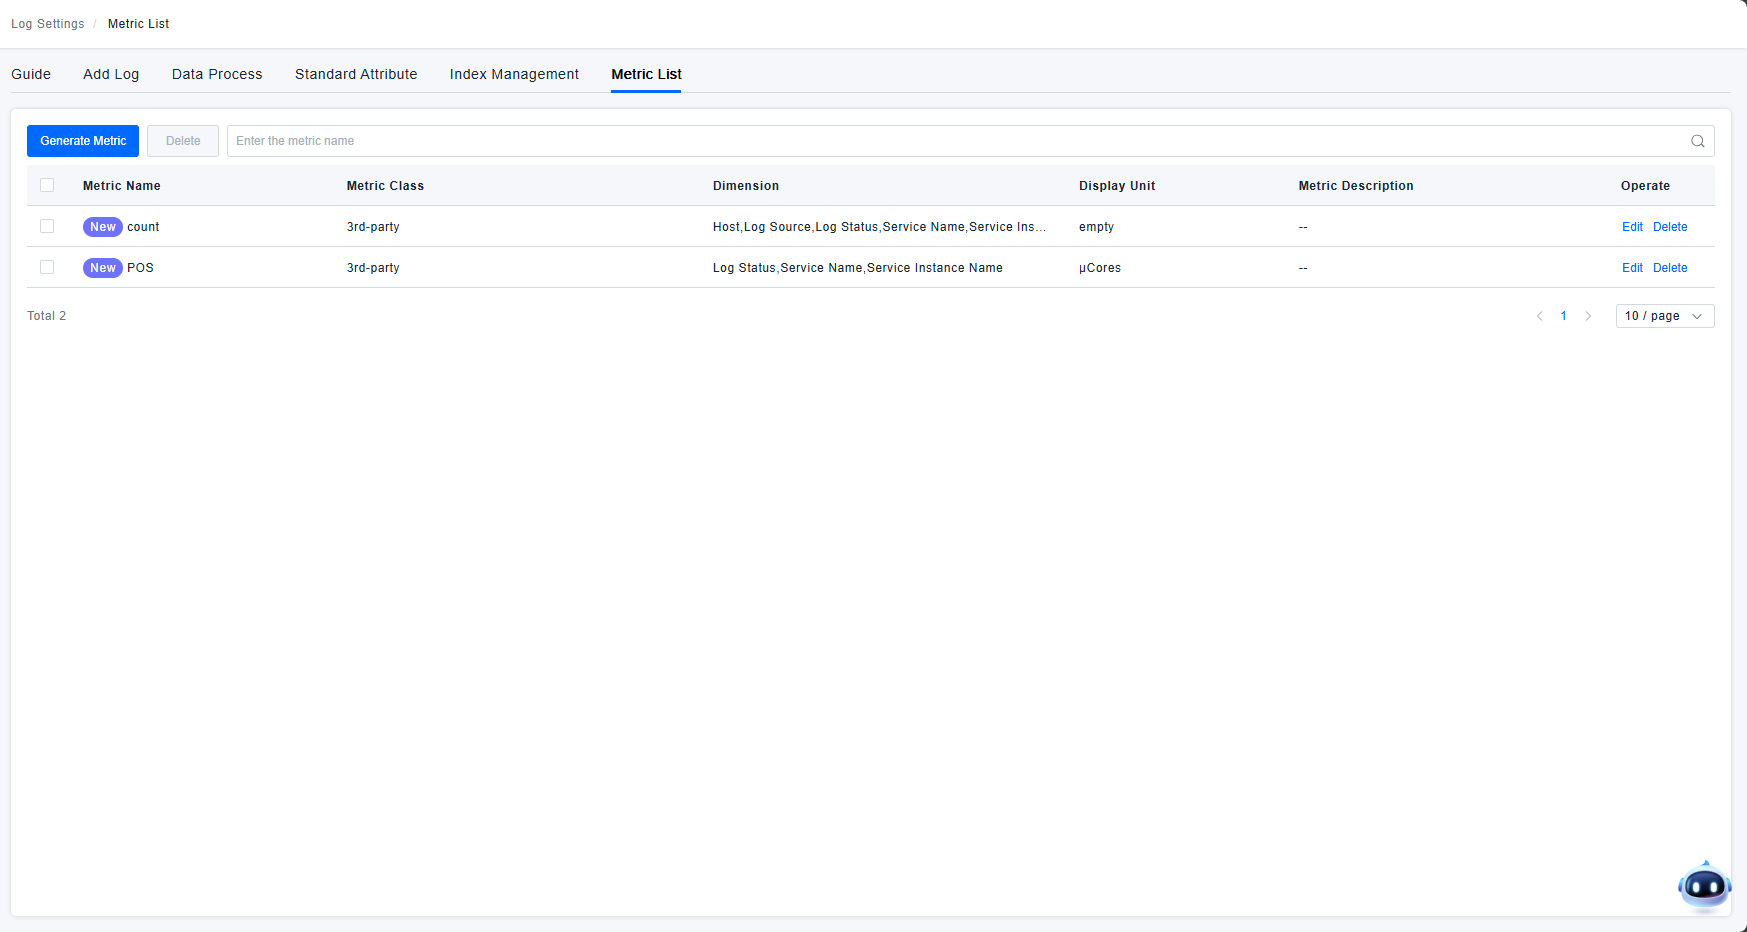
- All created metrics are displayed in the metrics list, which includes the following information:
- Metric Name: The user-defined name of the metric.
- Metric Category: Each metric requires a category path for organizational selection. Metrics generated from logs can only be placed under the 'Third-party' category.
- Dimensions: When defining a custom metric, you can select entity dimensions and metric dimensions for analysis.
- Display Unit: The unit of measurement shown when querying the metric.
- Description: A user-defined description of the metric.
- Actions: Supports edit and delete operations.
- Metrics created in this list are integrated into the platform's metric model and can be used for analysis and alerting within Dashboards and Alerting modules.
Generating a Metric

- Query Statement Filter conditions added through filter components determine which logs are included in subsequent metric calculations.
- Basic Information
- Calculation Object: Select either log count or log byte size as the metric dimension. Default is log count.
- Metric Category: Metrics are permanently created under the "Custom/Logs" classification in the preset metric repository.
- Display Name: The name of the metric.
- Metric Metadata
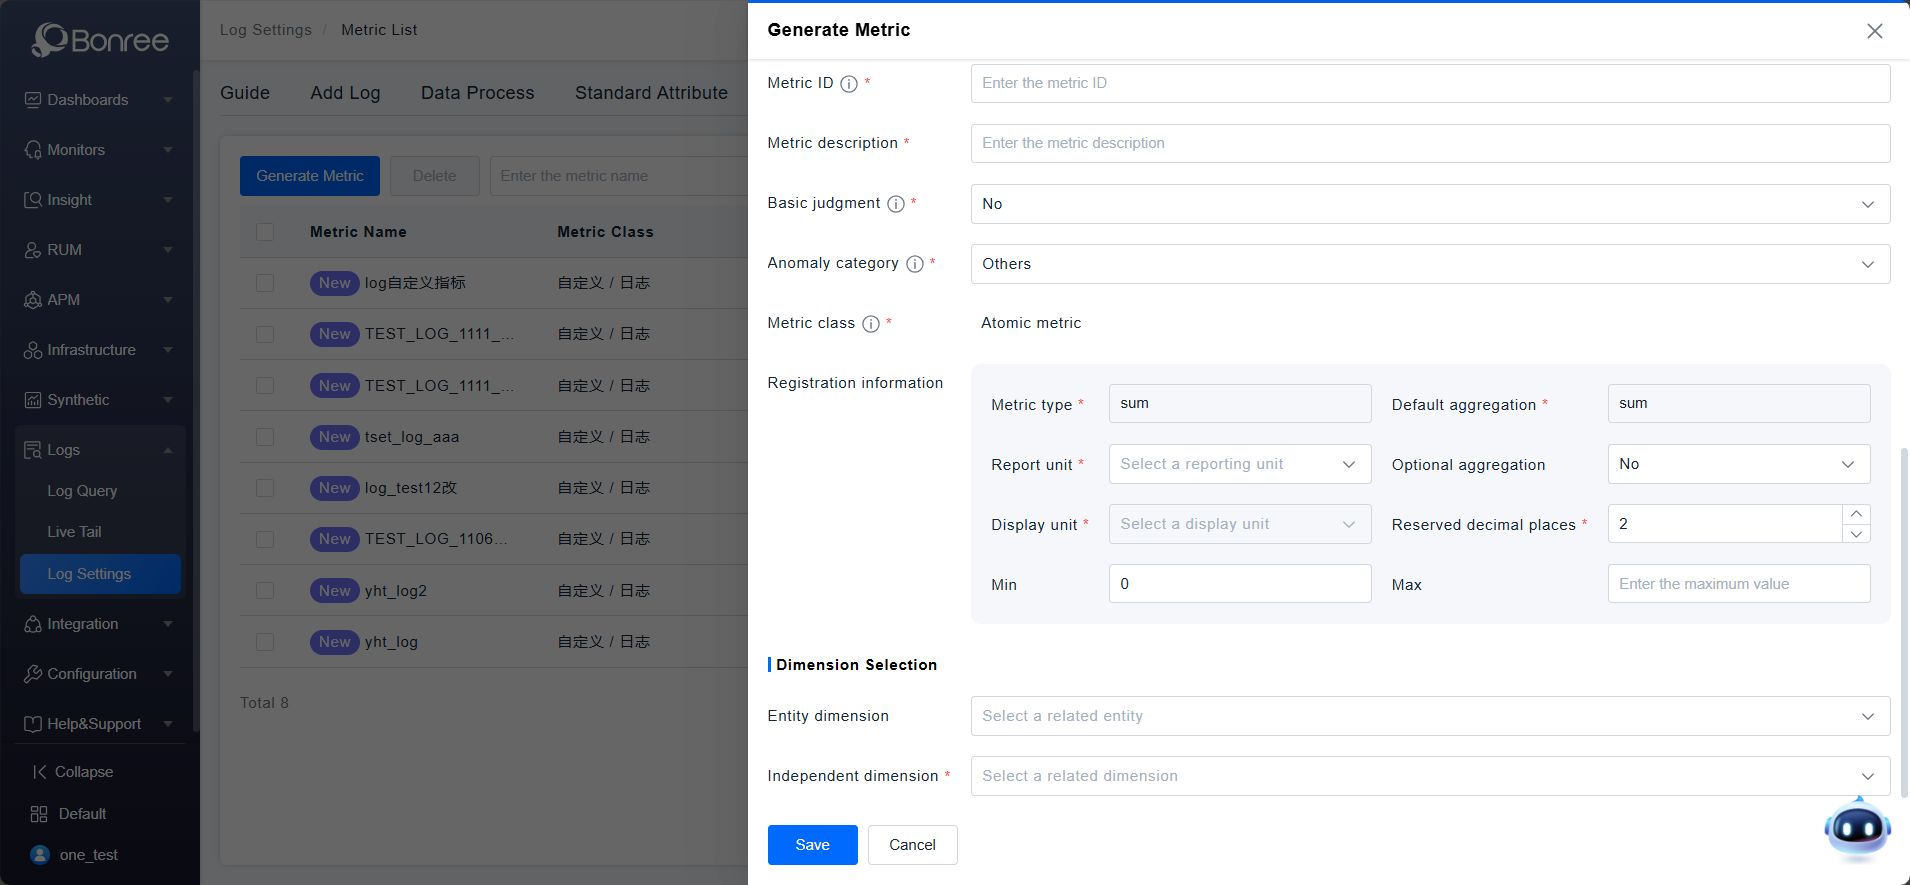
- Metric ID: Unique identifier for the metric. Cannot be duplicated or start with "one.".
- Metric Description: Explains the meaning of the metric.
- Baseline Judgment: Criteria for interpreting increases/decreases in the metric. Default is "None". Options include "Higher is Better" or "Lower is Better", affecting health scores and metric analysis.
- Anomaly Category: Default is "Other". Options include Availability, No Data, Error, Slow, Throughput, Resource, or Notification.
- Metric Type: Fixed as "Atomic Metric".
- Registration Details:
- Metric Type (Required): Log metric type correlates with measurement object. Use "sum" for counting, "histogram" for measurements.
- Default Aggregation (Required): Default method depends on metric type:
- histogram → avg
- sum → sum
- Reporting Unit (Required): Select appropriate unit from classification.
- Optional Aggregation: quantile method available only for histogram types.
- Display Unit (Required): Select display unit from classification.
- Decimal Precision (Required): Set number of decimal places to retain.
- Minimum Value: Supported lower bound for the metric.
- Maximum Value: Supported upper bound for the metric.
- Dimension Selection:
- Entity Dimensions: Select from entities like Host, Process, Service, Service Instance, Container, Application. Attributes of the selected entities will be used as dimensions for analysis.
- Independent Dimensions: Select from standard attributes such as Host, Log Source, Log Status, Process Name, Container Name, Pod Name, etc. These are attribute fields directly associated with the log model and are queried differently from Entity Dimensions. The selected attributes will be used as independent dimensions for analyzing the metric.