LiveTail
In online operations scenarios, there is often a need to monitor log streams in real-time to extract key information from the latest logs and quickly analyze the root cause of anomalies. However, with traditional operational methods, it might be impossible to pinpoint exactly which machine is experiencing issues. Operators often need to log into servers one by one and execute commands like tail -f, or even use grep or grep -v for keyword filtering to locate relevant log information more intuitively. To alleviate this operational burden, the Log Analysis service provides the LiveTail feature, enabling real-time monitoring and analysis of all ingested logs based on the platform.
LiveTail provides visibility into all your logs, allowing you to view log messages from all ingested sources in near real-time, even if the log is not indexed (stored).
Logs in LiveTail undergo all configured preprocessing and processing pipelines, allowing you to easily filter based on related attributes, tags, and keywords to pinpoint specific logs.
Prerequisites
Logs have been processed by either built-in or custom parsing rules, and the relevant attributes or tags have been extracted.
Key Benefits
- All ingested logs are supported in LiveTail mode.
- Monitor real-time log information with support for filtering by keywords, attributes, and tags.
- Trace a single log entry back to its corresponding log file for real-time monitoring, eliminating the need to connect directly to online servers.
Getting Started
Navigate to Log Analysis > LiveTail to enter the LiveTail mode. Alternatively, you can select LiveTail mode directly from the Time & Space selector.
The platform provides powerful filtering components. You can easily locate keywords, attributes, or tags for filtering by clicking on search information, continually narrowing the search scope to identify the problem. Fields matching your query will be highlighted.
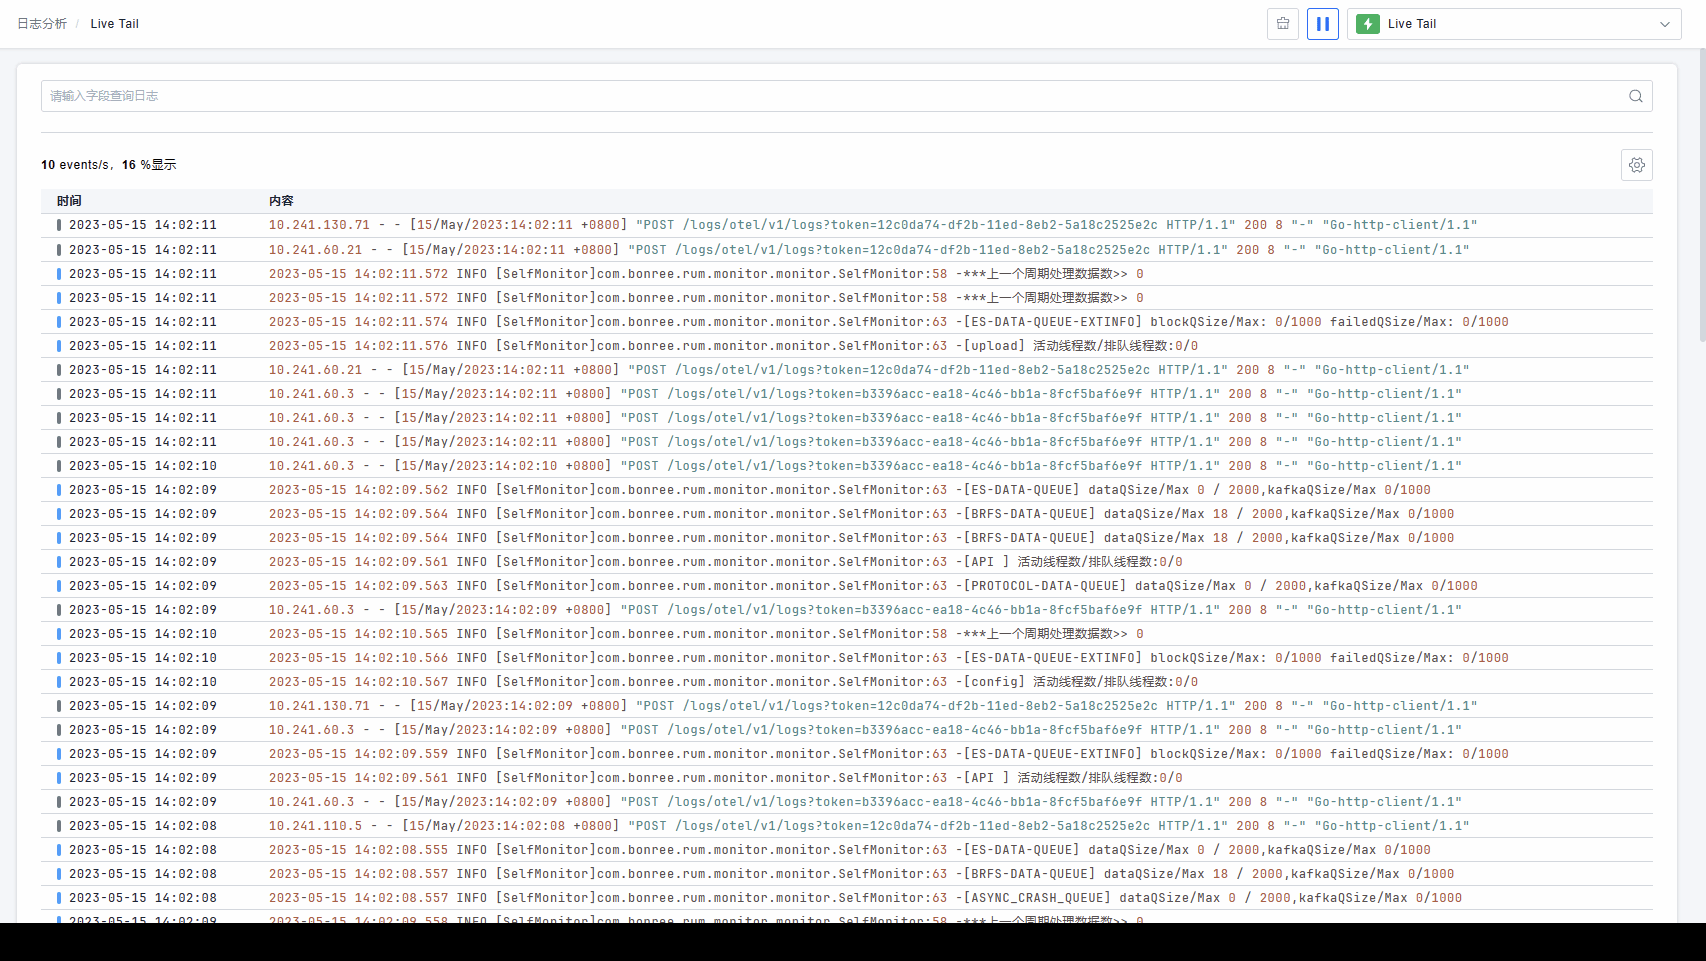
Use the Play and Pause buttons to start or stop the real-time ingestion of data.
![]()
When active, the most recent logs appear at the top of the list. The platform displays a maximum of 200 logs at a time. While the platform updates logs in real-time, sampling may occur if the log ingestion volume is excessively high. This sampling is uniform and random. You can check the statistics information to understand the actual log throughput. Users can progressively narrow their search queries to view 100% of the logs within a focused scope.
When paused, the platform stops ingesting new logs in real-time, allowing you to further investigate issues spotted during monitoring.
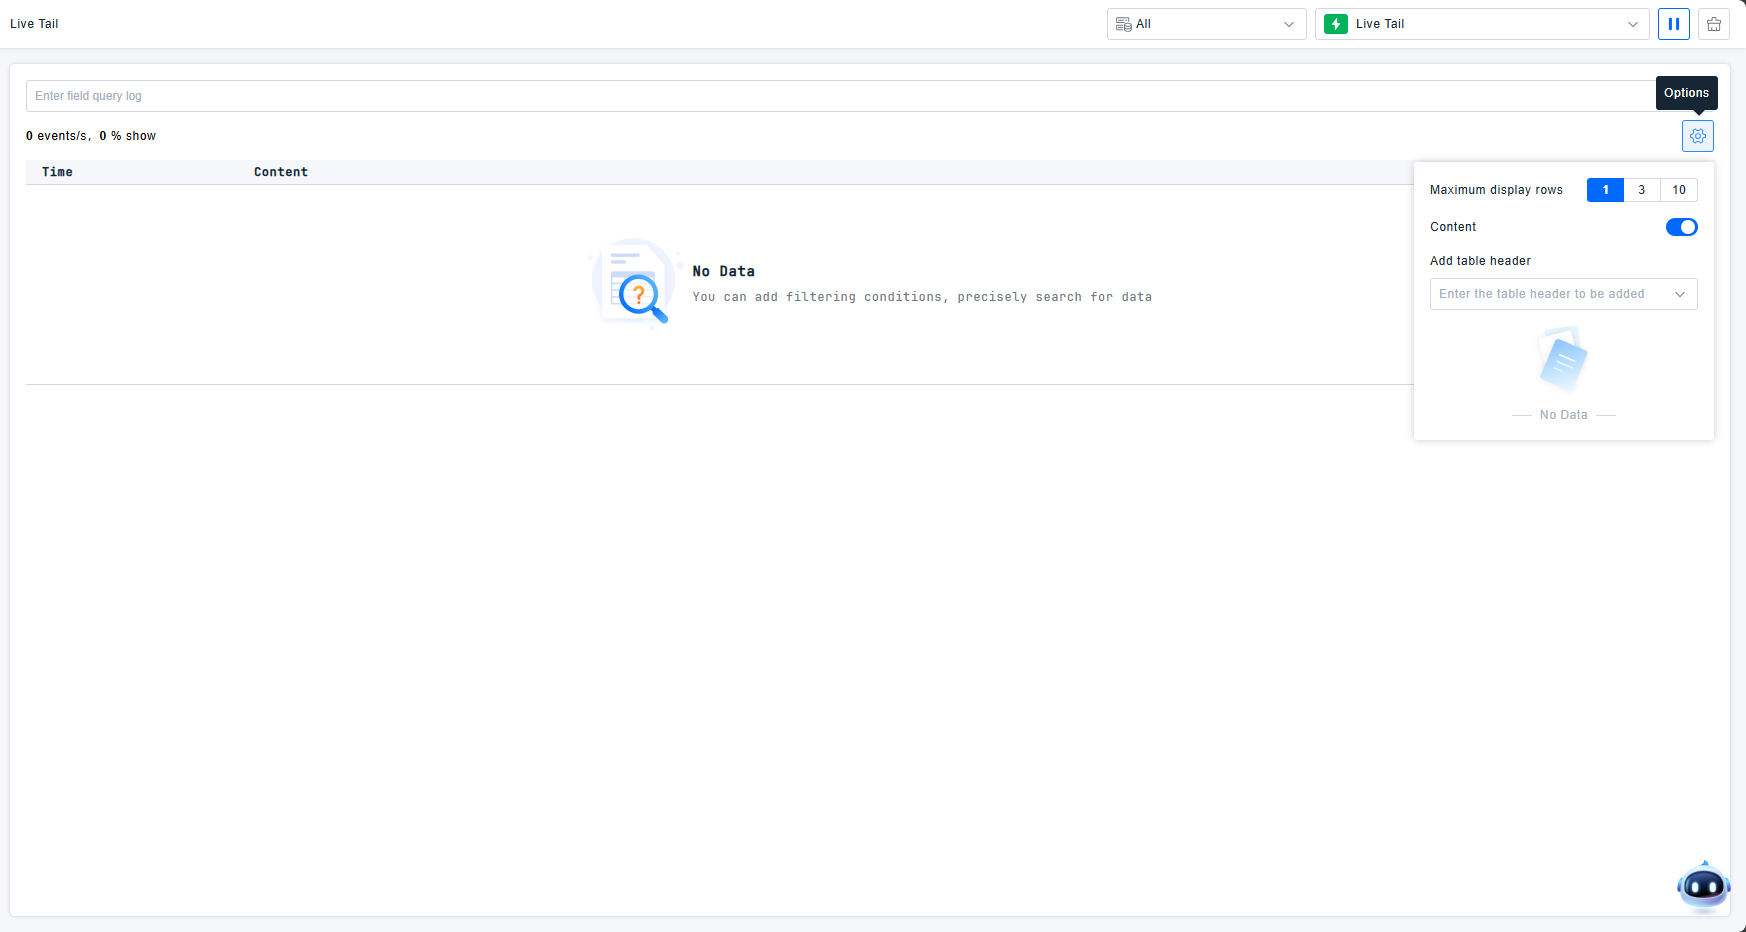
The platform supports configuring column headers and the number of displayed lines per row. You can adjust the line display to mimic the feel of viewing a log file in a terminal. You can also customize the table headers; all filterable attributes are available for header configuration. If a needed field is missing, you can first add it via the Quick Filters section.
Click on any individual log entry to view its detailed information.