SmartAgent
SmartAgent is a powerful system monitoring and management tool dedicated to providing users with comprehensive and detailed monitoring and configuration capabilities for hosts, processes, containers, and more. Through it, users can gain real-time insights into system resource usage, process status, container monitoring status, and also perform operations such as updating configurations, log management, and registration reset for SmartAgent and SmartGate, thereby ensuring system stability and meeting system management requirements across various scenarios.
Prerequisites
Complete the SmartAgent installation, ensure normal access to the system interface where SmartAgent is deployed, and possess the corresponding operational permissions.
Use Cases
Comprehensive System Monitoring: Suitable for daily operations and maintenance in scenarios like enterprise data centers and server clusters. Administrators can view core metrics such as host CPU utilization, memory usage, network transmission/reception rates in real-time, while monitoring process liveness and container runtime status, enabling quick identification of performance bottlenecks or abnormal failures to prevent business interruptions.
Custom Monitoring Rules: When specific process or container monitoring requirements exist, such as needing to exclude certain processes/containers or only monitor those with specific characteristics, custom monitoring rules can be implemented for precise monitoring.
Component Updates and Log Management: This functionality provides robust support for scenarios requiring version updates for SmartAgent and SmartGate, viewing update logs, and downloading relevant logs for troubleshooting.
System Reset: When SmartAgent or SmartGate experiences anomalies, the registration reset function can be used to restore them to the initial installation state and re-register monitoring entities.
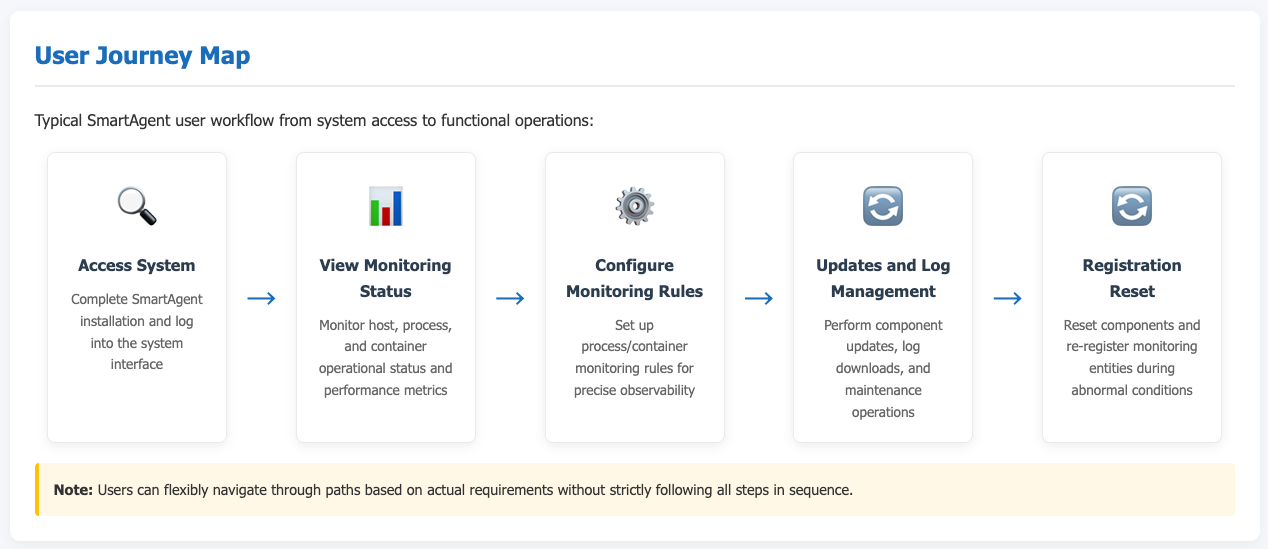
Getting Started
Use the system's navigation bar to go to Deploy Configuration -> Deployment Status to access the SmartAgent management interface.
Viewing Monitoring Status
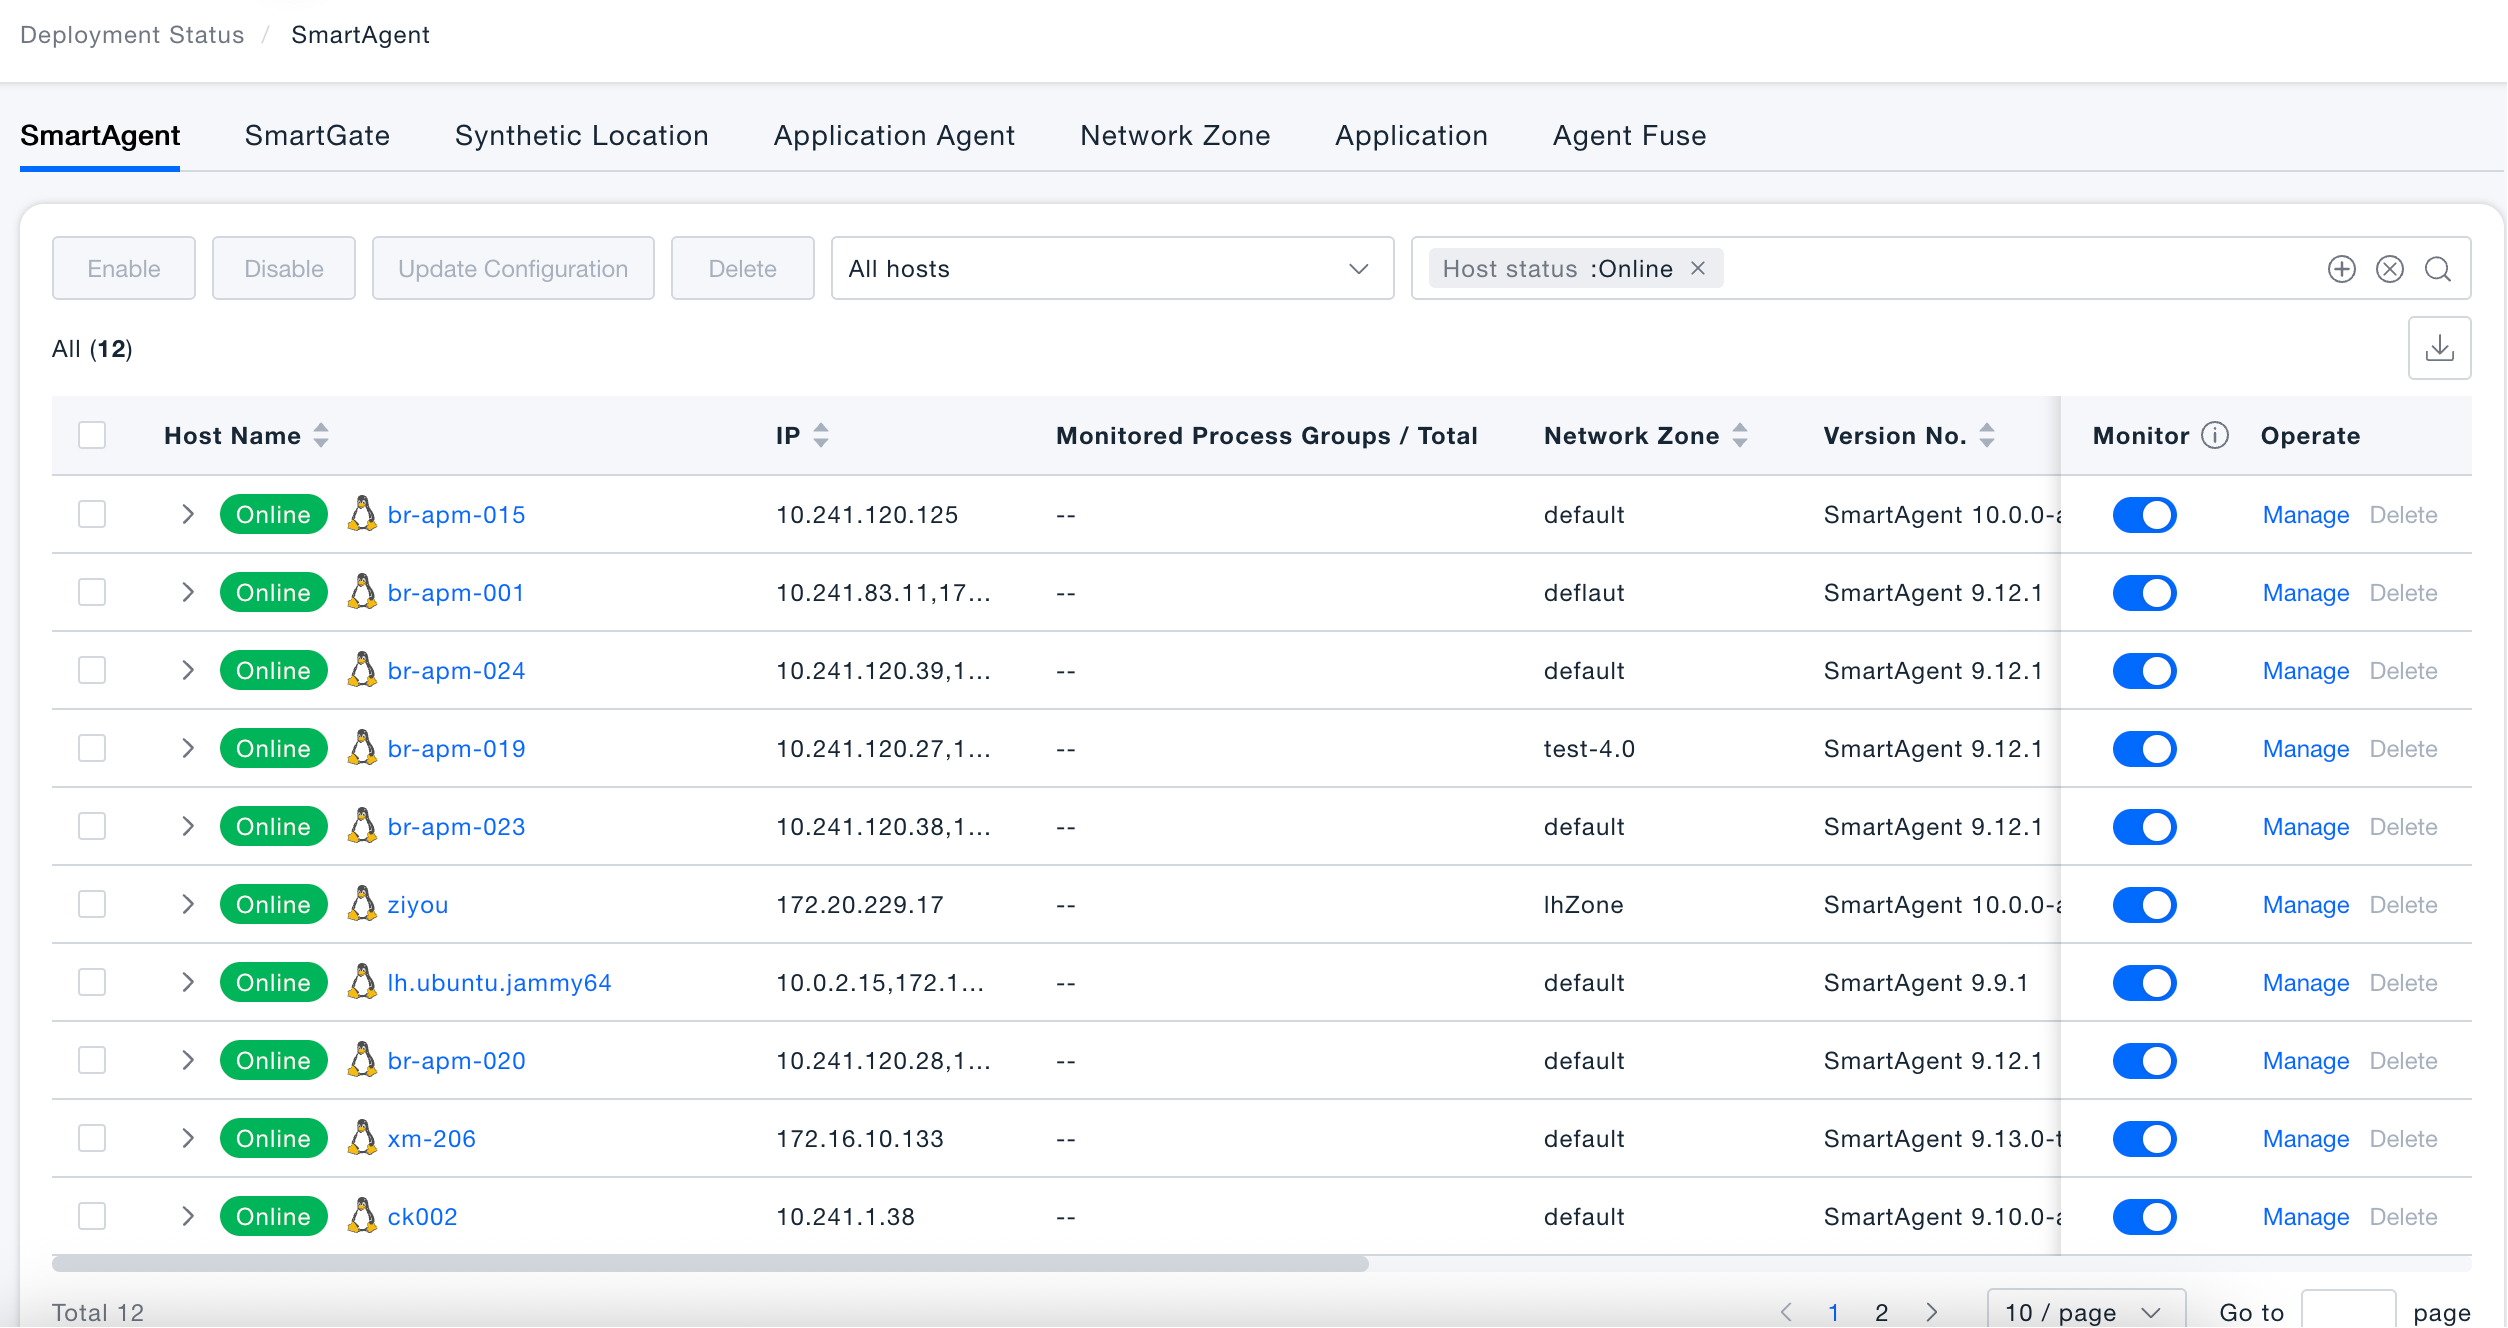
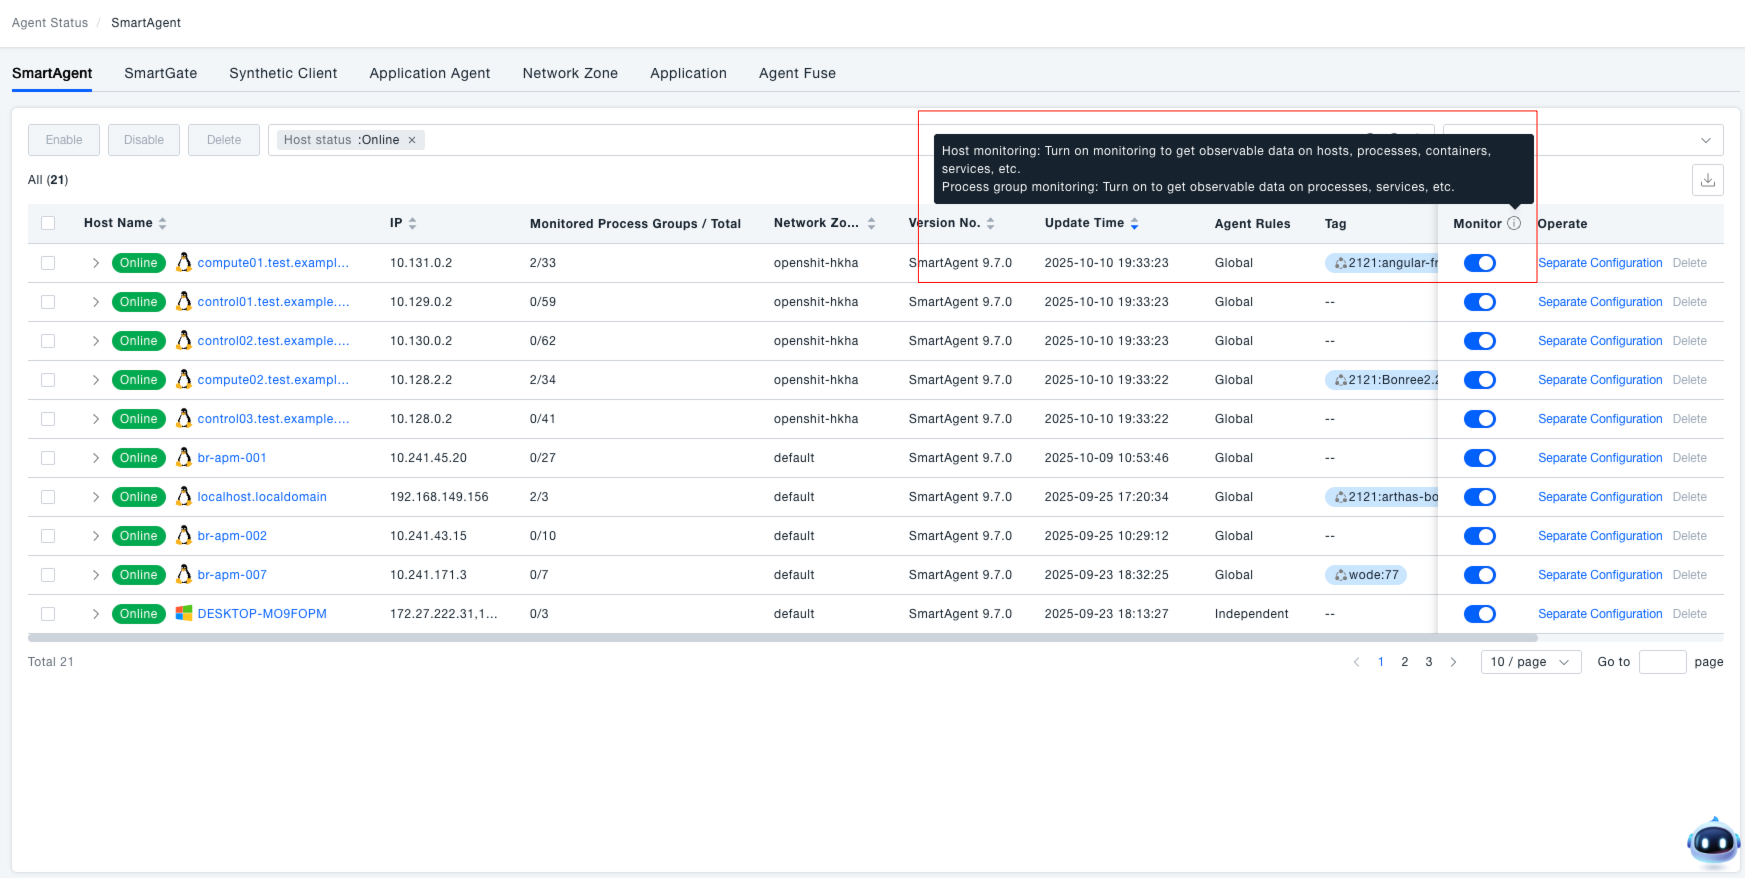
Within the SmartAgent interface, administrators can view status information for all currently monitored hosts, including hostname, IP, number of monitored process groups / total, network zone, version number, etc. The host status indicator (e.g., green "Online" label) allows for quick assessment of whether a host is running normally.
View Hosts: Upon entering the SmartAgent interface, the All Online Hosts list is displayed by default, facilitating a quick overview of the overall distribution and basic information (e.g., IP, version, monitoring status) of hosts within the system, providing foundational information for subsequent monitoring and management tasks.
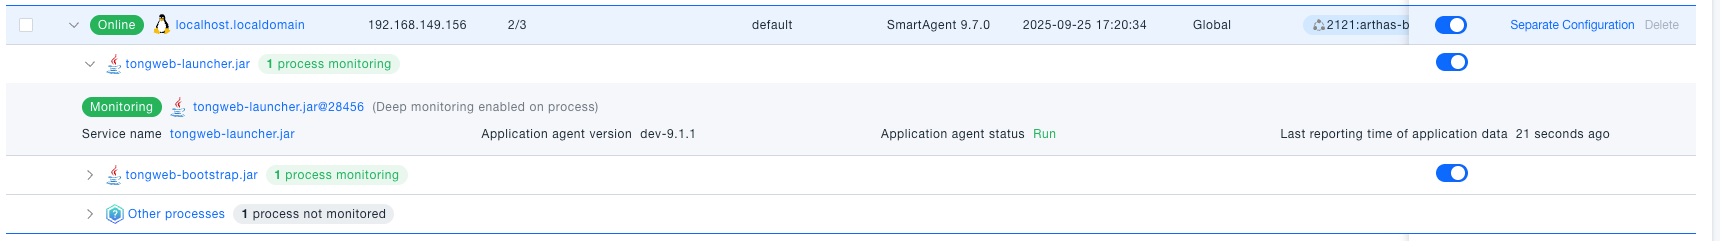
View Host Processes: Click the expand arrow before the target host name to view detailed information for all processes on that host, including process name and whether monitoring is enabled. This helps administrators accurately identify "unmonitored processes," ensuring core business processes are covered and monitoring blind spots are avoided.
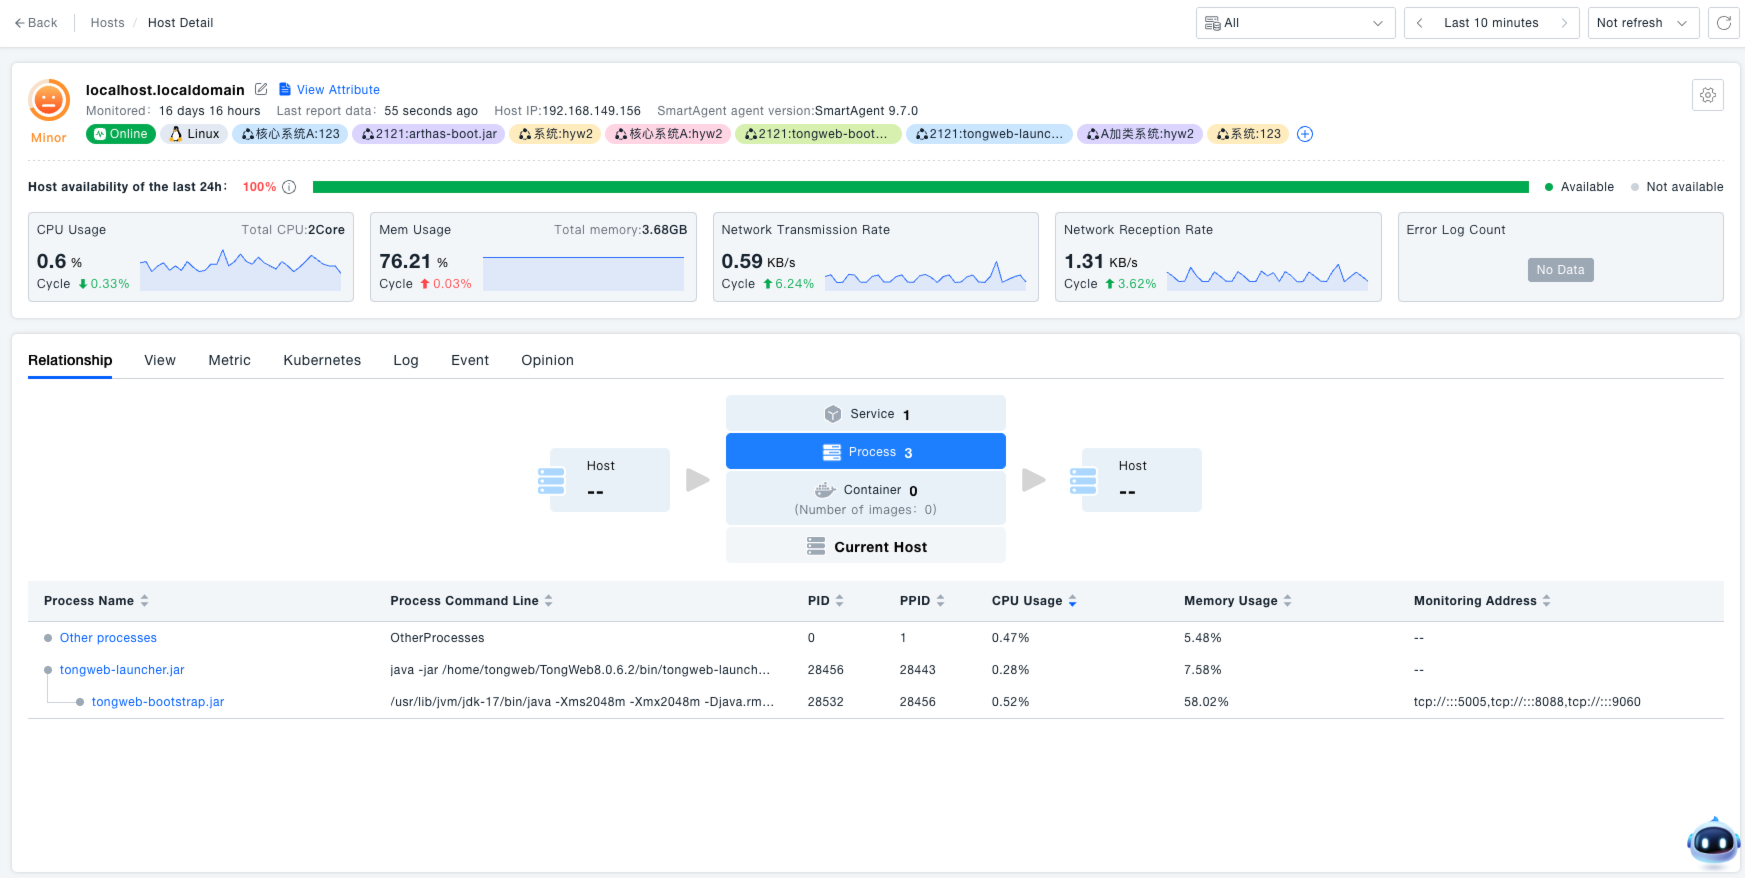
View Host Details: Click the host name to enter the details page, where you can view the following core data. This provides administrators with comprehensive host operational data, aiding in troubleshooting performance bottlenecks (e.g., high CPU) and identifying root causes of failures (e.g., surge in error logs), thereby optimizing system efficiency.
- Host Health: Availability and error log count for the last 24 hours.
- Resource Metrics: CPU usage, memory usage, network send/receive rates (supports trend chart view).
- Associated Data: Dependencies between processes and containers, as well as process details like PID, PPID, CPU/memory consumption.
Enable / Disable Host Monitoring: Use the toggle switch in the "Monitoring" column of the host list to control the monitoring state. This allows administrators to flexibly manage the monitoring scope, avoiding unnecessary data collection for hosts under "offline maintenance" or "testing," thus conserving system resources.
- Enable: Collects full observability data for the host, including host, process, container, and service metrics.
- Disable: Pauses monitoring data collection for this host (e.g., used during host maintenance).
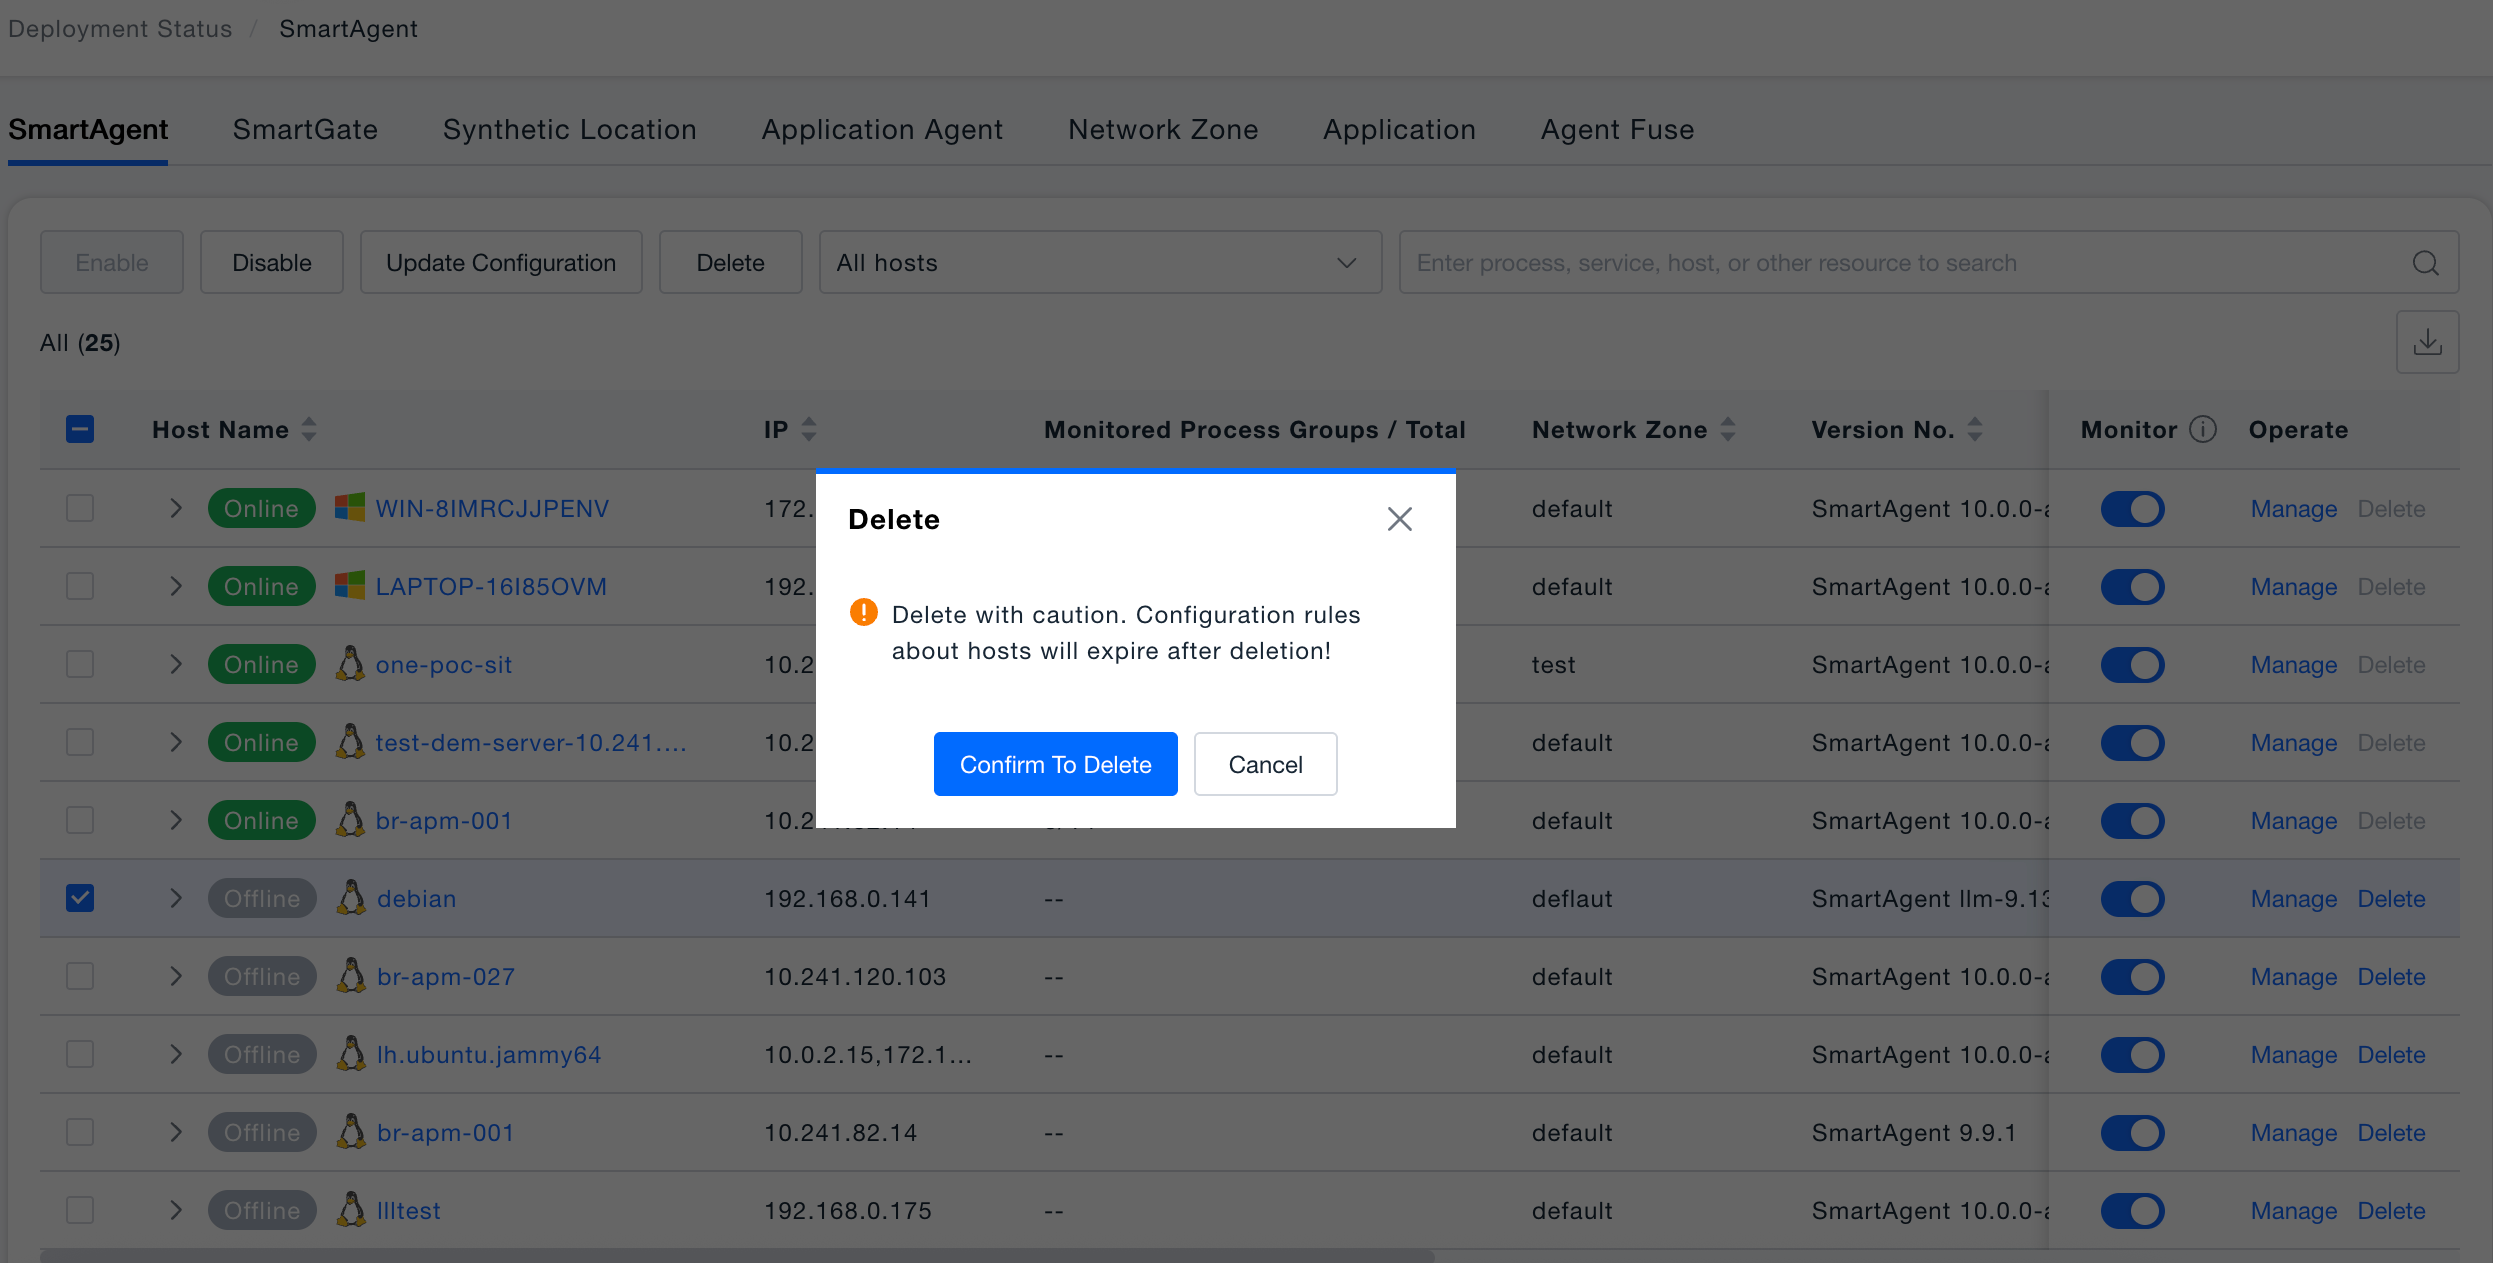
Batch Operation
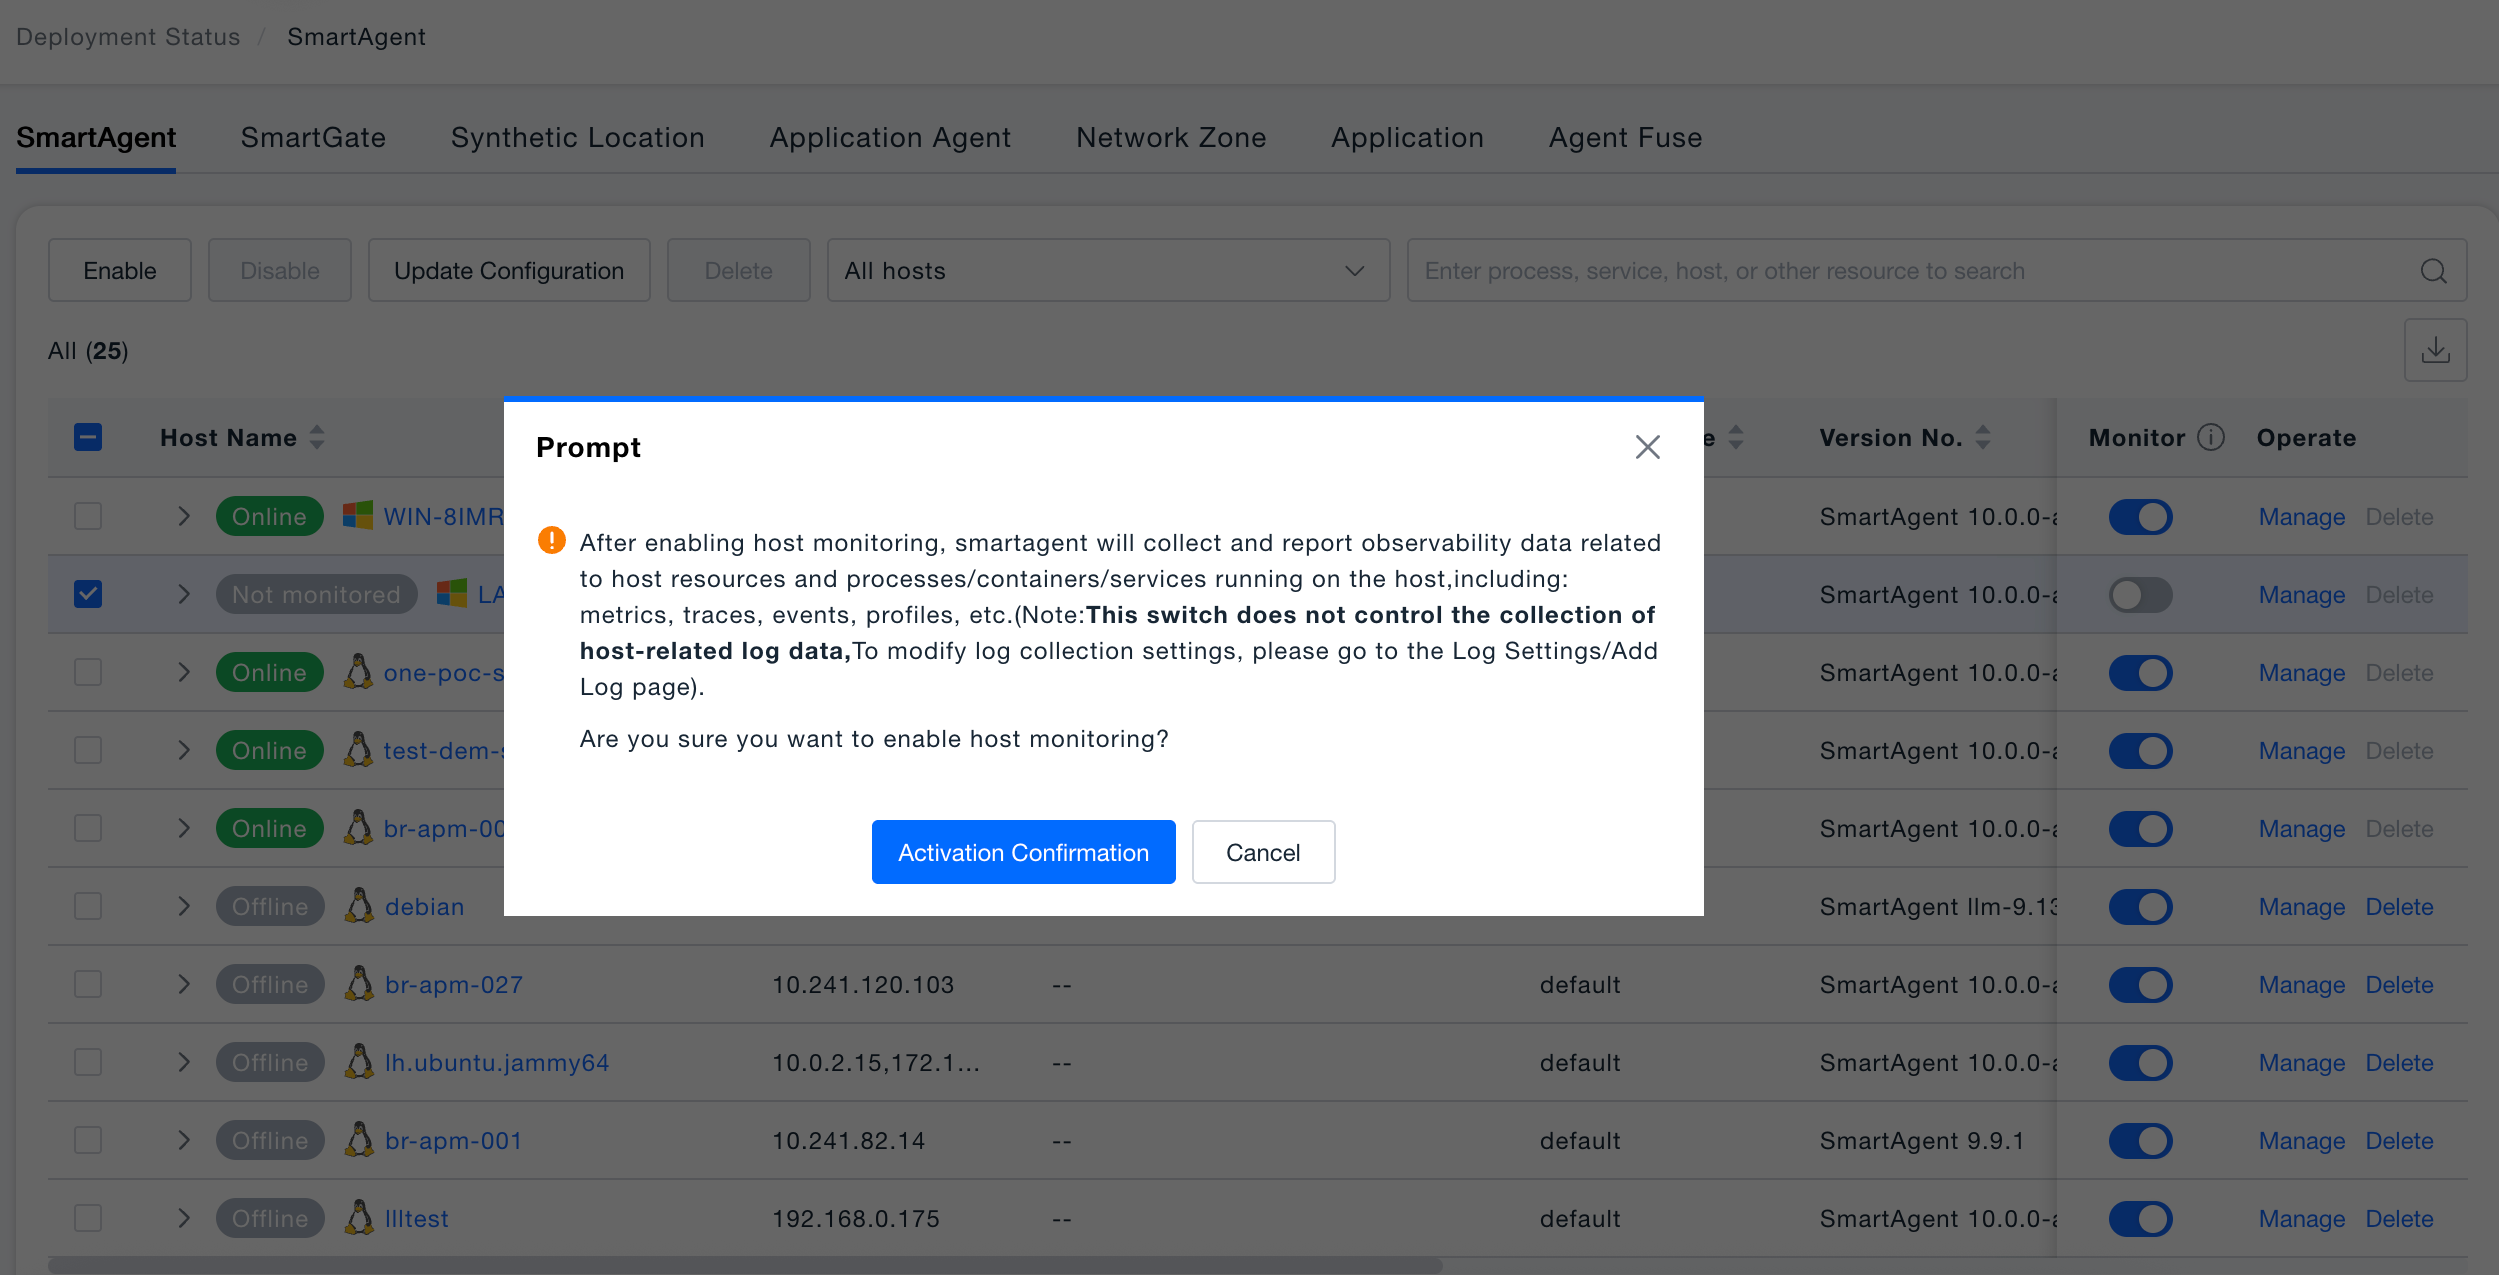
In the action bar at the top of the host list, there are four batch management capabilities: Enable, Disable, Update Configuration, and Delete. You can select one or multiple hosts and then execute operations to help administrators efficiently manage large-scale probe deployments.
Enable: Reactivates disabled host probes and restores full observability data collection for that host. Suitable for scenarios where host maintenance is completed or test environments come online.
- Scope: Restores collection of full data including host metrics, processes, containers, and services.
- Use Cases: When host maintenance is complete and the host is restored to monitoring, or when test hosts are officially put into production.
- Operation Restrictions: Only effective for hosts currently in "Disabled" status; online hosts do not need to be re-enabled.
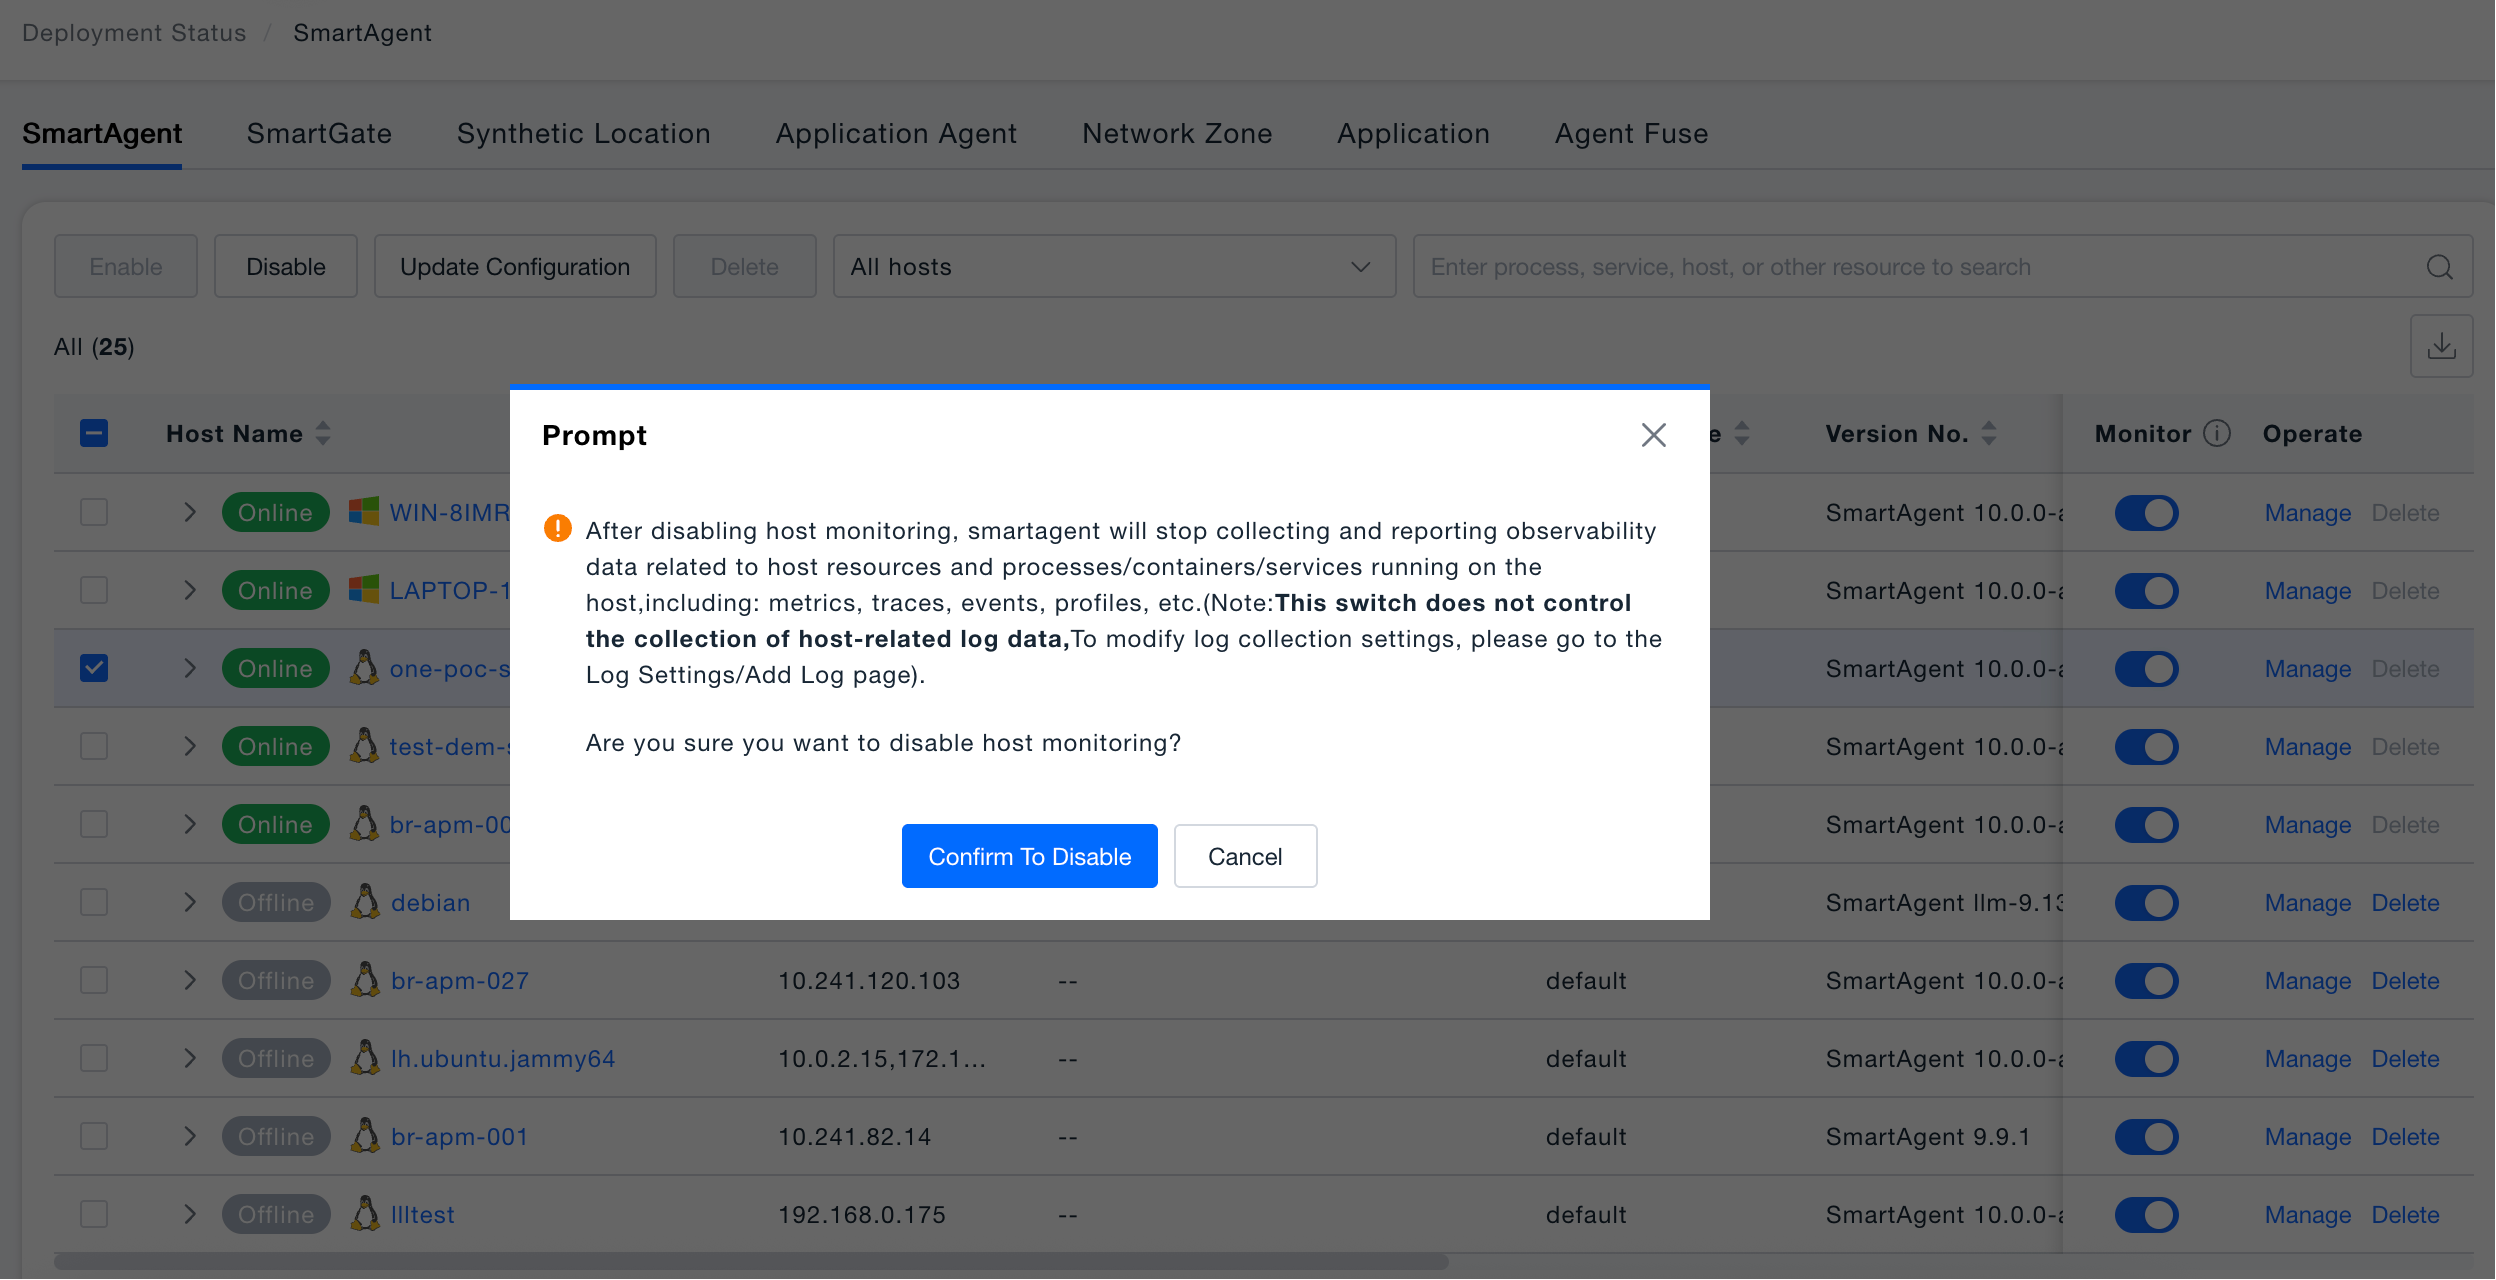
Disable: Pauses probe data collection for selected hosts. The probe process itself continues to run but stops reporting any observability data. Suitable for scenarios where hosts enter maintenance windows or require pre-offline preprocessing, avoiding invalid data that could interfere with alerting and analysis.
- Scope: Pauses all monitoring data reporting including metrics, call chains, events, and Profile data for this host.
- Non-affected Scope: Log data collection is not controlled by this switch. To stop log collection, please go to the "Log Configuration / Add Log" page for separate operations.
- Use Cases: Used during planned host maintenance, grayscale offline, or when temporarily isolating abnormal hosts.
- Secondary Confirmation: After clicking disable, a confirmation popup will appear explaining the impact scope. You must click "Confirm Disable" for it to take effect, preventing accidental operations.
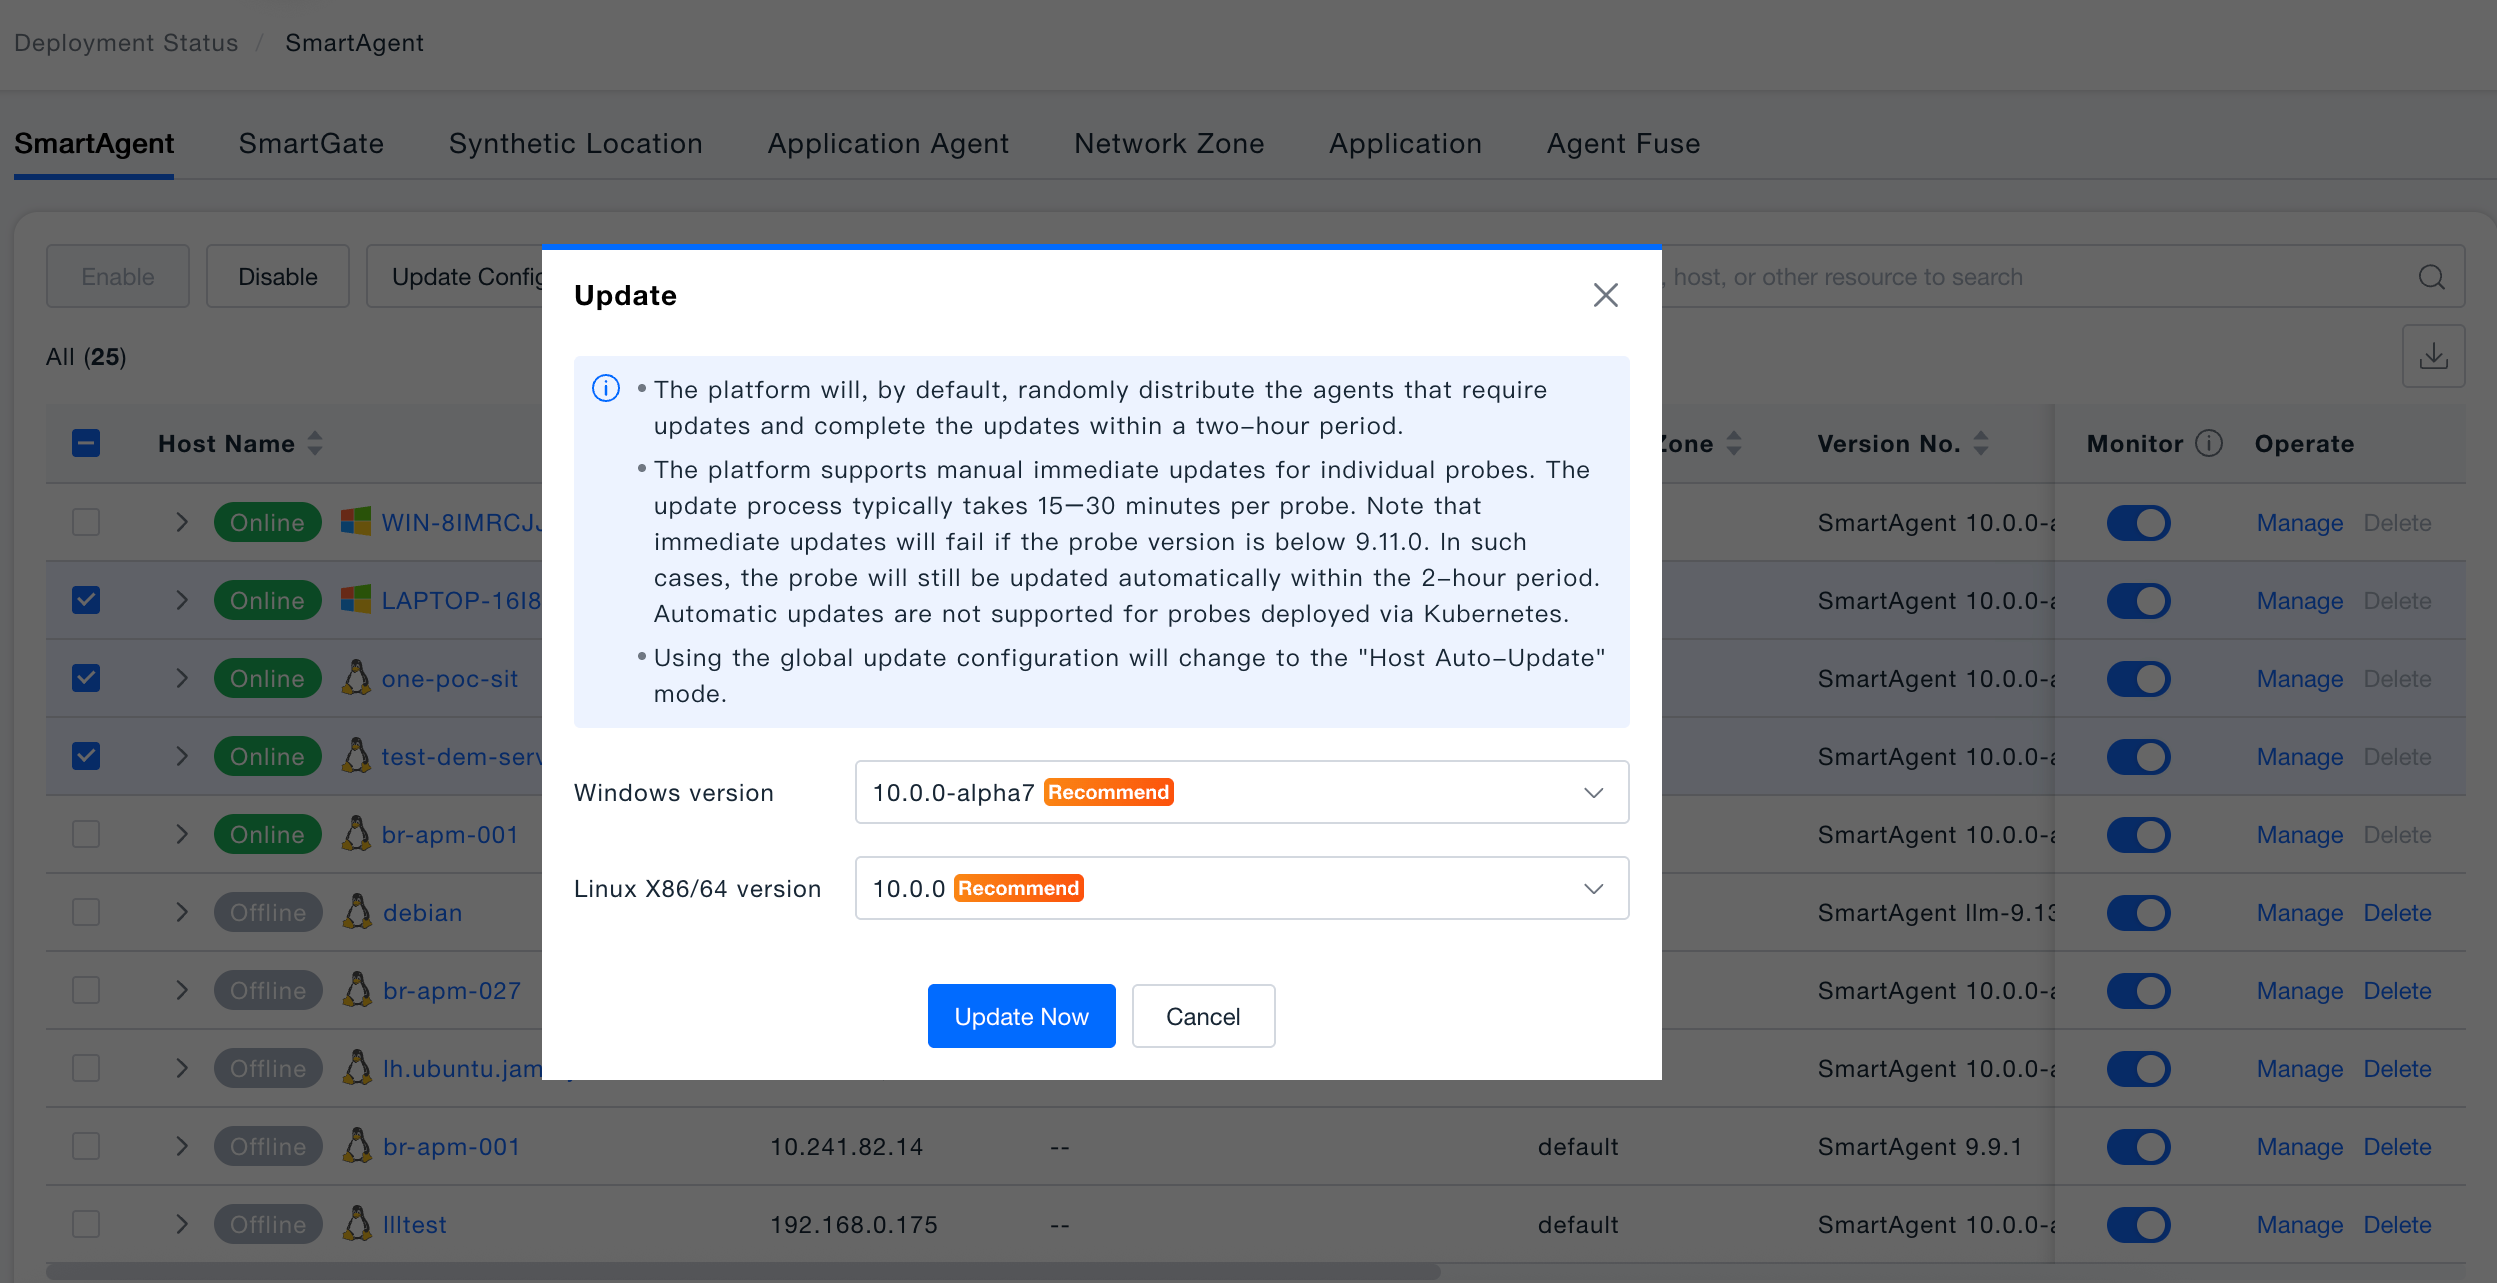
Update Configuration: Performs version upgrades on SmartAgent probes running on selected hosts, supporting batch updating of multiple hosts' probes to the specified version immediately.
- Update Strategy: By default, the platform randomly distributes the probes to be updated and completes the update in batches within 2 hours, reducing concentrated impact on business.
- Immediate Update: Supports manually triggering immediate update (only applicable for probe versions ≥ 9.11.0), expected to take 15-30 minutes; if the probe version does not meet the requirements, it will fall back to automatic update within 2 hours.
- Version Selection: The popup provides a list of available versions with "Recommended" and "NEW" labels; the platform's recommended version is selected by default.
- Automatic update via Kubernetes deployment is not currently supported.
- Hosts that have selected "Use global update configuration" will switch to "Host automatic update" mode after execution.
- To avoid conflicts between manual and automatic updates, please go to "Installation Configuration → Deployment Update" and turn off the SmartAgent automatic update switch before executing manual update configuration.
Delete: Removes selected offline hosts from the platform's probe management list, releasing the host's management records and associated configurations. Applicable when hosts have been taken offline or need to be re-registered.
Configuring Process Monitoring Rules
To configure process monitoring rules specifically for an individual host (independent of global configuration), click "Manage" in the host's action column, then navigate to the "Process Rules" section within the host configuration. This module is primarily used to configure APM agent auto-injection rules, enabling service identification and deep call chain monitoring for processes.
Toggle Configuration:
- Host Configuration Toggle: Controls whether "Individual Configuration" is enabled for this host. If disabled, global monitoring configuration is followed.
- Process Rule Toggle: Controls whether process monitoring for this host uses "Individual Configuration". If disabled, global process monitoring configuration is followed.
The host's process monitoring will only prioritize using custom rules and preset rules (instead of relying on global configuration) when both the "Host Configuration Toggle" AND the "Process Rule Toggle" are enabled.
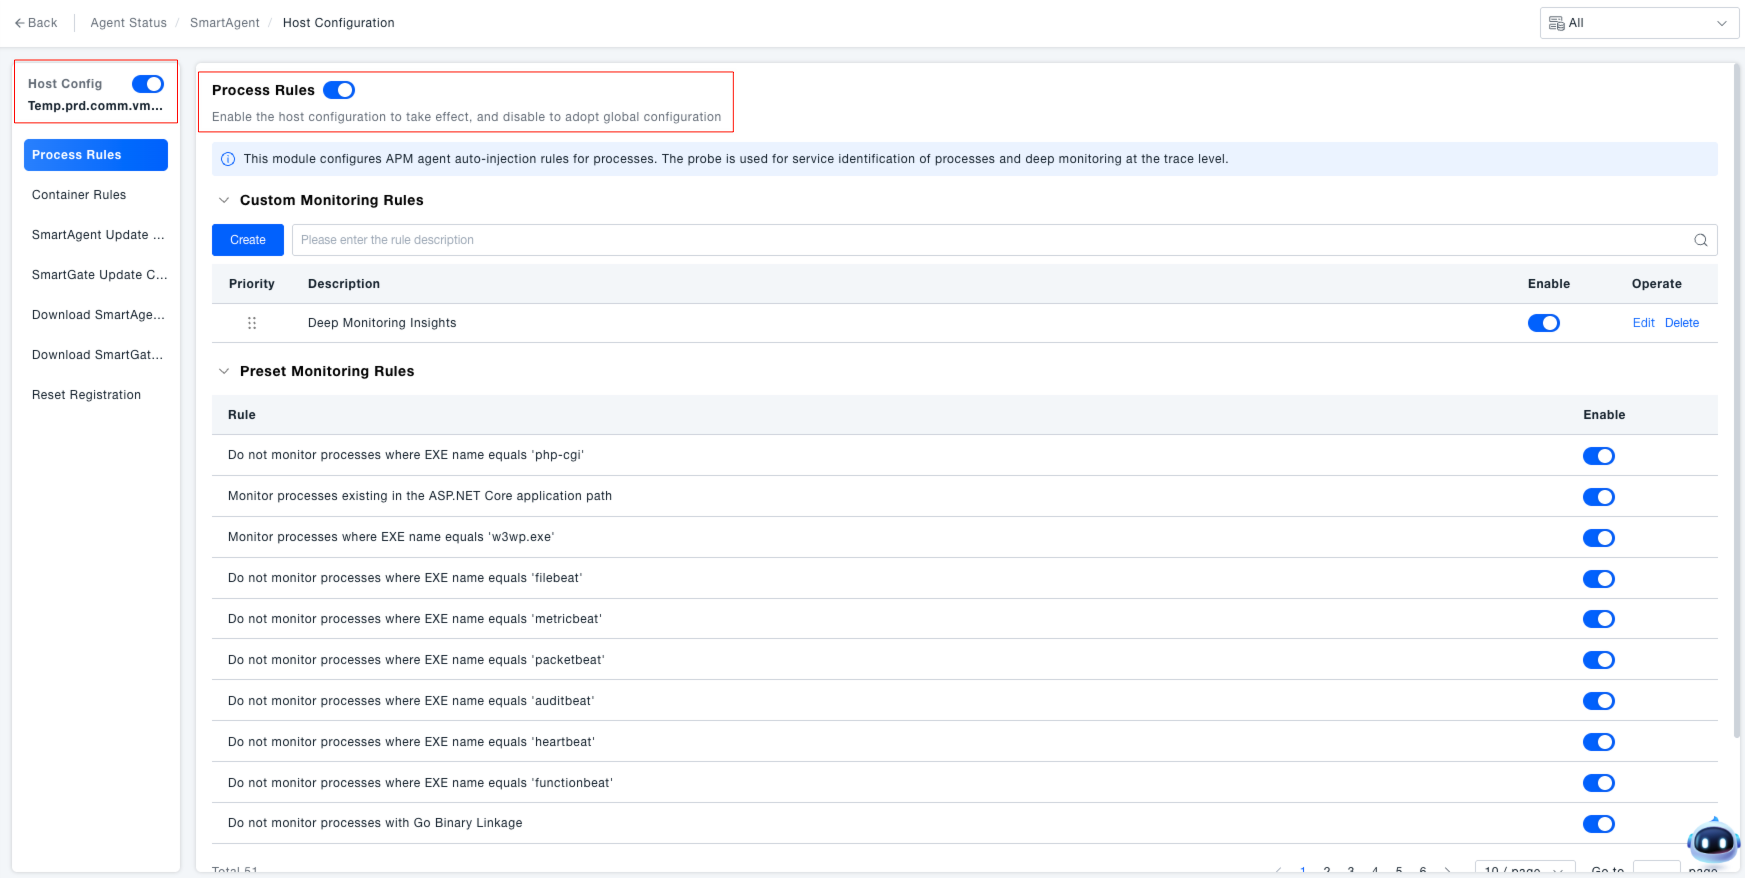
Managing Monitoring Rules: Manage rules to achieve "targeted process monitoring," avoid ineffective monitoring, and ensure the validity of core process monitoring.
- Custom Monitoring Rules: Process monitoring rules configured by the administrator based on business needs.
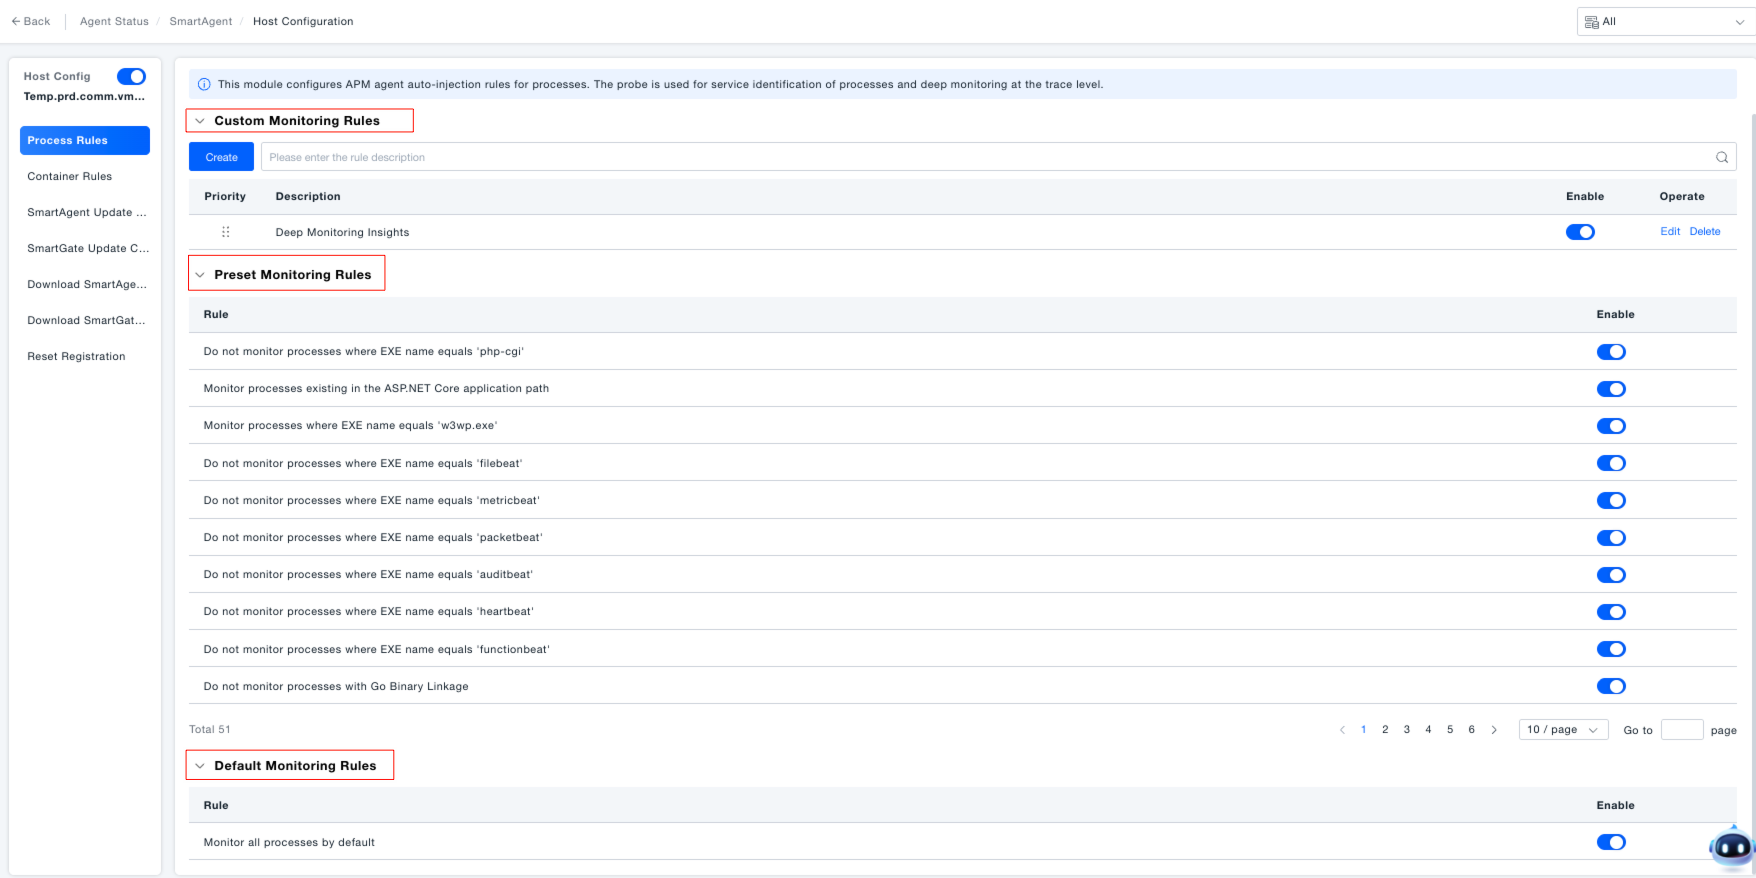
- Preset Monitoring Rules: System-built generic rules, mainly used to exclude processes without monitoring significance (e.g., "Do not monitor processes where EXE name is 'php-cgi'", "Monitor processes where ASP.NET Core application path exists"). They can be enabled/disabled via their toggle switches.
- Default Monitoring Rule: The "Monitor all processes" rule is enabled by default and serves as the foundation for process monitoring.
If "Monitor all processes by default" is disabled, agents will no longer be injected into applications on this host, and simultaneously, preset rules and custom rules will become ineffective, resulting in the suspension of process monitoring functionality.
Creating Custom Monitoring Rules: Administrators can flexibly configure process monitoring rules based on actual application scenarios for precise process monitoring management.
- Click the "Create" button in the "Custom Monitoring Rules" area.
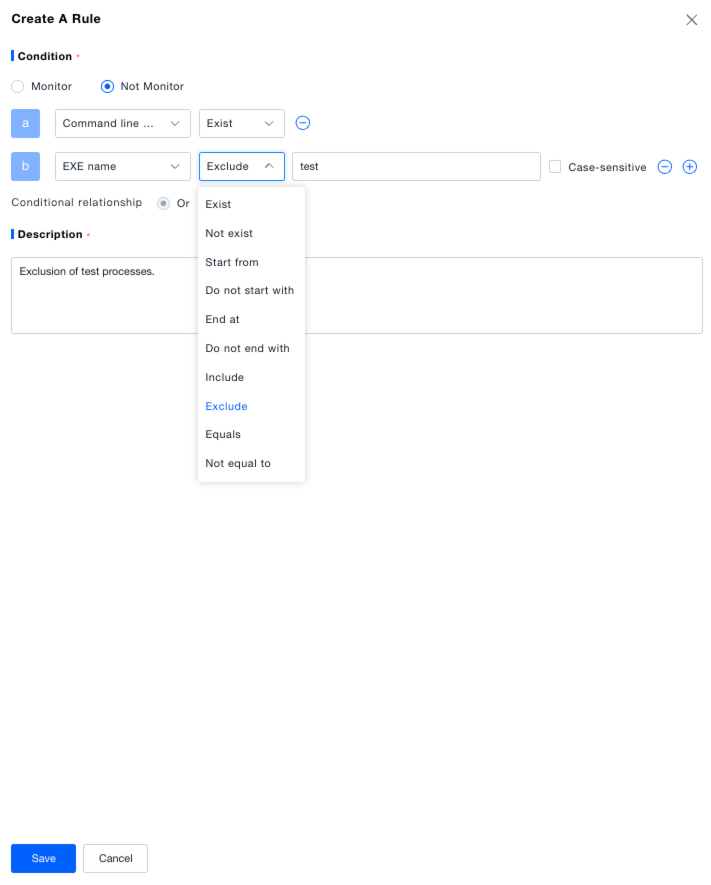
- In the pop-up window, select the rule type: Monitor (requires data collection for this process type) or Do Not Monitor (excludes this process type).
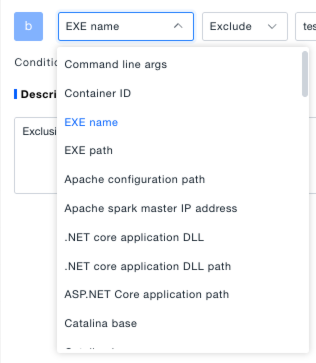
- Add filter criteria: Select condition types like "Command Line Args", "Container ID", "EXE Name", "EXE Path" from the dropdown, and set the match relationship (e.g., "Exists", "Contains", "Equals").
- Enter a rule description (to facilitate future identification of the rule's purpose), and click "Save" to complete creation.
Configuring Container Monitoring Rules
In containerized deployment scenarios (e.g., Kubernetes, Docker environments), if you need to configure container monitoring rules specifically for an individual host, click "Individual Configuration" in the host's action column, then navigate to the "Container Rules" section within the host configuration. This module is used to configure APM agent auto-injection rules, enabling service identification and deep call chain monitoring for processes within containers.
Toggle Configuration:
- Host Configuration Toggle: Controls whether "Individual Configuration" is enabled for this host. If disabled, global monitoring configuration is followed.
- Container Rule Toggle: Controls whether container monitoring for this host uses "Individual Configuration". If disabled, global container monitoring configuration is followed.
The host's container monitoring will only prioritize using custom rules and preset rules (instead of relying on global configuration) when both the "Host Configuration Toggle" AND the "Container Rule Toggle" are enabled.
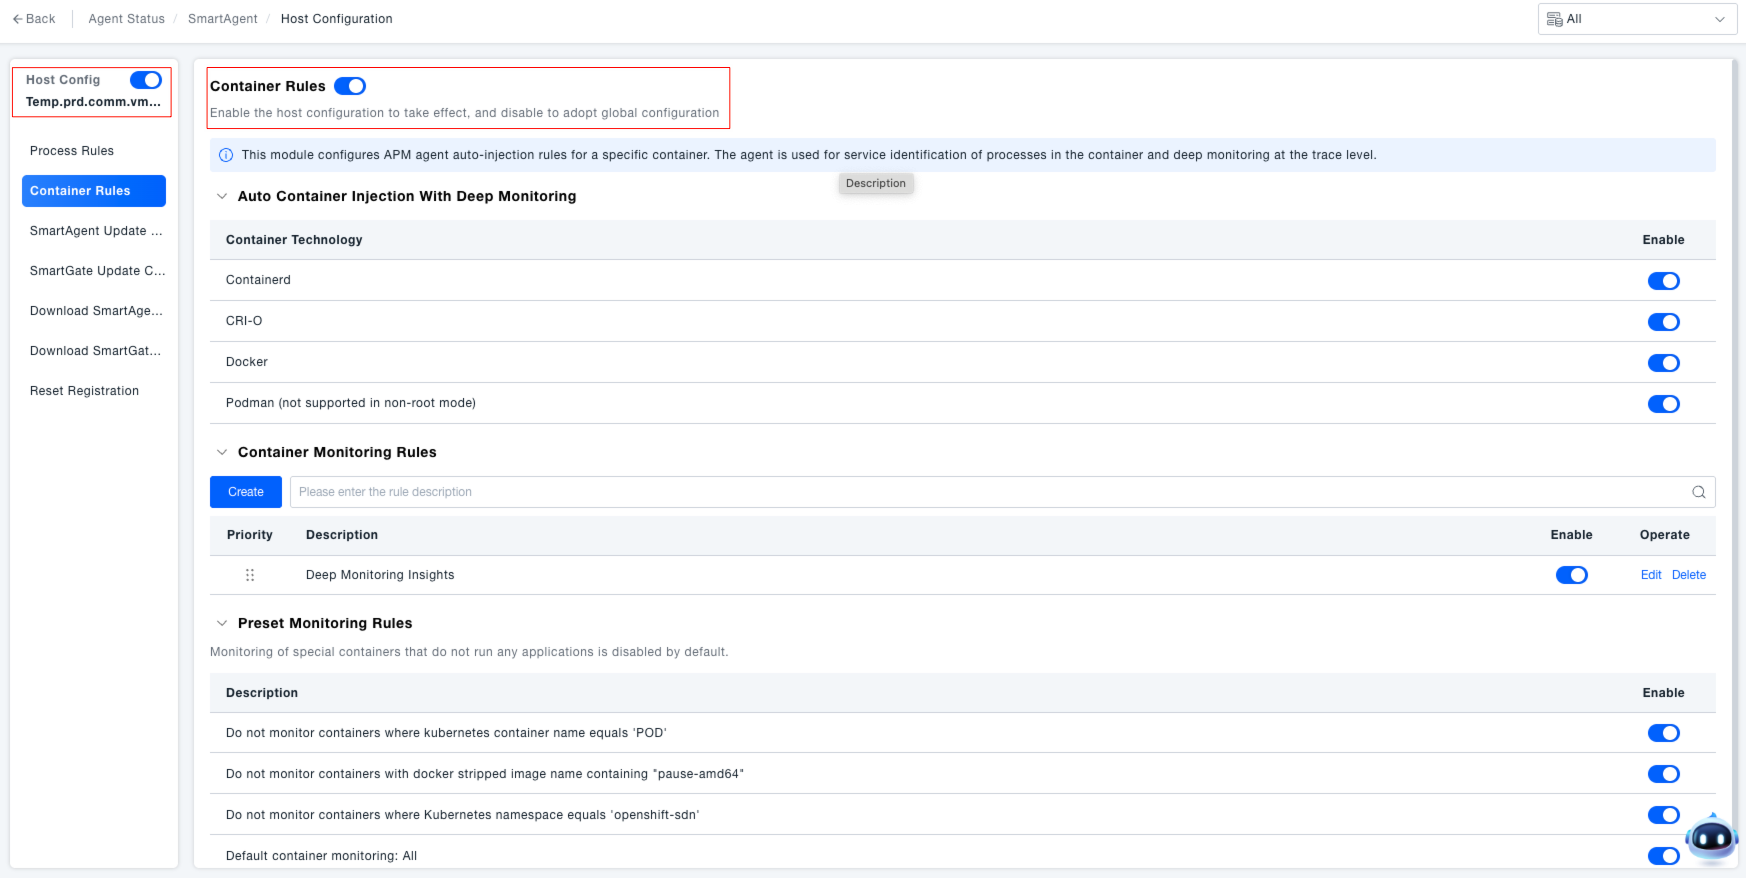
Managing Monitoring Rules: Manage rules to achieve "targeted container monitoring," ensuring the stable operation of containerized applications while avoiding resource consumption from ineffective monitoring.
- Set Automatic Container Injection: In the "Automatic Container Injection for Deep Monitoring" area, use the toggle switches to control whether agent auto-injection is enabled for container technologies like Containerd, CRI-O, Docker, Podman (non-root mode not supported).
- Custom Container Monitoring Rules: Rules created by administrators based on business requirements (e.g., "Monitor containers with Docker image version 'v1.0.0'").
- Preset Monitoring Rules: System-built generic rules used to exclude containers without monitoring significance (e.g., "Do not monitor Kubernetes containers where container name equals 'POD'", "Do not monitor Docker stripped image names containing 'pause-amd64'"). They can be enabled/disabled via their toggle switches.
- Monitor All Containers by Default: The "Monitor all containers" rule is enabled by default and serves as the foundation for container monitoring.
If "Monitor all containers by default" is disabled, agents will no longer be injected into containers on this host, and simultaneously, preset rules and custom rules will become ineffective, resulting in the suspension of container monitoring functionality.
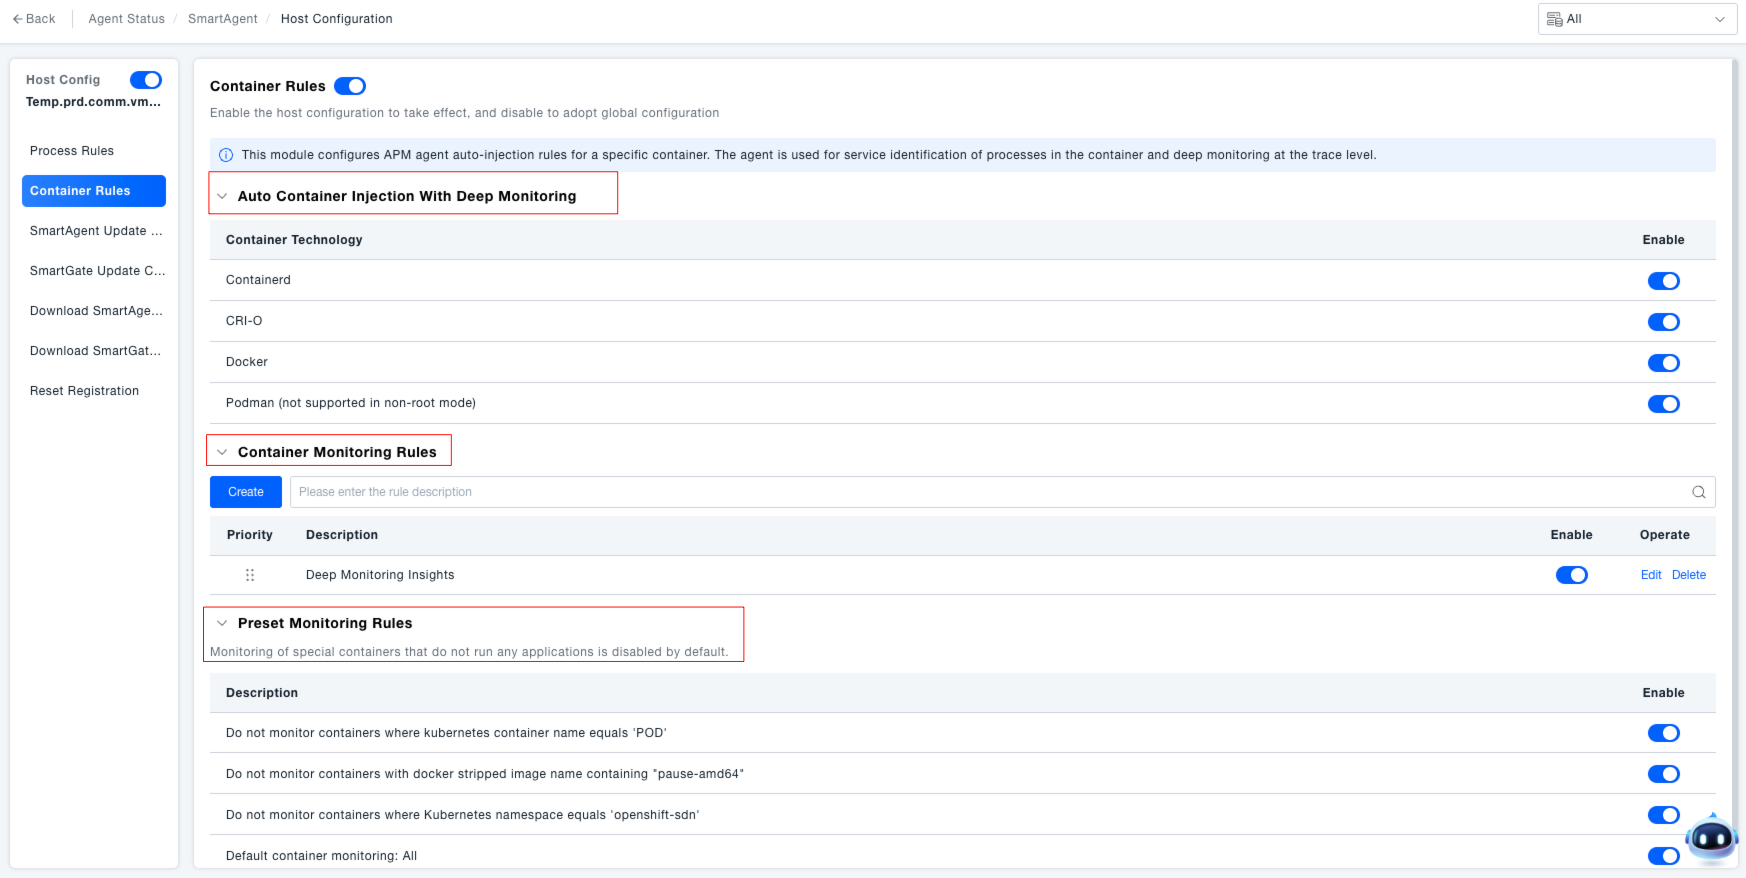
Creating Container Monitoring Rules: Administrators can flexibly configure container monitoring rules based on actual application scenarios for precise container monitoring management.
- Click the "Create" button in the "Container Monitoring Rules" area.
- In the pop-up window, select the rule type: Monitor or Do Not Monitor.
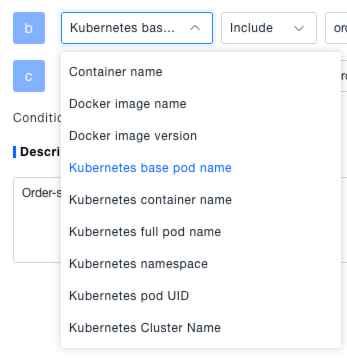
- Add filter criteria: Select condition types like "Container Name", "Docker Full Image Name", "Docker Image Version", "Kubernetes Base Pod Name" from the dropdown, set the match relationship (e.g., "Exists", "Starts With", "Equals", "Contains"), optionally check "Case Sensitive", and add multiple conditions (multiple conditions have an "AND" relationship).
- Enter a rule description, and click "Save" to complete creation.
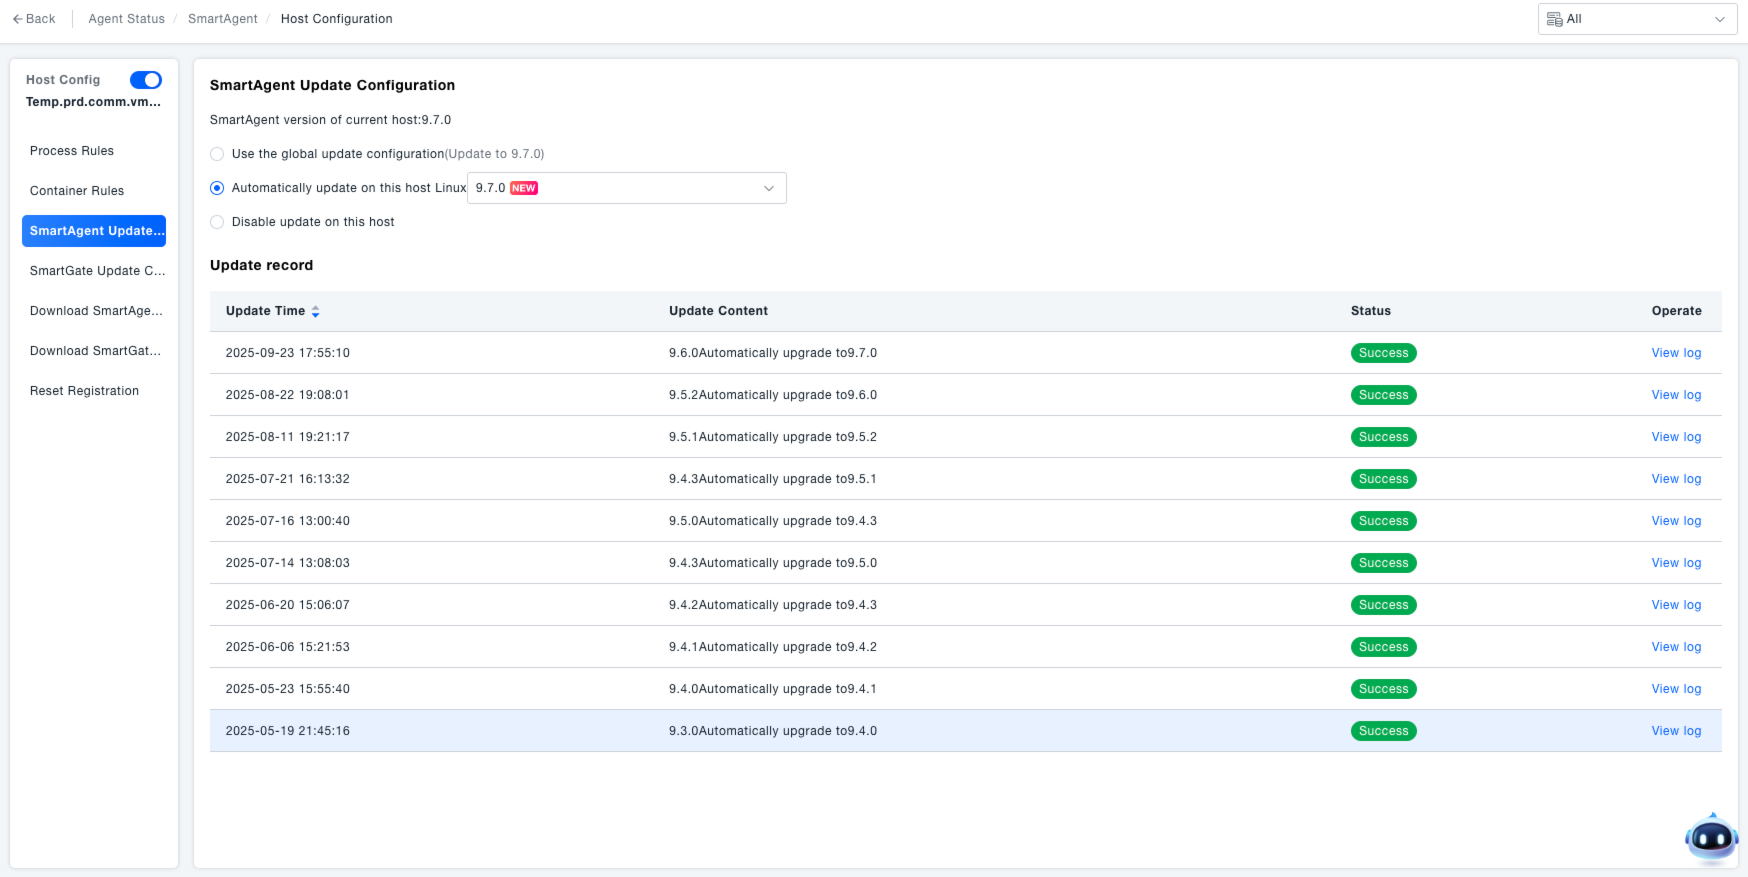
Updating SmartAgent Configuration
Navigate to the "SmartAgent Update Configuration" section within the host configuration. This interface is used to manage version updates for the SmartAgent on this host, ensuring the tool's functionality aligns with system requirements.
Select Update Method:
- If "Use global update configuration" is selected, the host follows the globally set SmartAgent update configuration.
- Select "Automatically update Linux on this host", and choose the target version (e.g., 9.7.0) from the dropdown menu to automatically update SmartAgent on this host to the specified version.
- Select "Disable updates on this host" to prevent the SmartAgent on this host from performing automatic updates.
View Update Records:
- In the "Update Records" section, view information such as update time, update content, and status.
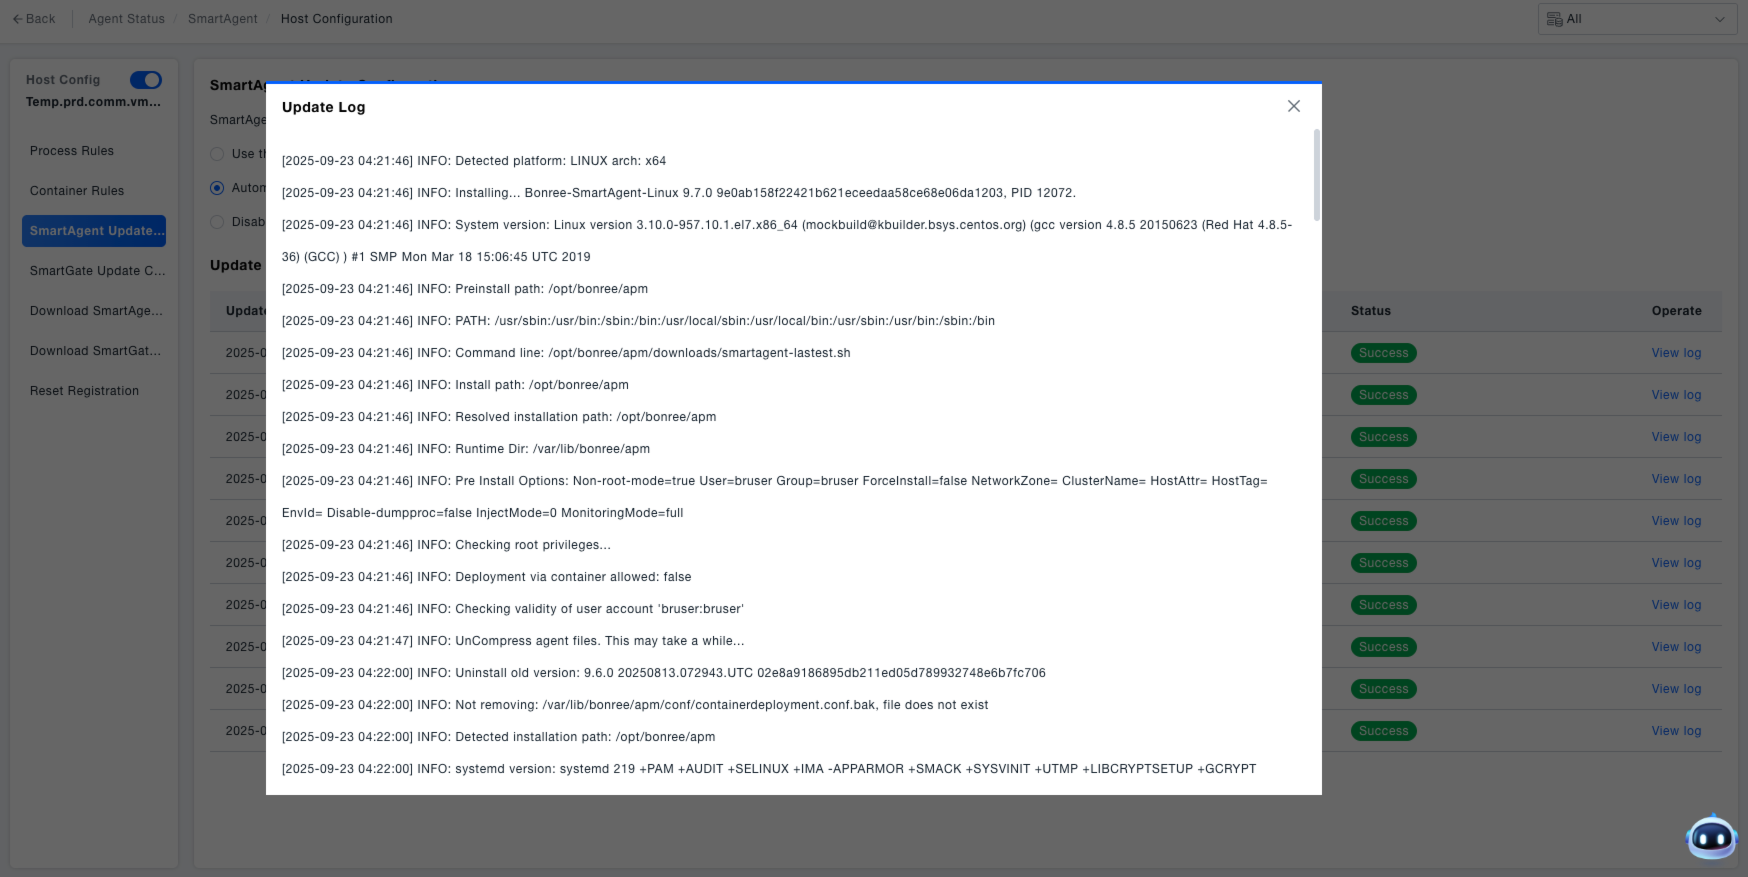
- Click "View Log" to see detailed update logs and check for any anomalies during the update process.
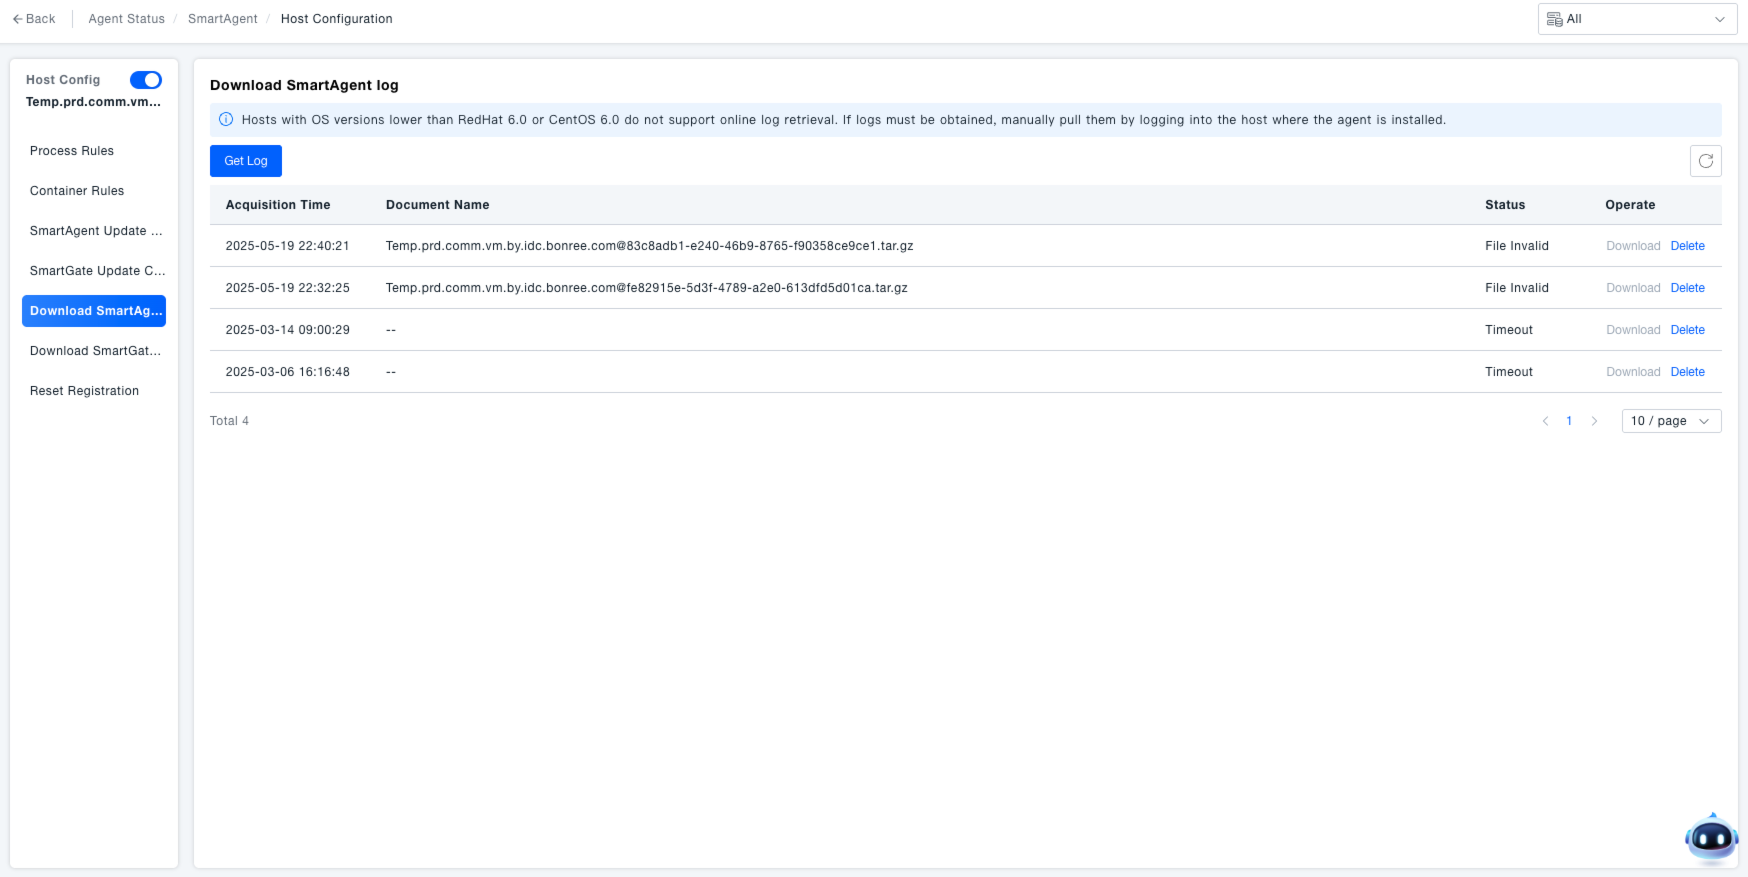
Downloading SmartAgent Logs
Navigate to the "SmartAgent Log Download" section within the host configuration. This interface is used to obtain SmartAgent runtime logs to assist in troubleshooting monitoring anomalies (e.g., data collection interruption, metric errors).
Fetch Logs: Click the "Fetch Logs" button. The system will begin retrieving the SmartAgent logs.
Manage Logs:
- After logs are fetched, view information such as fetch time, file name, and status in the list.
- For logs with a "Success" status, click "Download" to save the log file locally for subsequent problem analysis.
- Click "Delete" to remove the log record.
Online log retrieval is not supported for hosts with operating system versions lower than redhat6.0 or centos6.0. Logs must be manually pulled by logging into the machine where the agent resides.
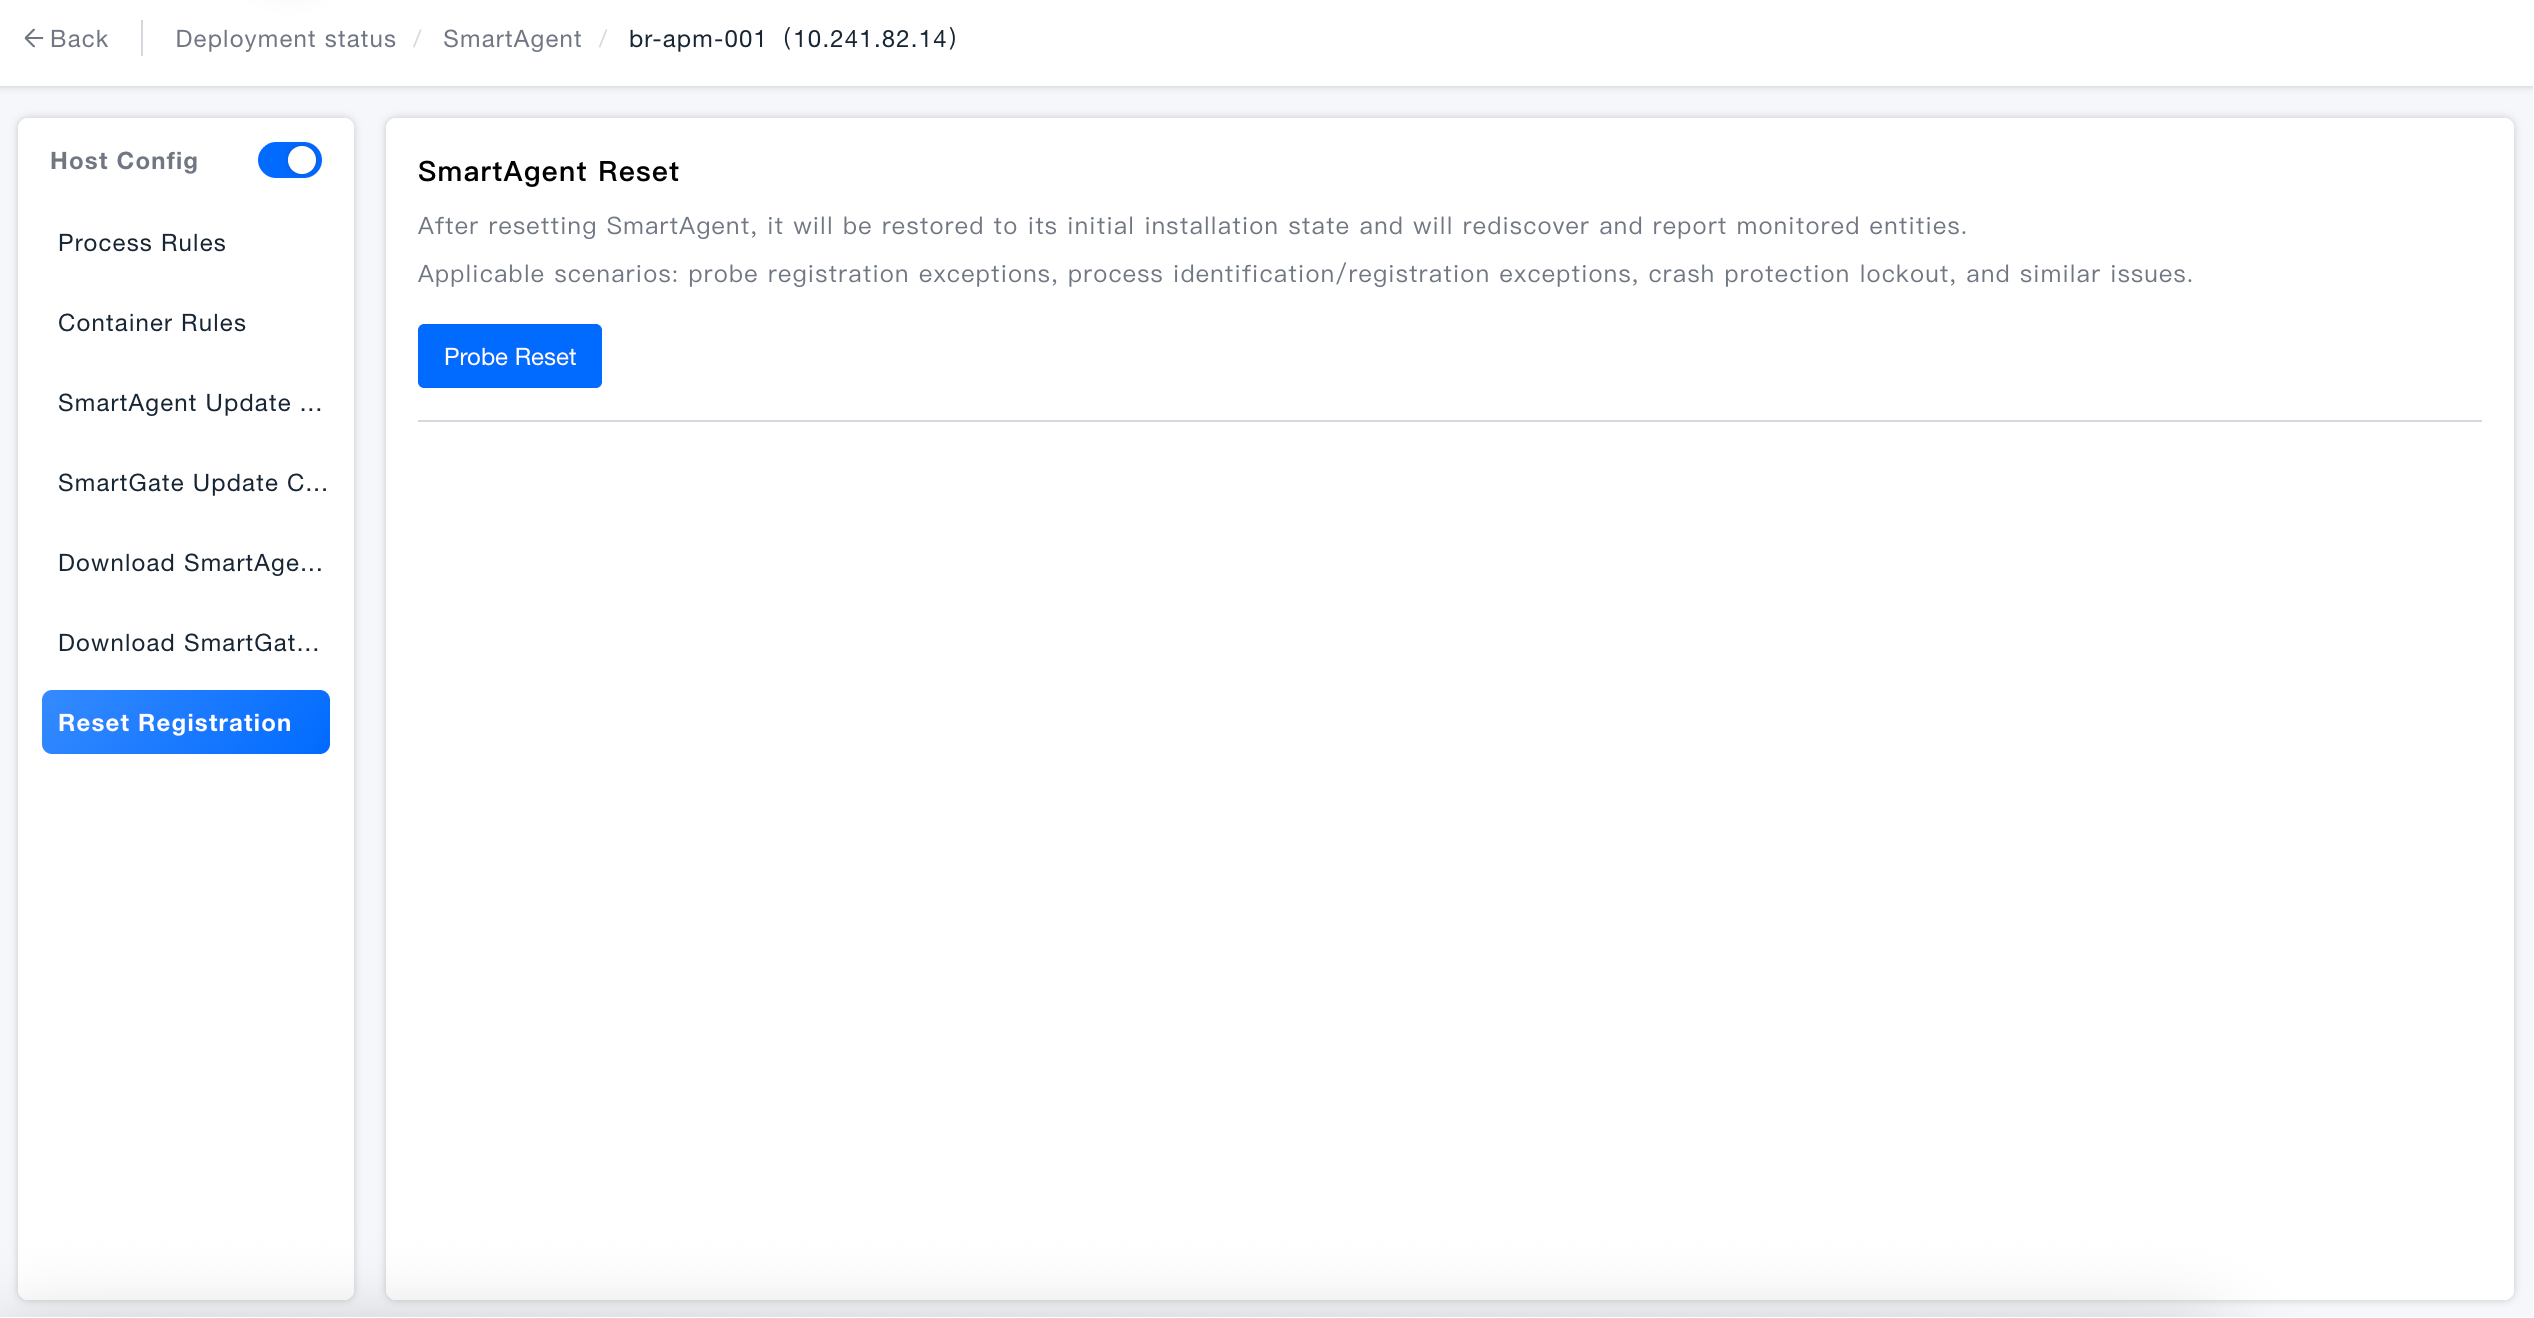
Registration Reset
Navigate to the "Registration Reset" section within the host configuration. This is used to resolve severe anomalies with SmartAgent (e.g., registration anomalies, crash protection lockout) by resetting it to its initial state.
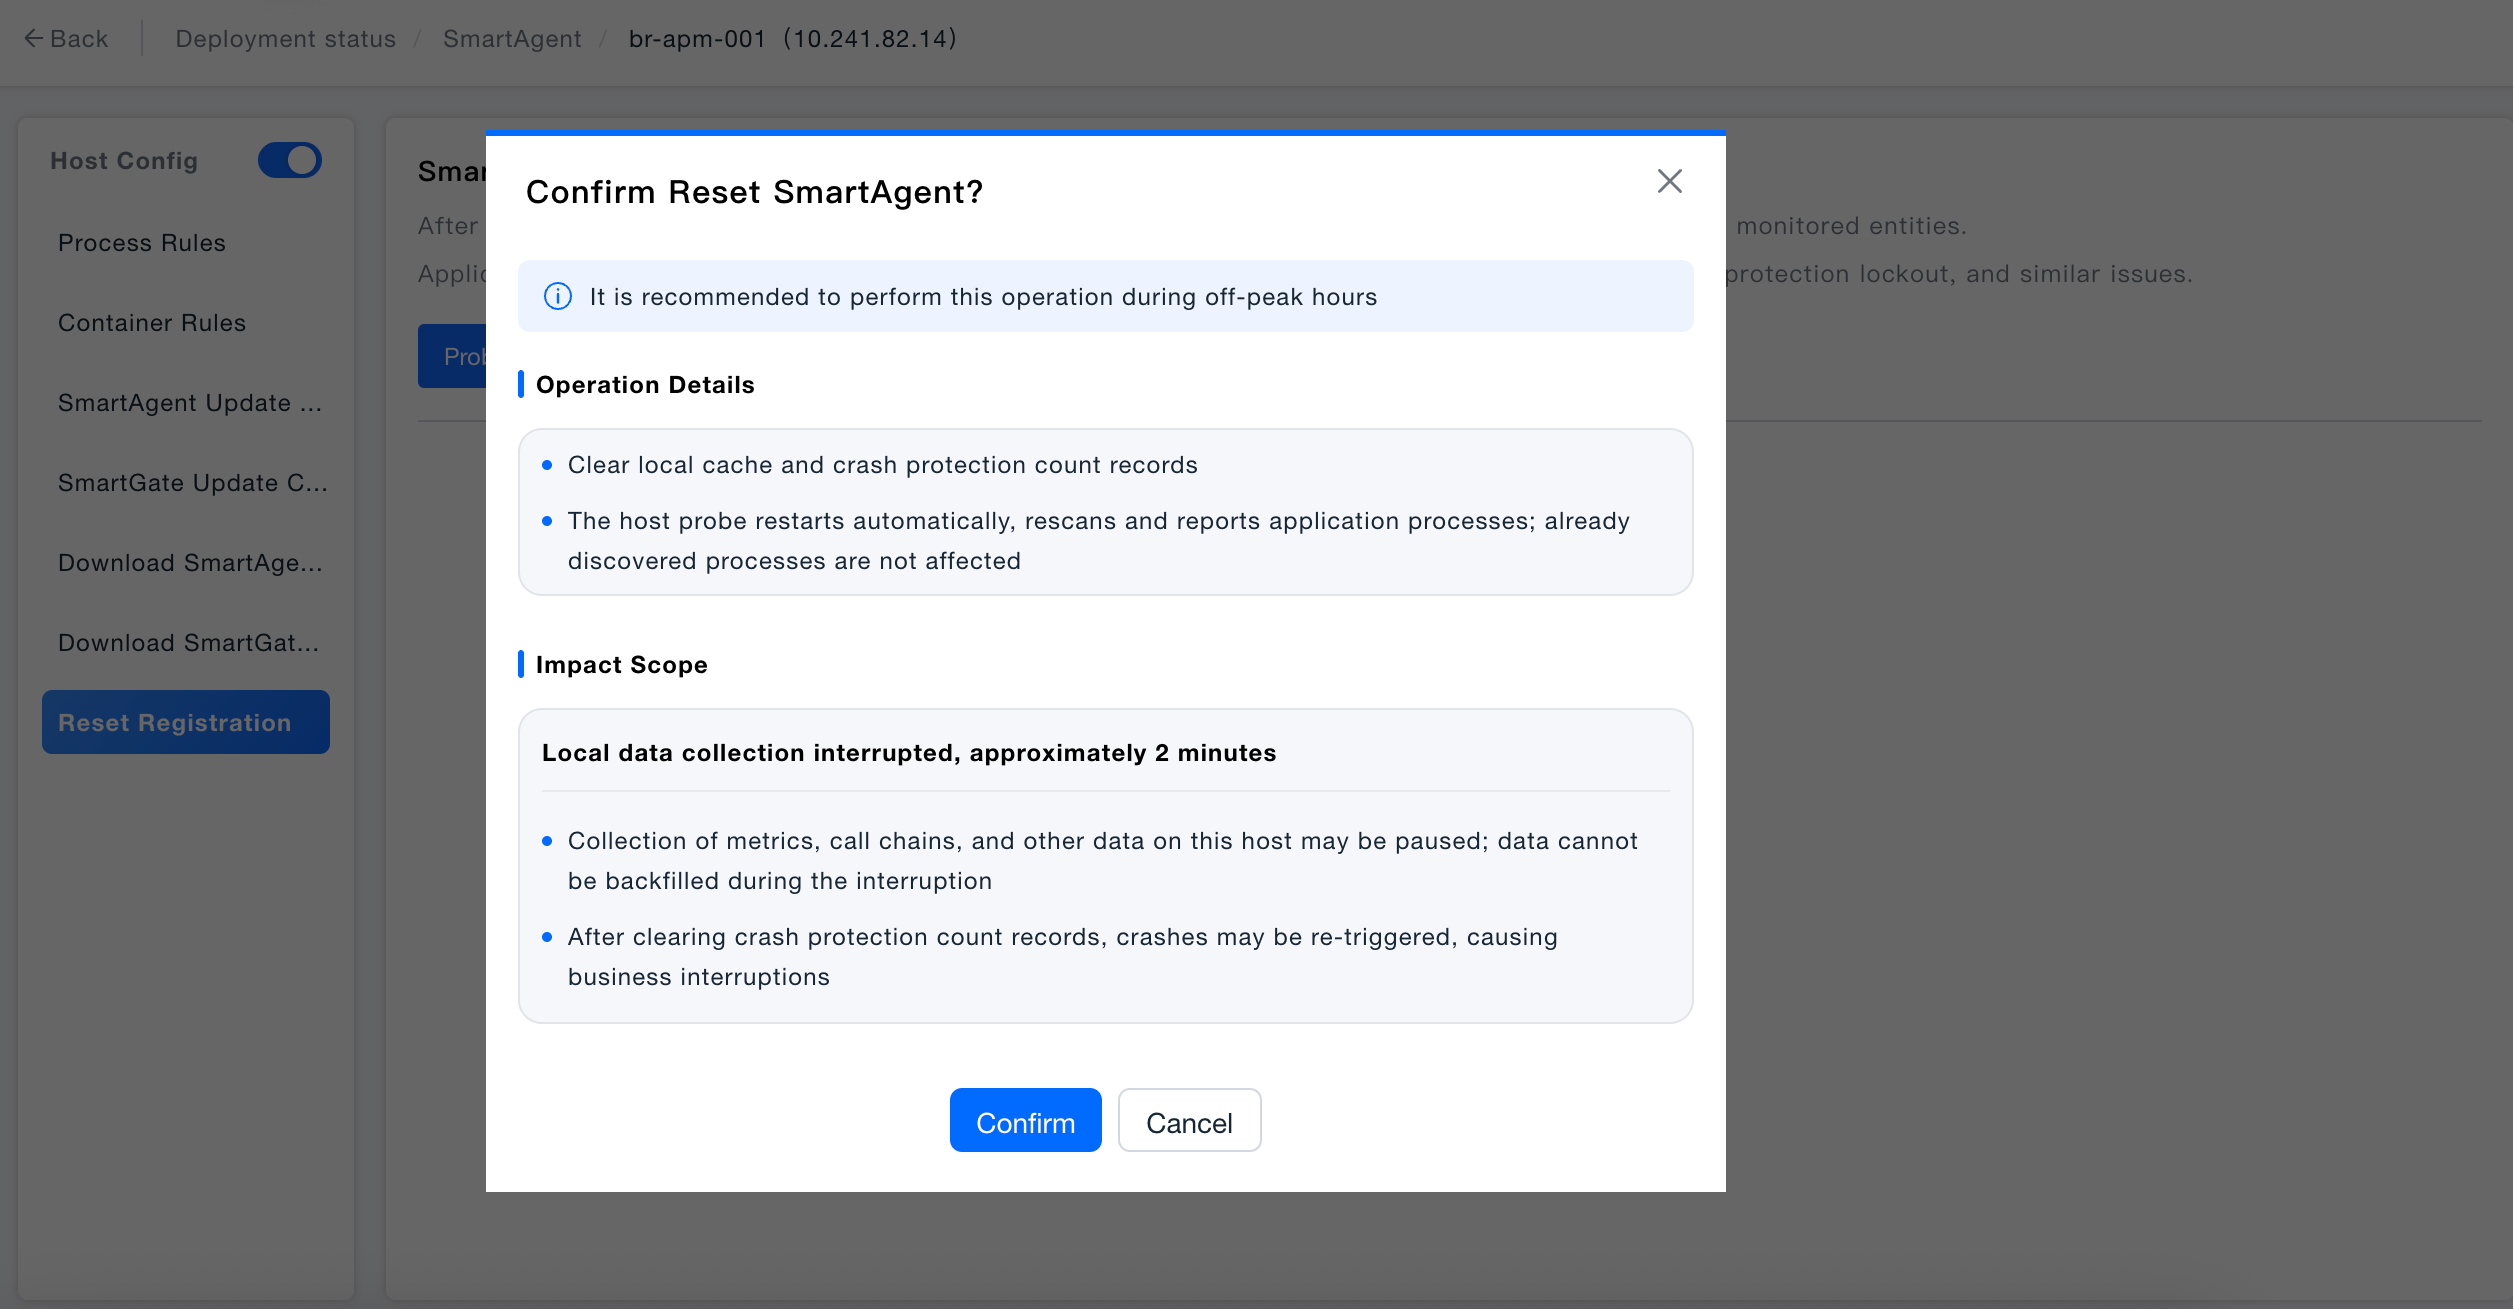
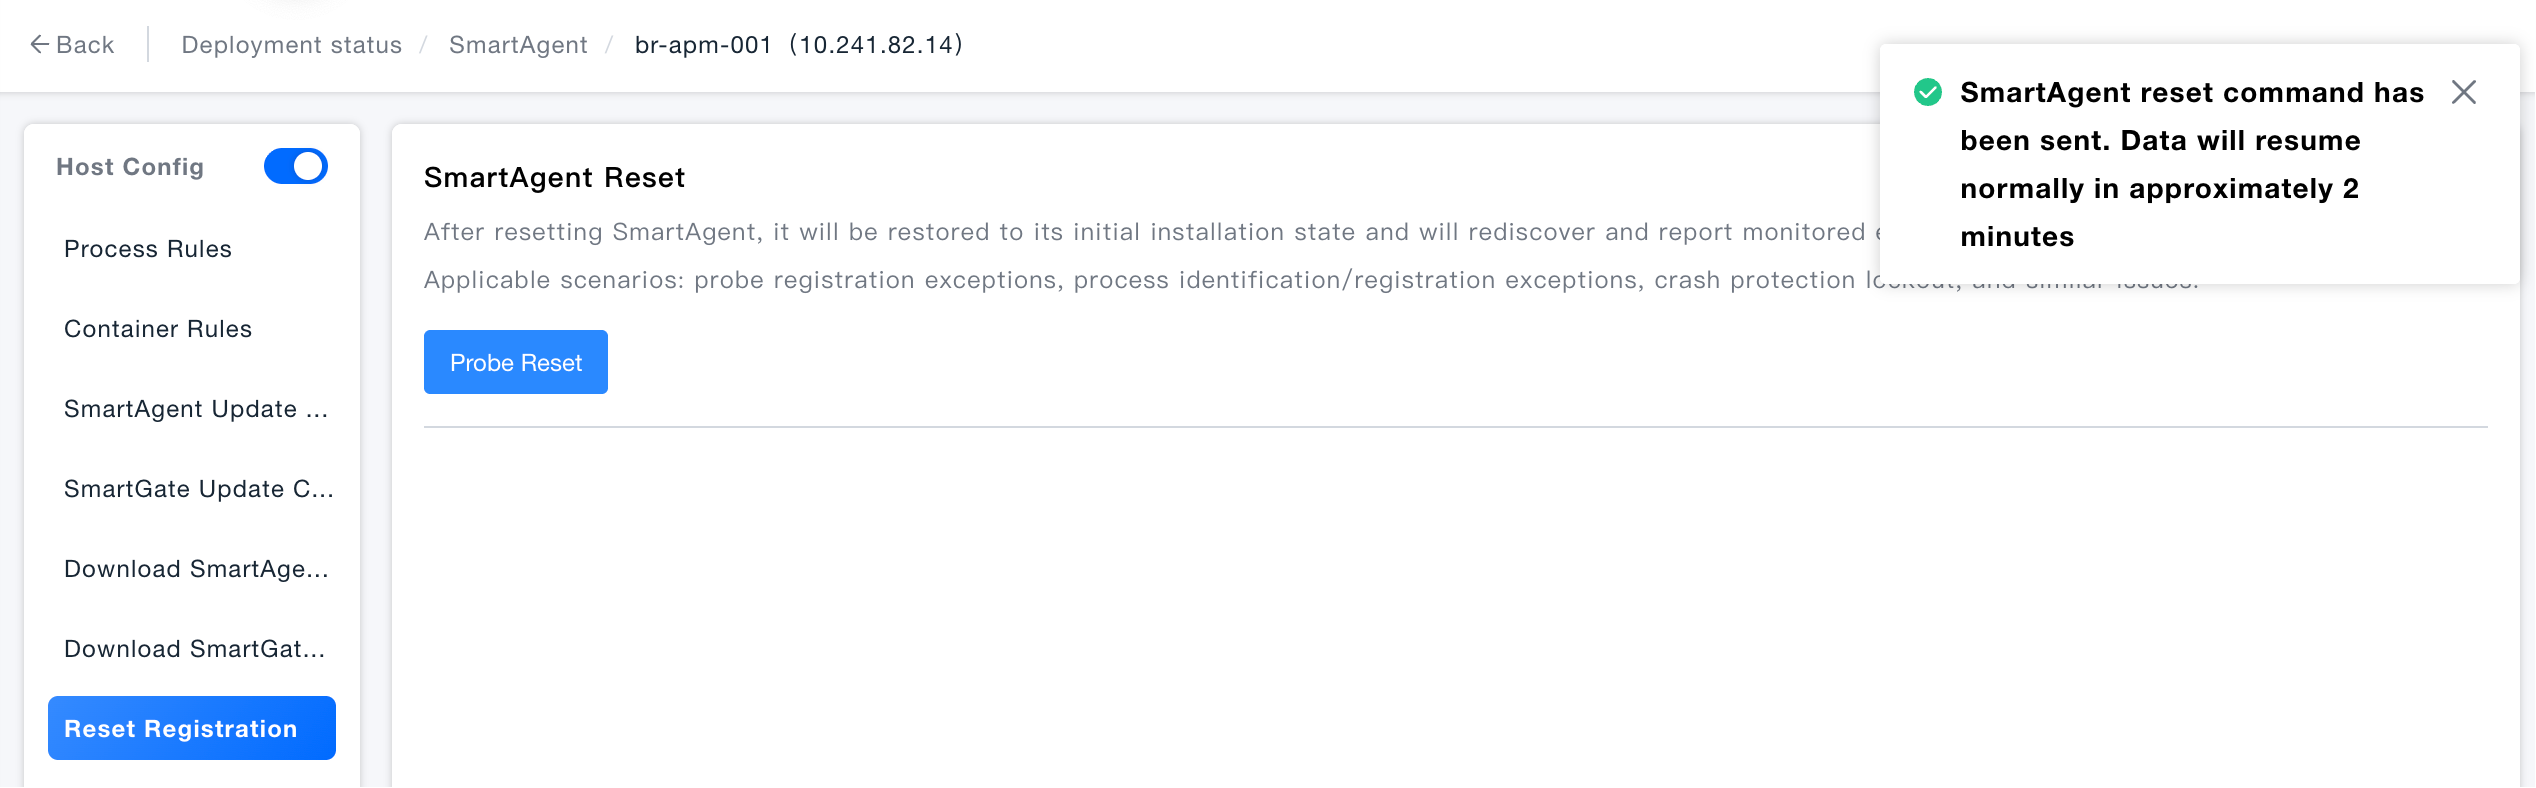
Reset SmartAgent: Click the "Agent Reset" button under "SmartAgent Reset" to restore SmartAgent to its initial installation state and re-discover and report monitoring entities.
- Clears local cache and crash protection count records
- The host agent automatically restarts, rescans and reports application processes; already discovered processes are not affected
- Metrics, call chains and other data for this host may pause collection, and cannot be backfilled during the interruption period
- After the crash protection count is cleared, crashes may be triggered again causing business interruptions