Application Agent
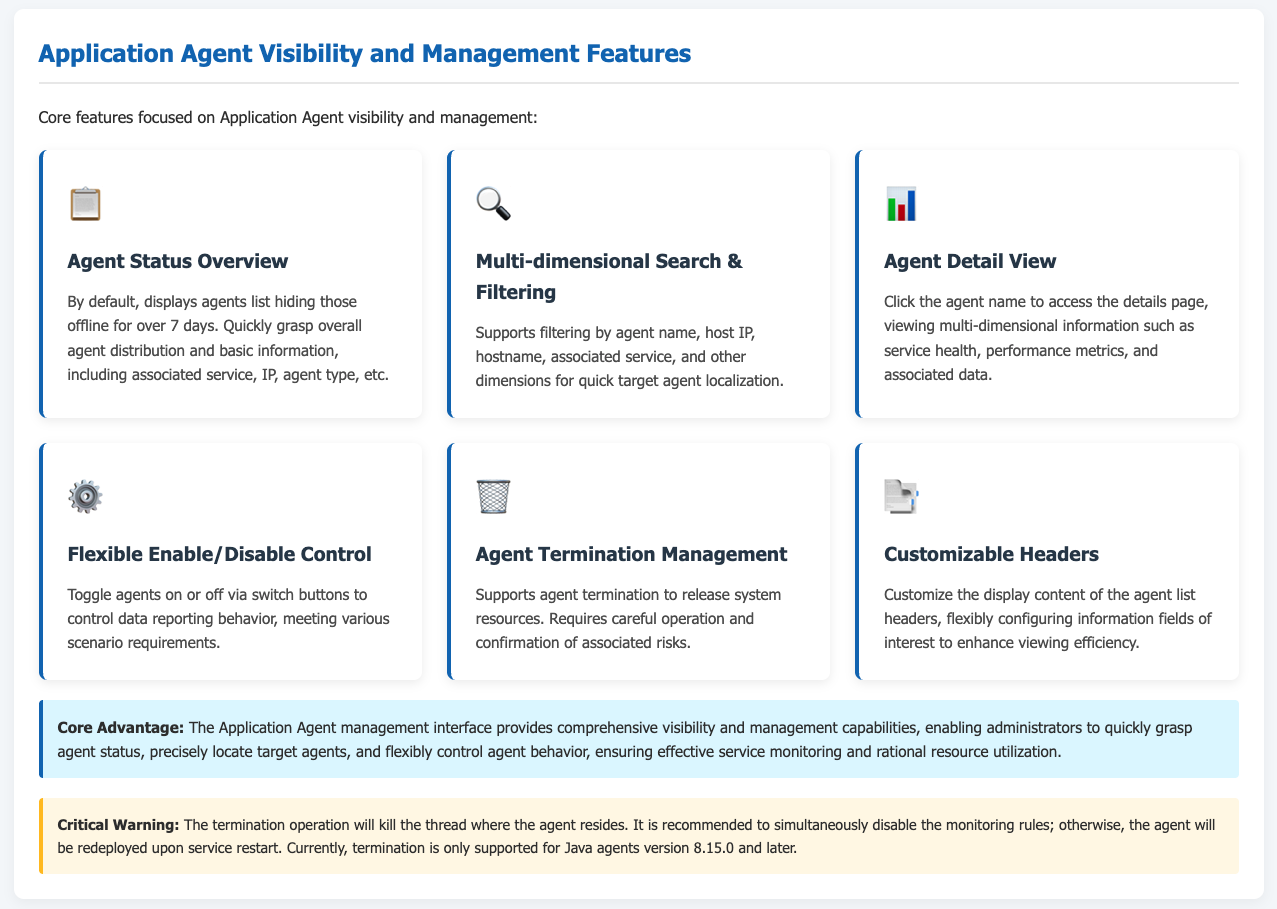
Application Agent are a key component of the ONE platform used for monitoring services. They enable real-time collection of various operational data, such as response time, request error rate, and throughput. Using Application Agent, users can accurately grasp the operational status of their services, promptly detect service anomalies, and provide robust data support for service optimization and fault diagnosis, thereby helping to ensure high service availability and stability.
Prerequisites
To use the Service Probe functionality, ensure that your service is properly deployed and the network environment is stable, capable of supporting data transmission between the probe and the platform. Additionally, for Java probes, ensure the environment meets Java runtime requirements (note that specific version-dependent operations, such as destroying Java probes, are currently only supported for version 8.15.0 and later).
Use Cases
Service Monitoring and Status Awareness: During routine service operations, use Application Agent to view the real-time operational status (e.g., Online, Circuit Broken, Offline) and various performance metrics (like response time, error rate), allowing you to monitor whether services are functioning normally at all times.
Fault Diagnosis and Problem Identification: When services experience issues like slow response times or increased error rates, leverage the detailed data collected by Application Agent, combined with traces and logs, to quickly pinpoint the location and cause of the problem, such as a specific interface call timeout or code exception.
Resource Management and Optimization: By observing resource consumption data from Application Agent, understand how services utilize system resources. This enables adjustments to resource allocation or code optimization to enhance service performance and resource utilization efficiency.
Service Version Updates and Change Validation: After deploying service version updates or configuration changes, use Application Agent to monitor changes in key metrics, verifying whether the updates or changes achieve the desired effect and if they introduce new issues.
Getting Started
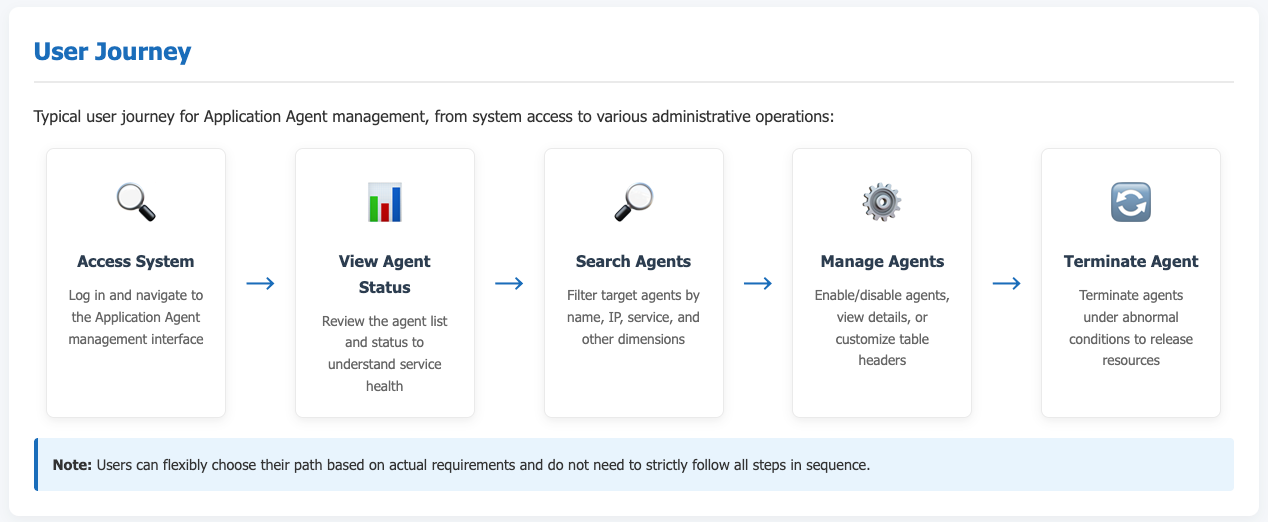
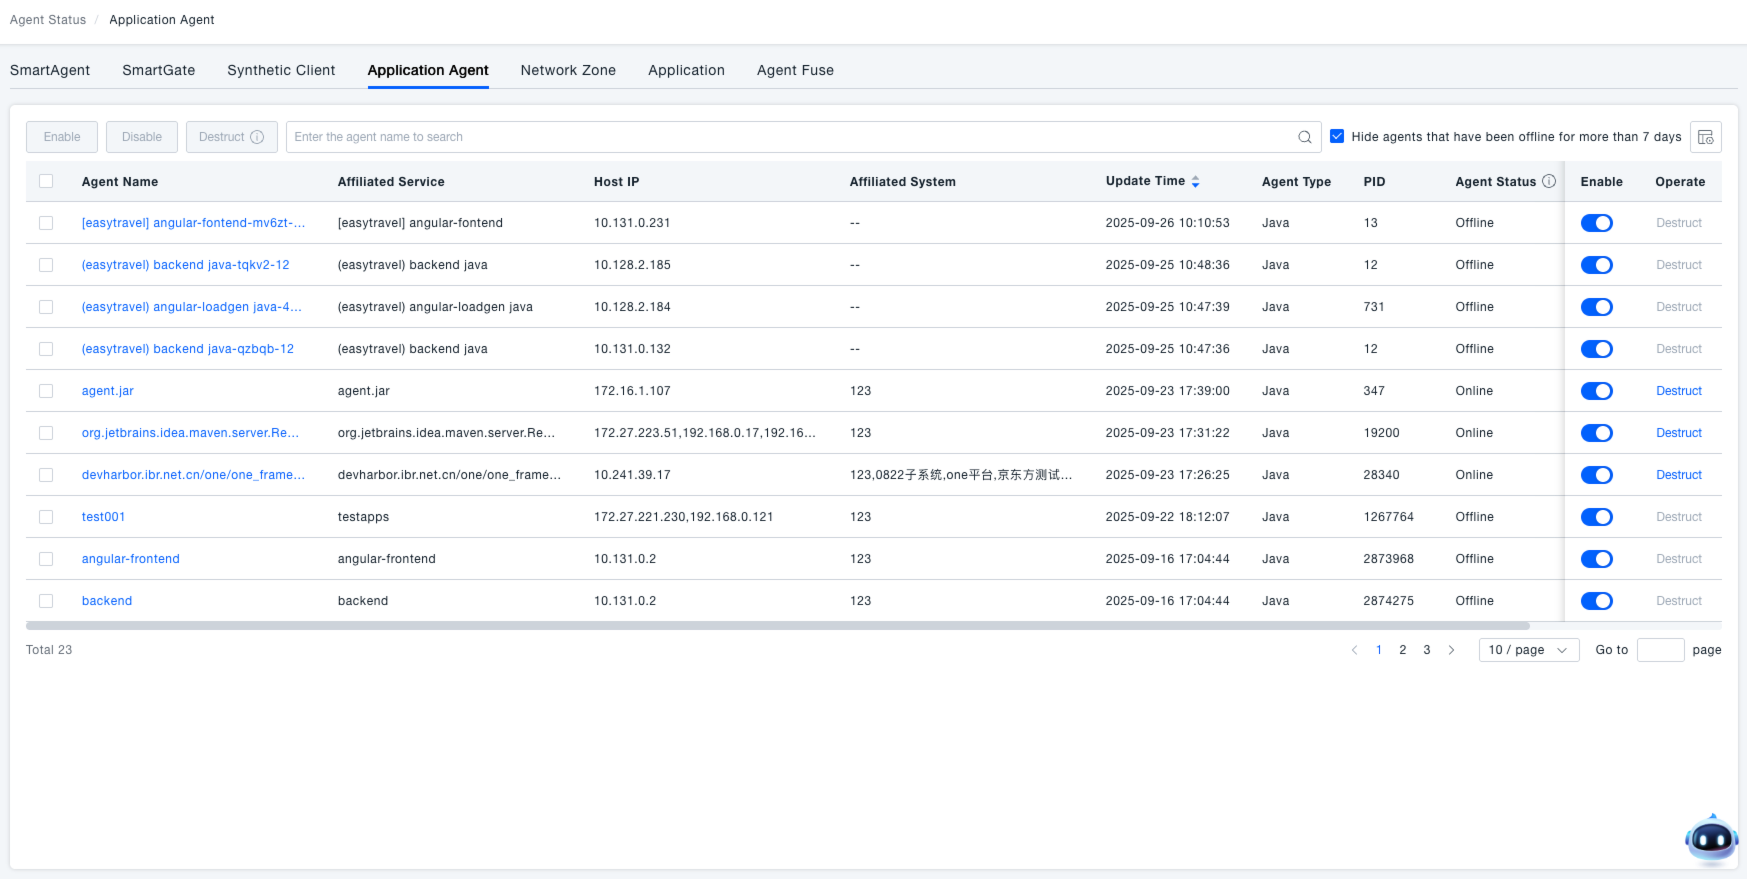
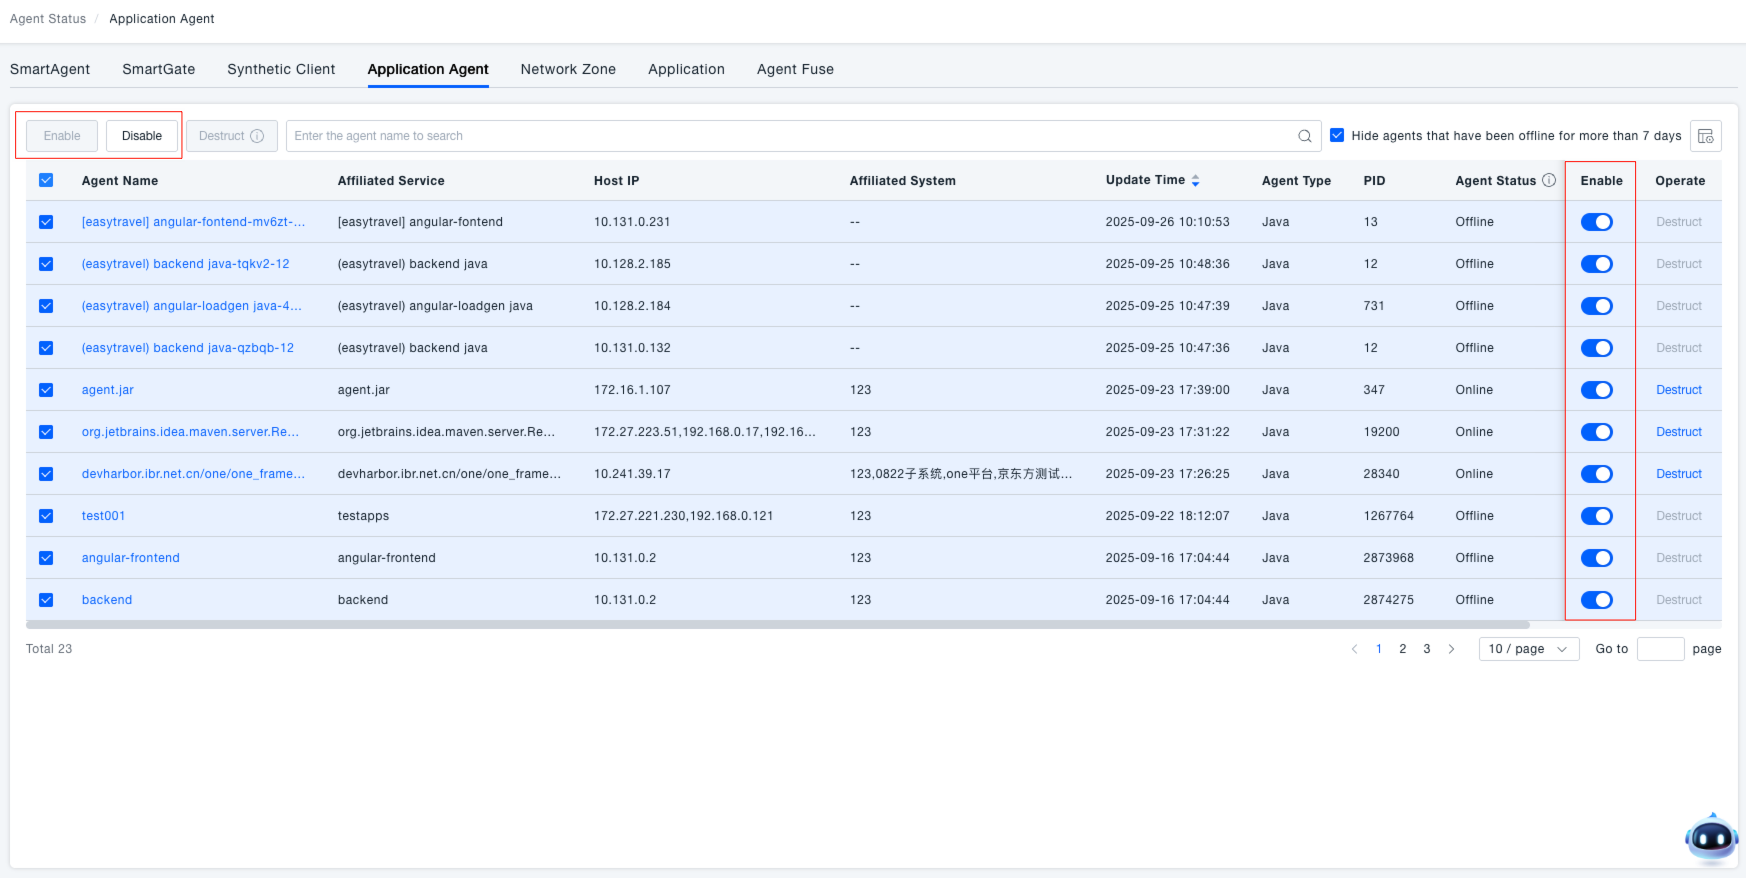
Navigate to Deploy Configuration → Deployment Status → Application Agent from the system menu to open the Application Agent management interface.
Viewing Probe Status
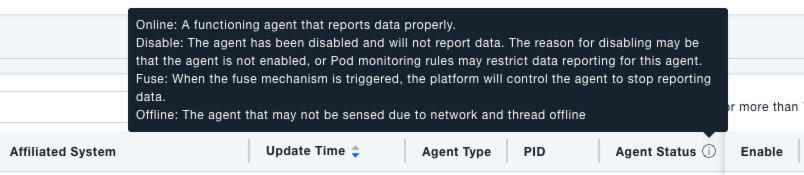
View Application Agent: Upon entering the Application Agent interface, a list hiding probes offline for over 7 days is displayed by default. This helps administrators quickly grasp the overall distribution and basic information (e.g., associated service, IP, probe type) of application agent, providing a foundation for subsequent monitoring and management tasks. The "Probe Status" column shows the current state of each probe, with the following meanings:
- Online: The probe is running normally and reporting data correctly.
- Disabled: The probe has been disabled and does not report data. This might be because the probe is not enabled or due to Pod monitoring rules restricting data reporting.
- Circuit Broken: A circuit breaker mechanism has been triggered, causing the platform to stop the probe from reporting data.
- Offline: The probe cannot be detected, potentially due to network issues, thread crashes, etc.
By checking the probe status, you can quickly determine if probes are functioning normally and promptly address any in an abnormal state.
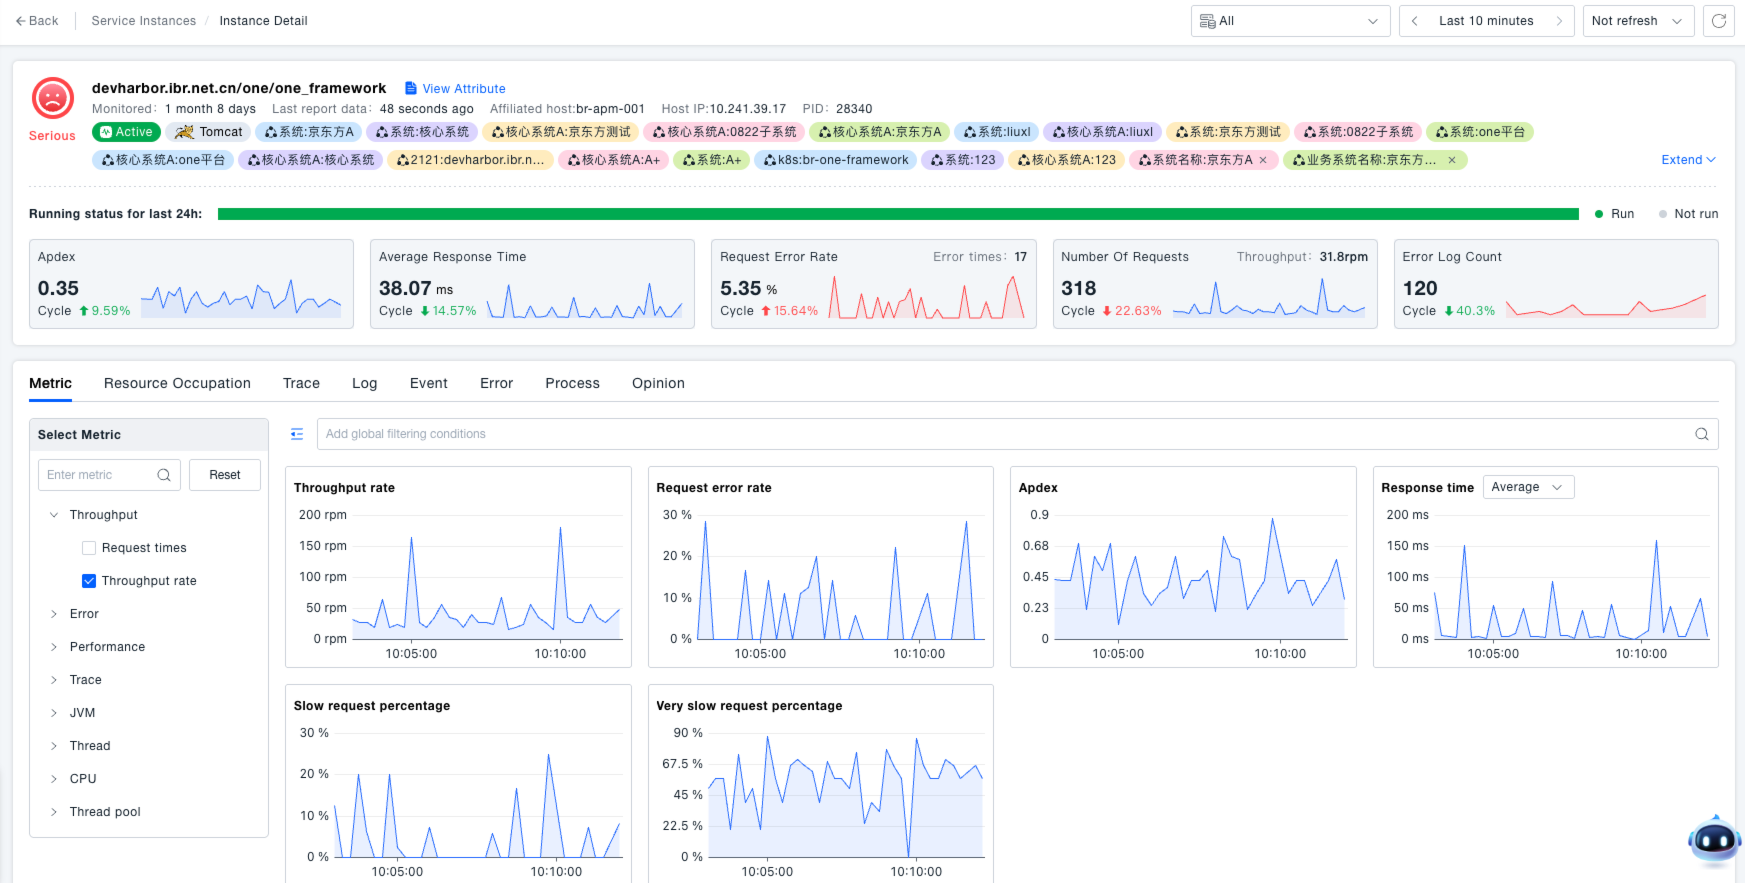
View Probe Details: Click the Probe Name to access the details page, where you can view the following core data. This provides administrators with comprehensive operational data for the service instance, assisting in troubleshooting performance bottlenecks (e.g., long response times), identifying fault causes (e.g., increased request error rate), and optimizing service runtime efficiency. For detailed core data, refer to Service Instances.
- Service Health: Operational status, Apdex value, and error log count for the last 24 hours.
- Performance Metrics: Average response time, request error rate, request count, throughput rate (viewable via trend charts).
- Associated Data: Multi-dimensional details and trend charts for metrics related to resource usage, traces, logs, events, errors, processes, etc.
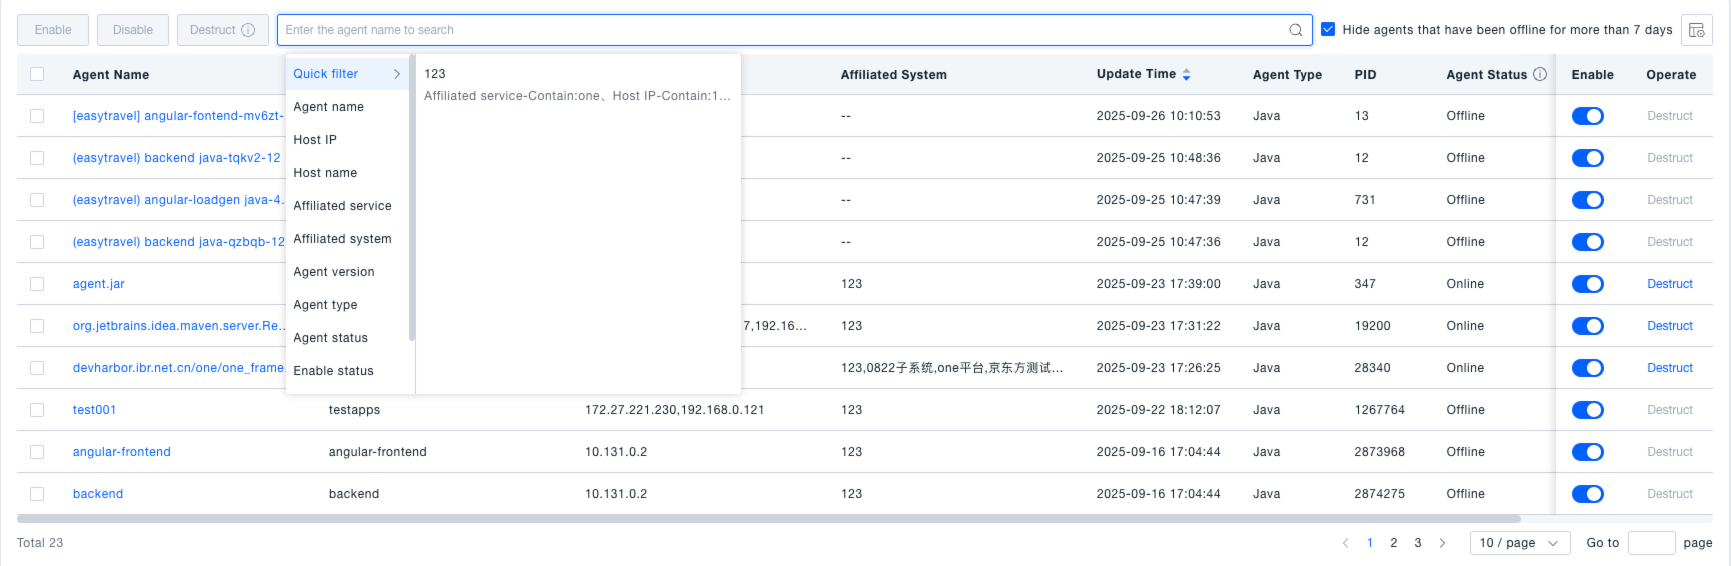
Searching for Probes
In the search box on the Application Agent interface, you can enter a probe name to search. Alternatively, use the dropdown to filter by various dimensions such as Host IP, Host Name, or Associated Service, enabling you to quickly locate specific probes for viewing or management.
Enabling/Disabling Probes
In the "Enabled" column of the probe list, use the toggle switch to enable or disable a probe. When enabled, the probe operates normally and reports data. When disabled, the probe stops reporting data.
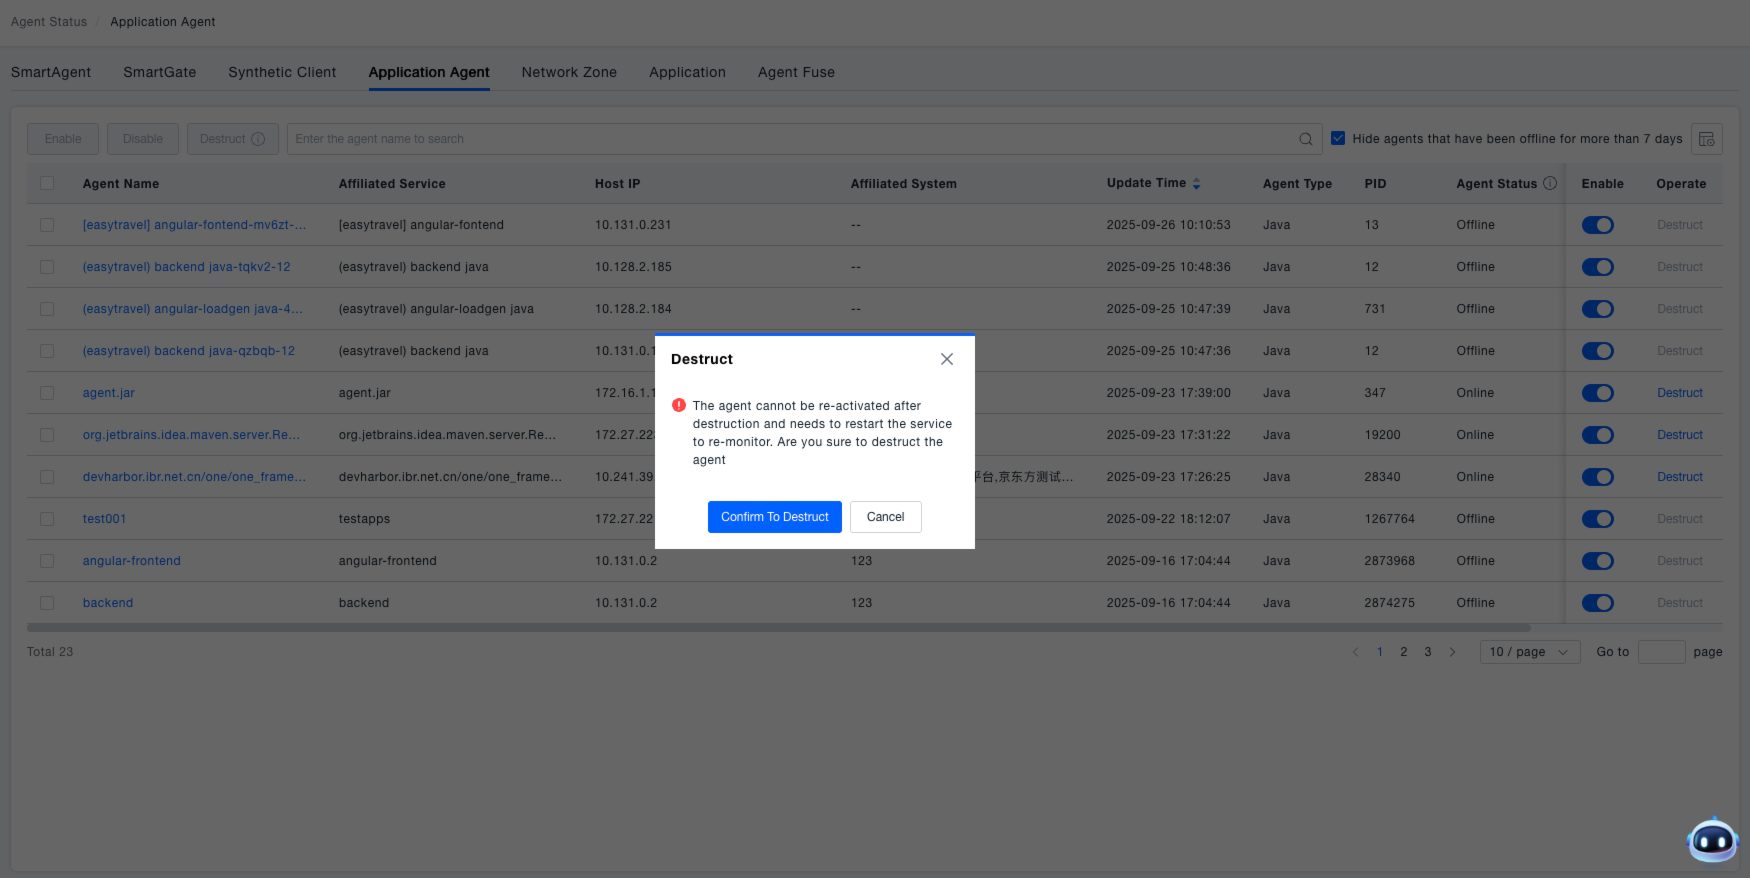
Destroying Probes
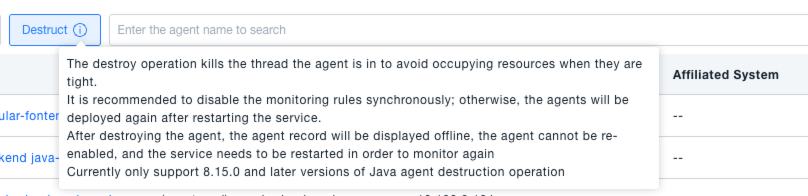
In the "Actions" column of the probe list, click the "Destroy" button. A confirmation dialog will appear, stating: "After the probe is destroyed, it cannot be re-enabled. The service needs to be restarted to resume monitoring. Are you sure you want to destroy the probe?". Click "Confirm Destroy" to proceed, or "Cancel" to abort the operation.
The destroy operation terminates the thread where the probe resides, freeing up resources during constraints. It is recommended to concurrently disable the associated monitoring rule; otherwise, the probe will be redeployed upon service restart. Note: Destroying Java probes is currently only supported for version 8.15.0 and later.
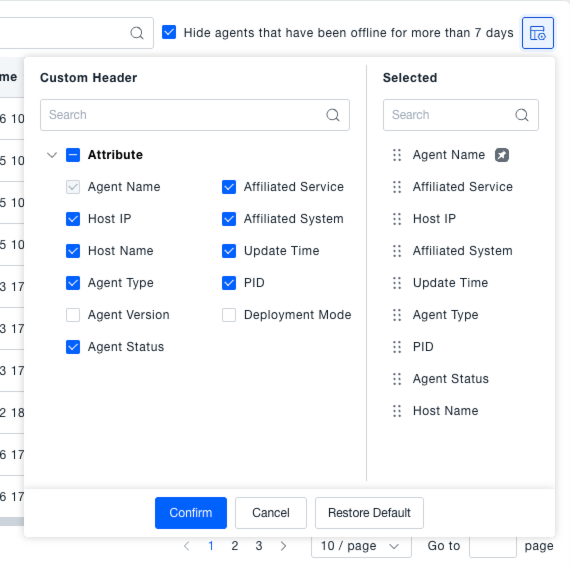
Customizing Table Headers
Click the custom table header button to open dialogs for "Available Custom Headers" and "Selected Custom Headers".
In the "Available Custom Headers" section, select the attributes you wish to display (e.g., Probe Name, Associated Service, Host IP). These will be added to the "Selected Custom Headers" list. You can also deselect attributes in the "Selected Custom Headers" list to remove them from display. After configuring, click "OK". The probe list headers will then display according to your custom selection, making it easier to view the information you care about.