Index Management
The platform decouples log ingestion from indexing, enabling full-volume log ingestion at a low cost. Indexing can be selectively applied only to logs with analytical value. Indexing strategies can also be adjusted based on business requirements by modifying filters and sampling rates.
Index Management
Index List
Logs are routed to the first index whose filter they match. The priority of indexes can be adjusted.
Index filters allow dynamic control over which logs flow into which index. Indexes support both inclusive filtering and exclusionary filtering.
The platform provides a default default index, which cannot be deleted. It supports editing and log querying.
For user-defined indexes, the platform supports editing, querying logs, and deletion. Deleted indexes remain visible in the list but are marked with a red delete icon. Editing and log querying are still possible for deleted indexes. For exclusion filters, the platform supports editing, querying logs, deletion, and enabling/disabling.
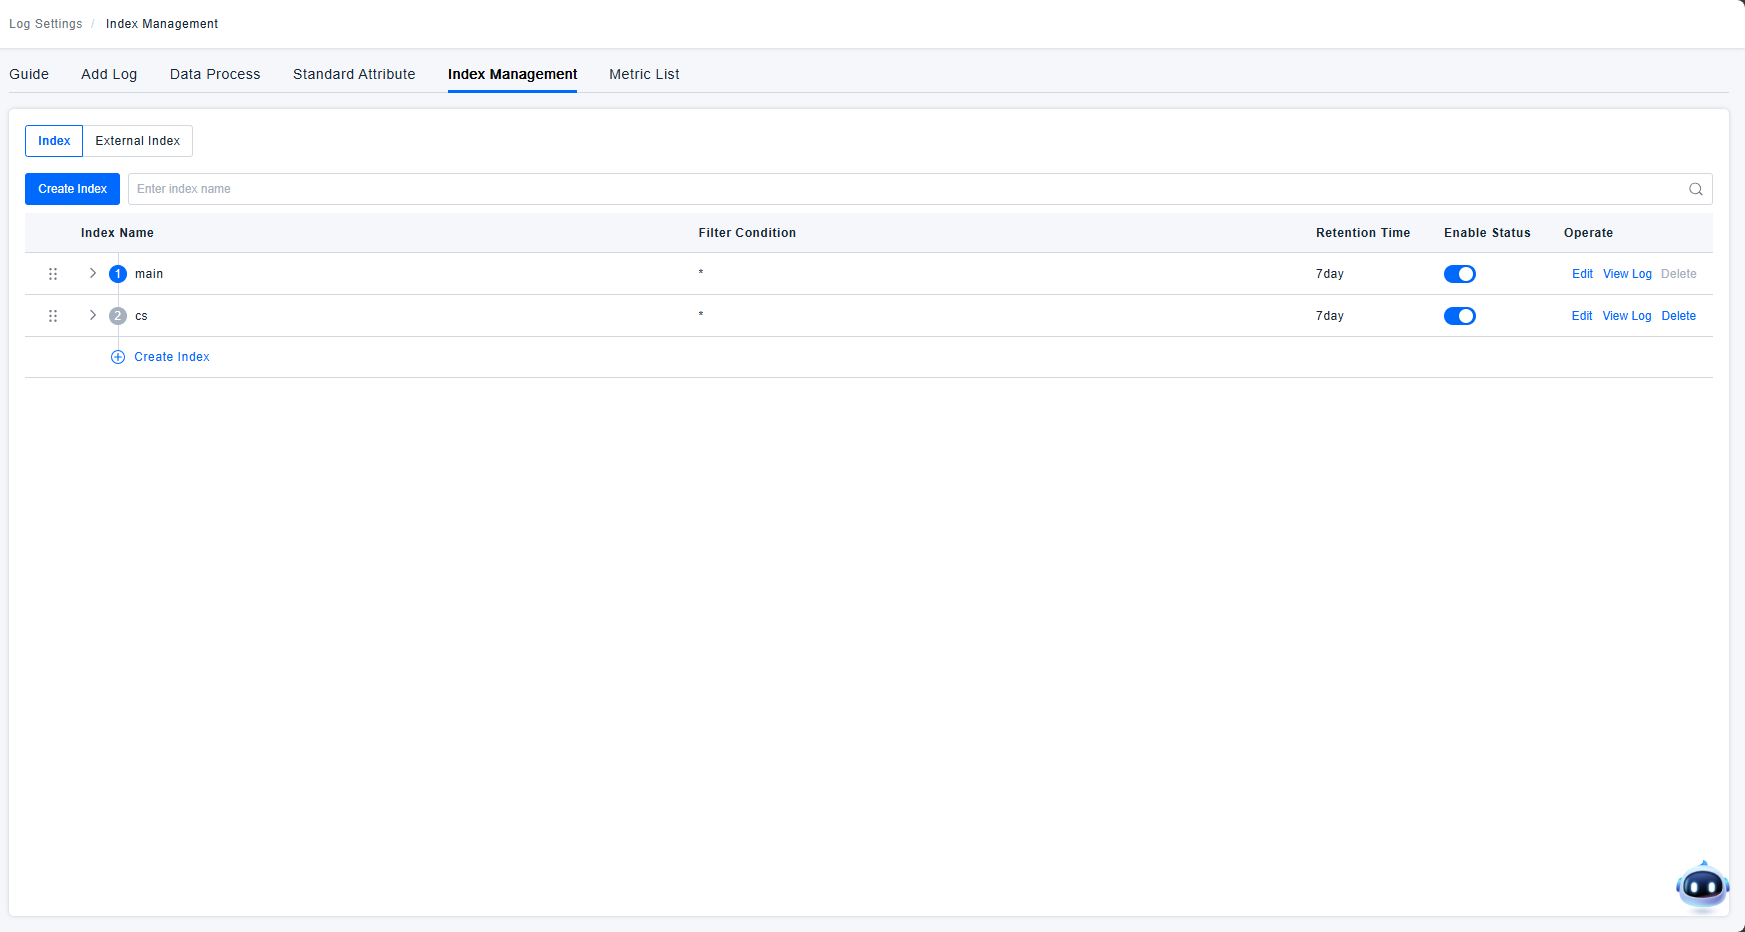
Creating an Index
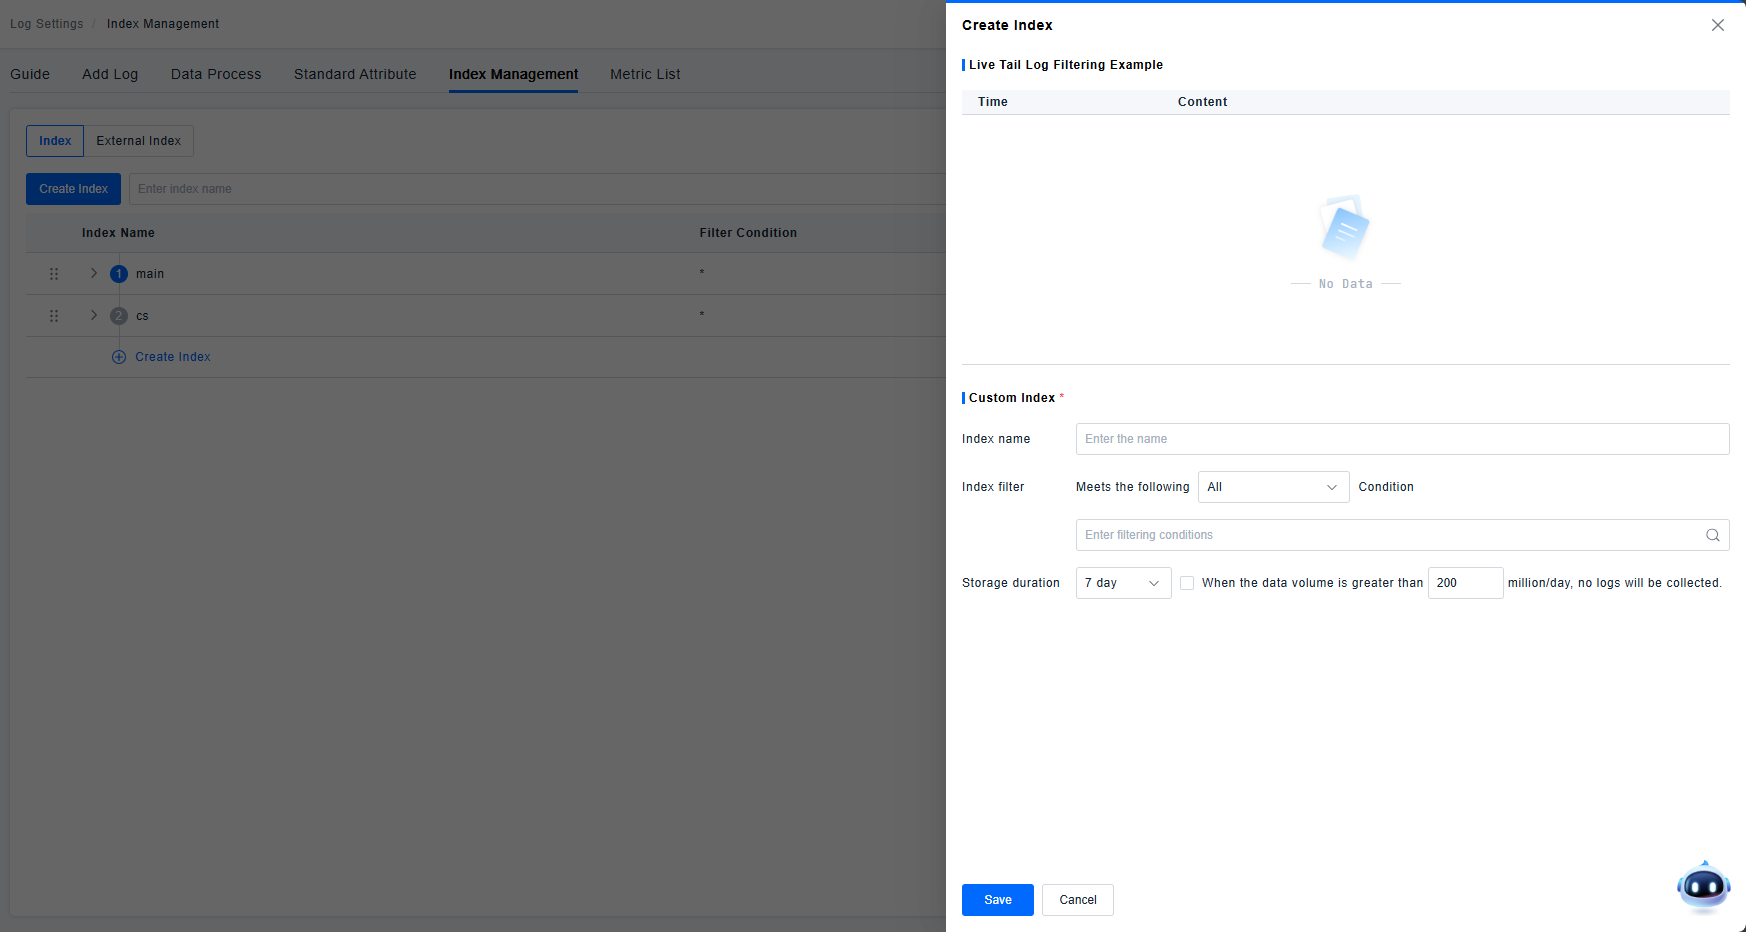
Log indexes allow you to reorganize data using filtering methods (the same filters as the query component).
You can configure different retention periods and quota storage sizes (default 200 million/day, customizable), enabling granular control over your log management budget.The retention period can be configured manually in the Nacos backend. It supports options of 7 days, 15 days, 30 days, 90 days, 180 days, and 365 days, and multiple available options can be set.
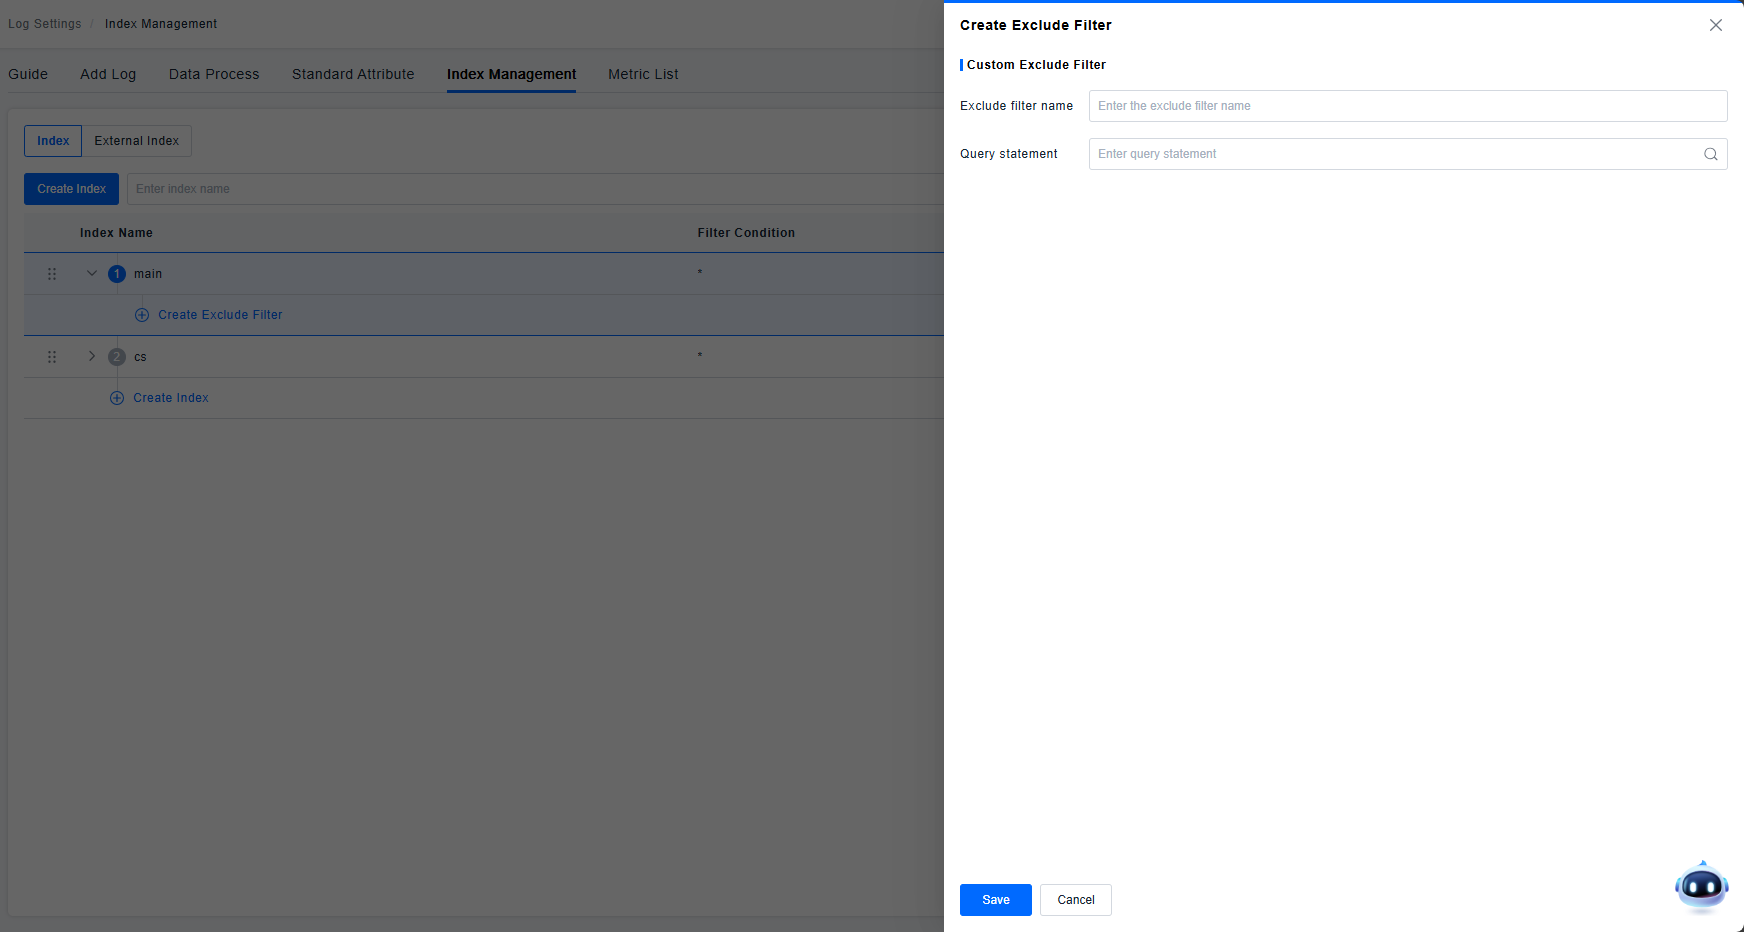
The configuration of exclusion filters is supported, allowing the exclusion of a certain percentage of logs based on attributes, tags, TraceID, or all logs.
External Index
The logging module currently supports two types of external indices: LogEasy and ELK.
LogEasy Index
Integrates with LogEasy data, typically supporting a single log source. When enabled, a "LogEasy" index will be generated in the platform's External Indices section. Click Edit to configure field mappings.
- Context Correlation Field: Specify any field as an identifier for contextual log correlation. During log context analysis, logs with matching values in this field will be recognized as correlated contextual logs.
- Entity Field Mapping:
- Field Association: Map external fields directly to entity fields. For example, when the platform's service identifier is "serviceDetectedName" but the client-side uses "servicename", this mapping ensures queries using the platform's identifier correctly retrieve data. Each entity field can only be mapped once.
- Constant Association: For cases where field association isn't applicable (e.g., Service A uses "sname" instead of the standard "servicename"), set fixed constant conditions. When querying Service A logs, the system will use the configured condition "sname==A".
ELK Index
For ELK integration supporting multiple log indices. After enabling ELK index configuration, the External Indices section supports add, edit, and delete operations.
- Index Name: Custom names must exactly match the index names in the client's ELK environment. Selecting an index will directly query data from the corresponding client-side index.
- Field Mapping: Correlates the platform's log metadata fields with client-side ELK fields.
- Metadata: Selected from log metadata options. The logMessage field is mandatory and cannot be removed.
- ELK Field: The corresponding field key in ELK for each metadata element. Enter the correct field names to establish mapping. When executing conditional queries in the logging module, these will be translated into corresponding ELK field queries against client-side log data.
External Index ELK Integration Steps 1.Availability Check Request
# Execute the curl command on the host where br-query-service is deployed to call the Elasticsearch API for inspection
curl -k -u {elasticsearch用户名}:{elasticsearch用户密码}  https://{elasticsearch地址}:{elasticsearch端口}

# If a proxy exception is reported: CONNECT tunnel failed, response 403, block the proxy as follows
# Note: The {elasticsearch的证书CN} item is required in the following commands if HTTPS is enabled for the client; otherwise, it can be omitted
# Command to view Elasticsearch certificate CN: curl -v -k -u {elasticsearch用户名}:{elasticsearch用户密码} https://{elasticsearch地址}:{elasticsearch端口} 2>&1 | grep -i "subject"
echo 'export no_proxy="{主机IP},{elasticsearch的证书CN},localhost,127.0.0.1"' >> ~/.bashrc
source ~/.bashrc

# Run curl check again
curl -k -u {elasticsearch用户名}:{elasticsearch用户密码}  https://{elasticsearch地址}:{elasticsearch端口}
2.Pre-Configuration (Skip this step if HTTPS is not enabled for Elasticsearch)
# Execute the following command to obtain the Elasticsearch certificate via Elasticsearch API and save it as the es.crt file:
openssl s_client -showcerts -connect {elasticsearch地址}:{elasticsearch端口} </dev/null 2>/dev/null | openssl x509 -outform PEM > es.crt

# Copy the above es.crt file into the br-query-service container
docker cp es.crt br-query-service:/data/

# Enter the br-query-service container (log in as root user)
docker exec -u root -it br-query-service bash

# Use JDK built-in command to generate the es-truststore.jks file
keytool -importcert -alias es-https -file /data/es.crt -keystore es-truststore.jks -storepass changeit -noprompt

# Place the es-truststore.jks file in the corresponding directory
mv es-truststore.jks /data/br/conf/query_service/

# Modify file ownership
cd /data/br/conf/query_service/ && chown bonree:bonree es-truststore.jks

# Modify br-query-service JVM startup parameters to specify Djavax.net.ssl.trustStore
vim /data/br/conf/query_service/query_service.env
# Append the following parameter items at the end of the configuration file:
# # ssl cert
# -Djavax.net.ssl.trustStore=/data/es-truststore.jks
# -Djavax.net.ssl.trustStorePassword=changeit

# Exit the container and restart query_service
exit
docker restart br-query-service

# Execute the following command to get the CN set for the Elasticsearch certificate via Elasticsearch API:
curl -v -k -u {elasticsearch用户名}:{elasticsearch用户密码} https://{elasticsearch地址}:{elasticsearch端口} 2>&1 | grep -i "subject"

# Add the above CN to the local hosts file
vim /etc/hosts
# Append the following parameter item at the end of the configuration file:
# # es CN
#  Elasticsearch address Obtained CN name
3.Modify Nacos Configuration
Configuration file: CONFIG_GLOBAL
Edit node: <private>
Add the following content:
<oneservice>
   <!-- ES cluster information -->
   <es>
       <property name="cluster">
           <list>
               <!-- Set http to Elasticsearch address, set https to Elasticsearch certificate CN -->
               <value>https://Elasticsearch's CN:Elasticsearch's port</value>
           </list>
       </property>
       <!-- Leave blank if no ES username required -->
       <property name="username" value="ES username"/>
       <!-- Leave blank if no ES password required -->
       <property name="password" value="ES user password"/>
   </es>
</oneservice>
<framework>
   <log>
        <!-- Enable external ELK index feature -->
        <property name="externalIndexElk.status" value="1"/>
        <property name="databaseElk" value="logs"/>
   </log>
</framework>
4.Add Elasticsearch Index
1. Access ES API via browser or curl to view index list: https://172.16.51.79:9200/_cat/indices?v
2. View mapping of specific index by index name: https://172.16.51.79:9200/nginx-2026.06.23/_mapping?pretty
3. View log records inside specific index by index name: https://172.16.51.79:9200/nginx-2026.06.23/_search?pretty
4. Navigate to the ONE platform external index page, add the specific external index based on index name, field definitions in mapping and detailed log records;
5. Verify on the log retrieval page. Full log fields can be viewed in log details. Edit the external index to add field mappings if needed.