Functional Overview
What is a Business Trace?
Business traces refer to critical path nodes composed of a series of interdependent and interconnected software systems and services that support an enterprise's key business activities. The stability and performance of these paths directly determine the availability of core business functions and user experience.
For example, a successful "online payment" transaction may rely on the collaborative work of multiple services such as "User Service," "Risk Control System," "Payment Gateway," and "Account System." This invocation chain containing multiple service nodes is a Business Trace. If any node in this chain encounters a failure or performance bottleneck, it will directly lead to payment failure or delay, causing immediate impact on the business.
The Business Trace feature is specifically designed to provide end-to-end, visual, and deeply observable monitoring for these critical business paths.
Business Trace VS Call Chain
-
Focus: Call chains focus on the technical perspective, tracing the complete path of a distributed request and recording all technical details of services and database calls it passes through. Used for performance bottleneck analysis and root cause investigation. Business traces focus on the business perspective, orchestrating multiple systems or services into a complete business workflow according to business logic. Aims to monitor the overall health and availability of the business.
-
Data Perspective:Call chains are micro-level and discrete, displaying numerous independent request traces. Business traces are macro-level and aggregated, extracting key metrics from massive call chain data and presenting them in an aggregated manner on business topology diagrams to reflect overall status.
-
Construction Method:Call chains are automatically generated by the system collecting and reporting trace data for each request, reflecting the most authentic invocation scenarios. Business traces support manual orchestration and remain unchanged despite dynamic call chain variations. Requires users to manually draw topology diagrams and configure key metrics based on business architecture. Therefore, call chains represent dynamic runtime data, while business traces represent static link architectures that reflect dynamic behavioral data.
Related Terminology
- Business Trace: A series of interconnected services or systems where issues directly impact business availability. Examples: transactions, login, fund transfers.
- Node: Represents a monitored entity within the Business Trace topology diagram, typically referring to systems or services arranged on the canvas.
- Key Metric: Also known as North Star Metric, it is the most core indicator for measuring business or service health and can be customized.
- Vertical Architecture: Describes the deployment and dependency relationships of the underlying infrastructure for a service or system, typically top-down as: System -> Service -> Service Instance -> Container -> Host. This view supports customizable levels.
- Alert Severity: Indicates the severity level of alerts, including: Critical, Severe, Warning, General, Reminder. Configurable to define which levels are considered "abnormal" status.
- Alert Rules: Refers to the alert rules within the ONE platform. You can select pre-configured alert rules to associate with core business flows, enabling flow monitoring based on triggered alert conditions.
- Chain Ratio: The comparative value of data between the current time period and the previous adjacent period (e.g., this week vs. last week, today vs. yesterday), used for quickly judging metric fluctuations.
- Health Wall: Refers to the global overview interface of the Business Trace monitoring feature, providing intuitive perception of all core business link health status through color coding and centralized display of key data.
Monitoring Process
The Business Trace monitoring process leverages ONE Platform's three core capabilities: intelligent visualization, hierarchical drill-down, and data correlation. It intuitively detects business anomalies through color-coded alerts on the Health Wall, locates fault points by drilling down along the "Business-Service-Infrastructure" hierarchical path, and quickly identifies root causes by correlating metrics, logs, and traces in integrated views, forming an efficient closed loop from problem discovery to verification and recovery.
- Create Business Trace process: Create Business Trace
- Analyze Business Trace process: Analyze Business Trace
Focused Scenarios
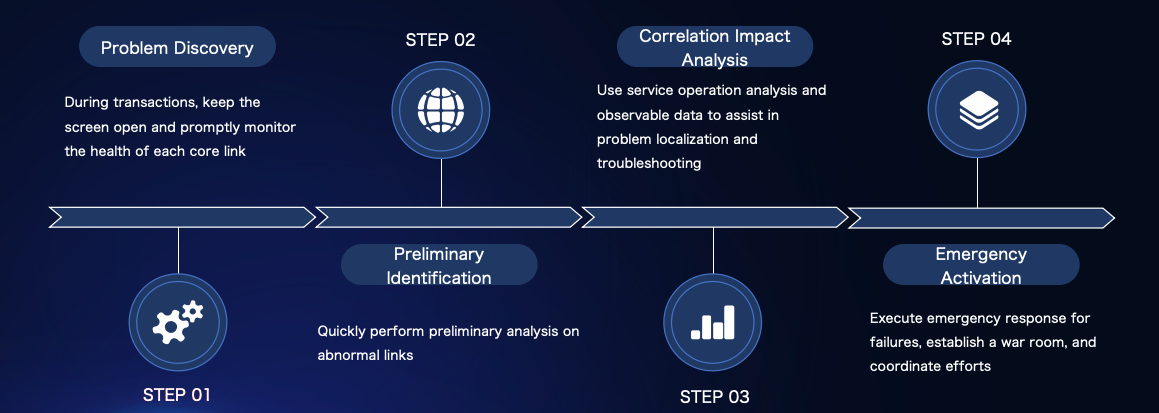
- Problem Discovery: During daily monitoring, centrally view all link statuses through the Business Trace Health Wall, using colors to intuitively identify abnormal businesses, achieving rapid awareness and problem discovery.
- Initial Localization: After detecting anomalies, drill down to the link details page, quickly locate abnormal service nodes through the topology view, and determine the fault impact scope.
- Correlation Impact Analysis: Further drill down to the service details page, combine vertical architecture and various observation data to locate abnormal instances and analyze root causes, while assessing global impact.
- Initiate Emergency Response: Use the Business Trace monitoring view as the foundation for emergency coordination, ensuring the team operates based on a unified situation for fault handling and recovery.
Prerequisites
- Complete Data Integration: Ensure the systems and services you need to monitor are integrated with the ONE Platform and can stably report data such as Metrics, Logs, and Traces.
- Functional Permissions: Your account needs to be granted relevant viewing or editing permissions for Business Traces and Vertical Architecture.
Quick Start
- Create Link: Navigate to Observe & Insight -> Business Traces, click the "Create" button. Enter a link name (e.g., "Core Transaction Business") and save, then enter the arrangement page.
- Arrange Link: Select and add systems or services involved in key business to the canvas, and connect the added nodes in series.
- Configure Monitoring: Configure key interfaces, key metrics, alert rules, etc., and save.
- View Monitoring: Check the health status of Business Traces and Business Trace nodes on the Health Wall or link details page.