Global Topology
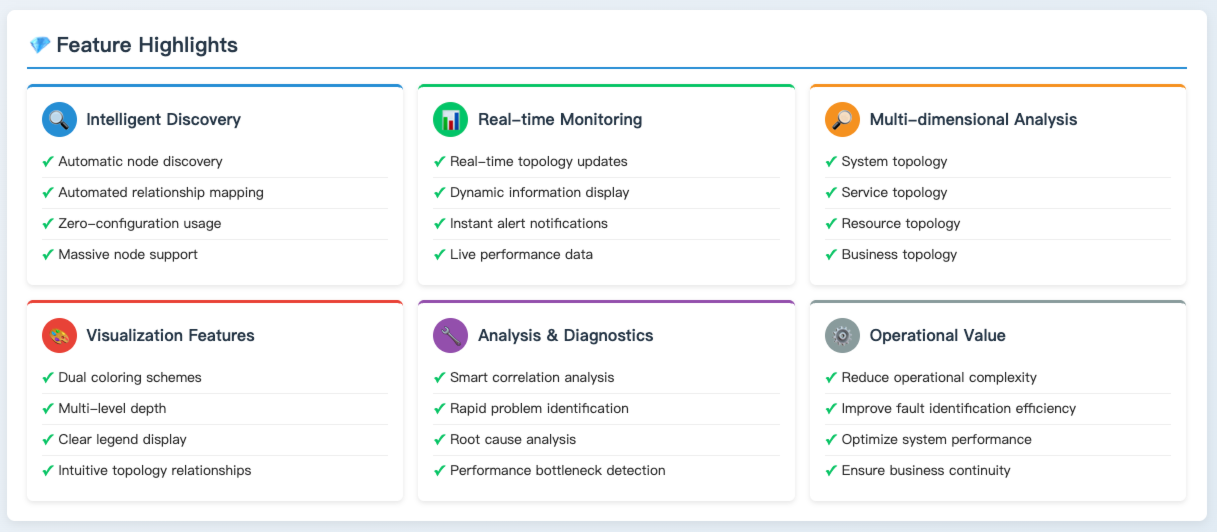
Global Topology automatically discovers massive nodes without extra configuration, presenting a real-time global topology map of production systems, services, databases, message queues, remote calls, terminal applications, and more. It helps users quickly discover and locate nodes and their relationships, effectively addressing complex technical scenarios involving multi-system, cross-business, and strong middle-platform architectures. Through layered topological relationships, it clearly displays service dependencies, business invocation chains, and resource dependencies, enabling users to grasp the global landscape more conveniently.
Use Cases
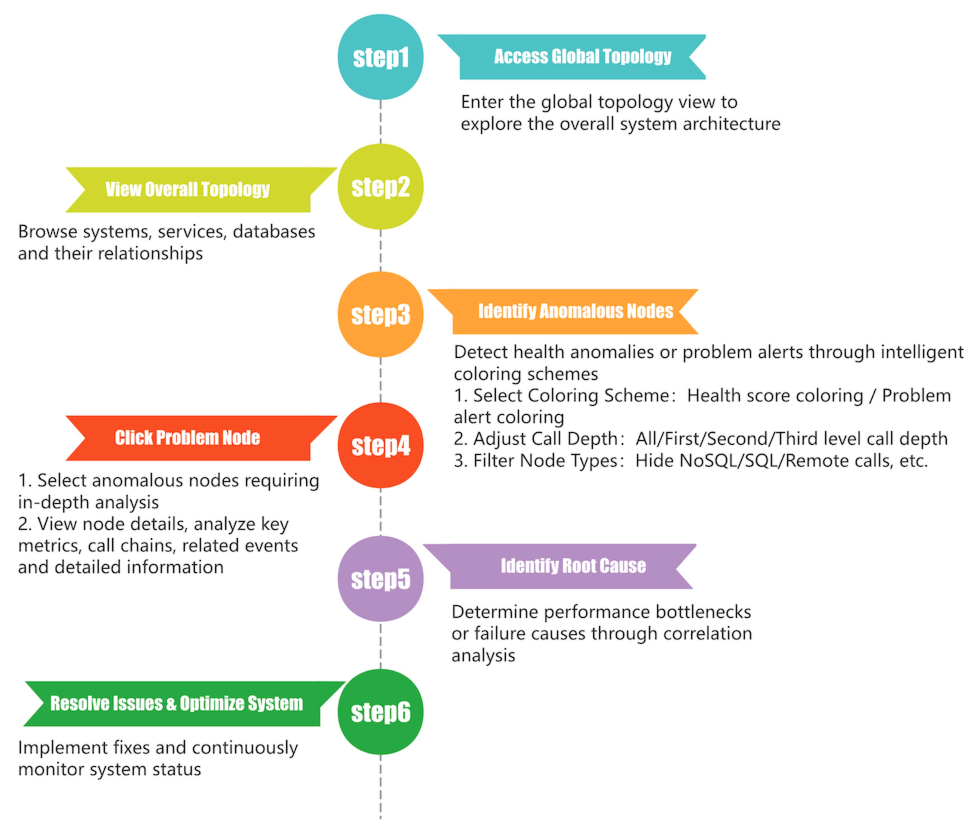
Complex System Architecture Analysis: In scenarios with multiple systems, cross-business units, and a strong middle-platform architecture, leverage Global Topology to quickly analyze dependencies between systems and services, clearly understand business invocation paths, and facilitate architecture optimization and fault diagnosis.
Performance Issue Identification: When system performance bottlenecks or failures occur, use Global Topology to view the health status and invocation performance of various nodes. Combined with key metrics from the node overview and correlations with traces and events, it enables rapid identification of the key nodes or invocation links causing performance issues.
Resource Dependency Analysis: Utilize the vertical topology feature to view the vertical dependencies of service nodes, analyze dependencies and resource utilization of instances, containers, and hosts. This aids in rational resource allocation and optimization, ensuring stable and efficient system operation.
Getting Started
Navigate to Observation & Insight -> Global Topology to view the hierarchical topology.
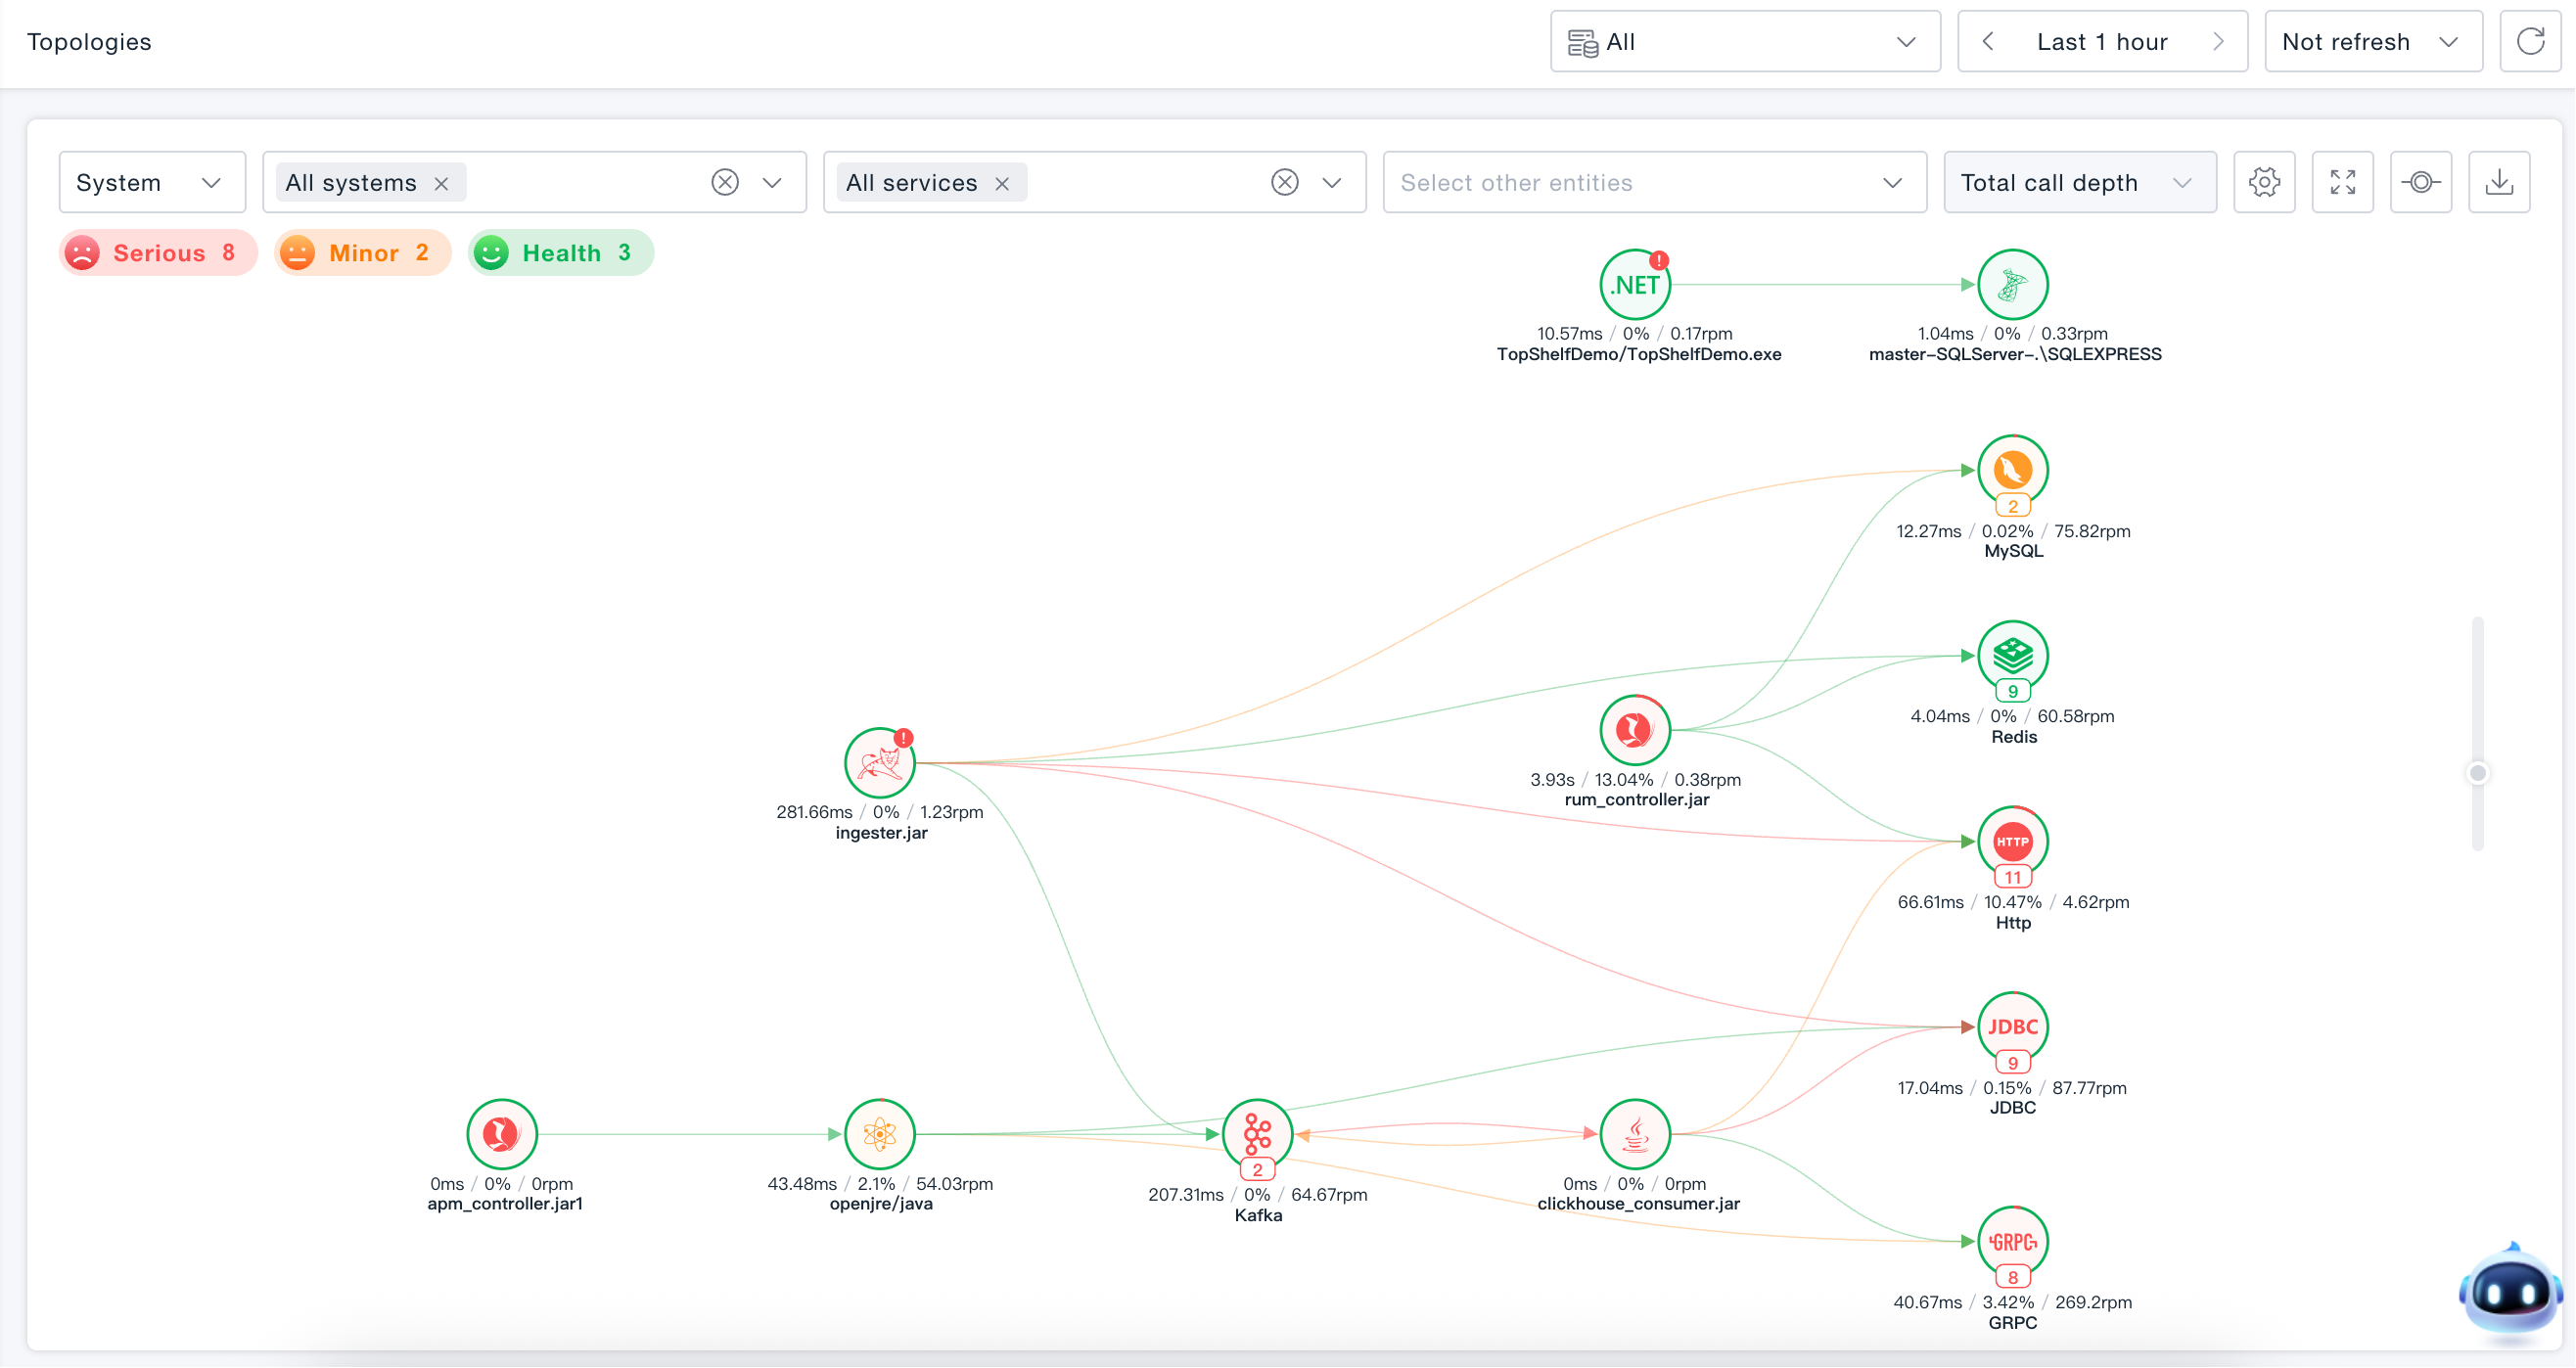
Hierarchical Topology
Organized by entity dimensions, it supports real-time invocation topology for systems, services, databases, message queues, remote calls, and terminal applications, allowing you to easily grasp the global overview and key node status.
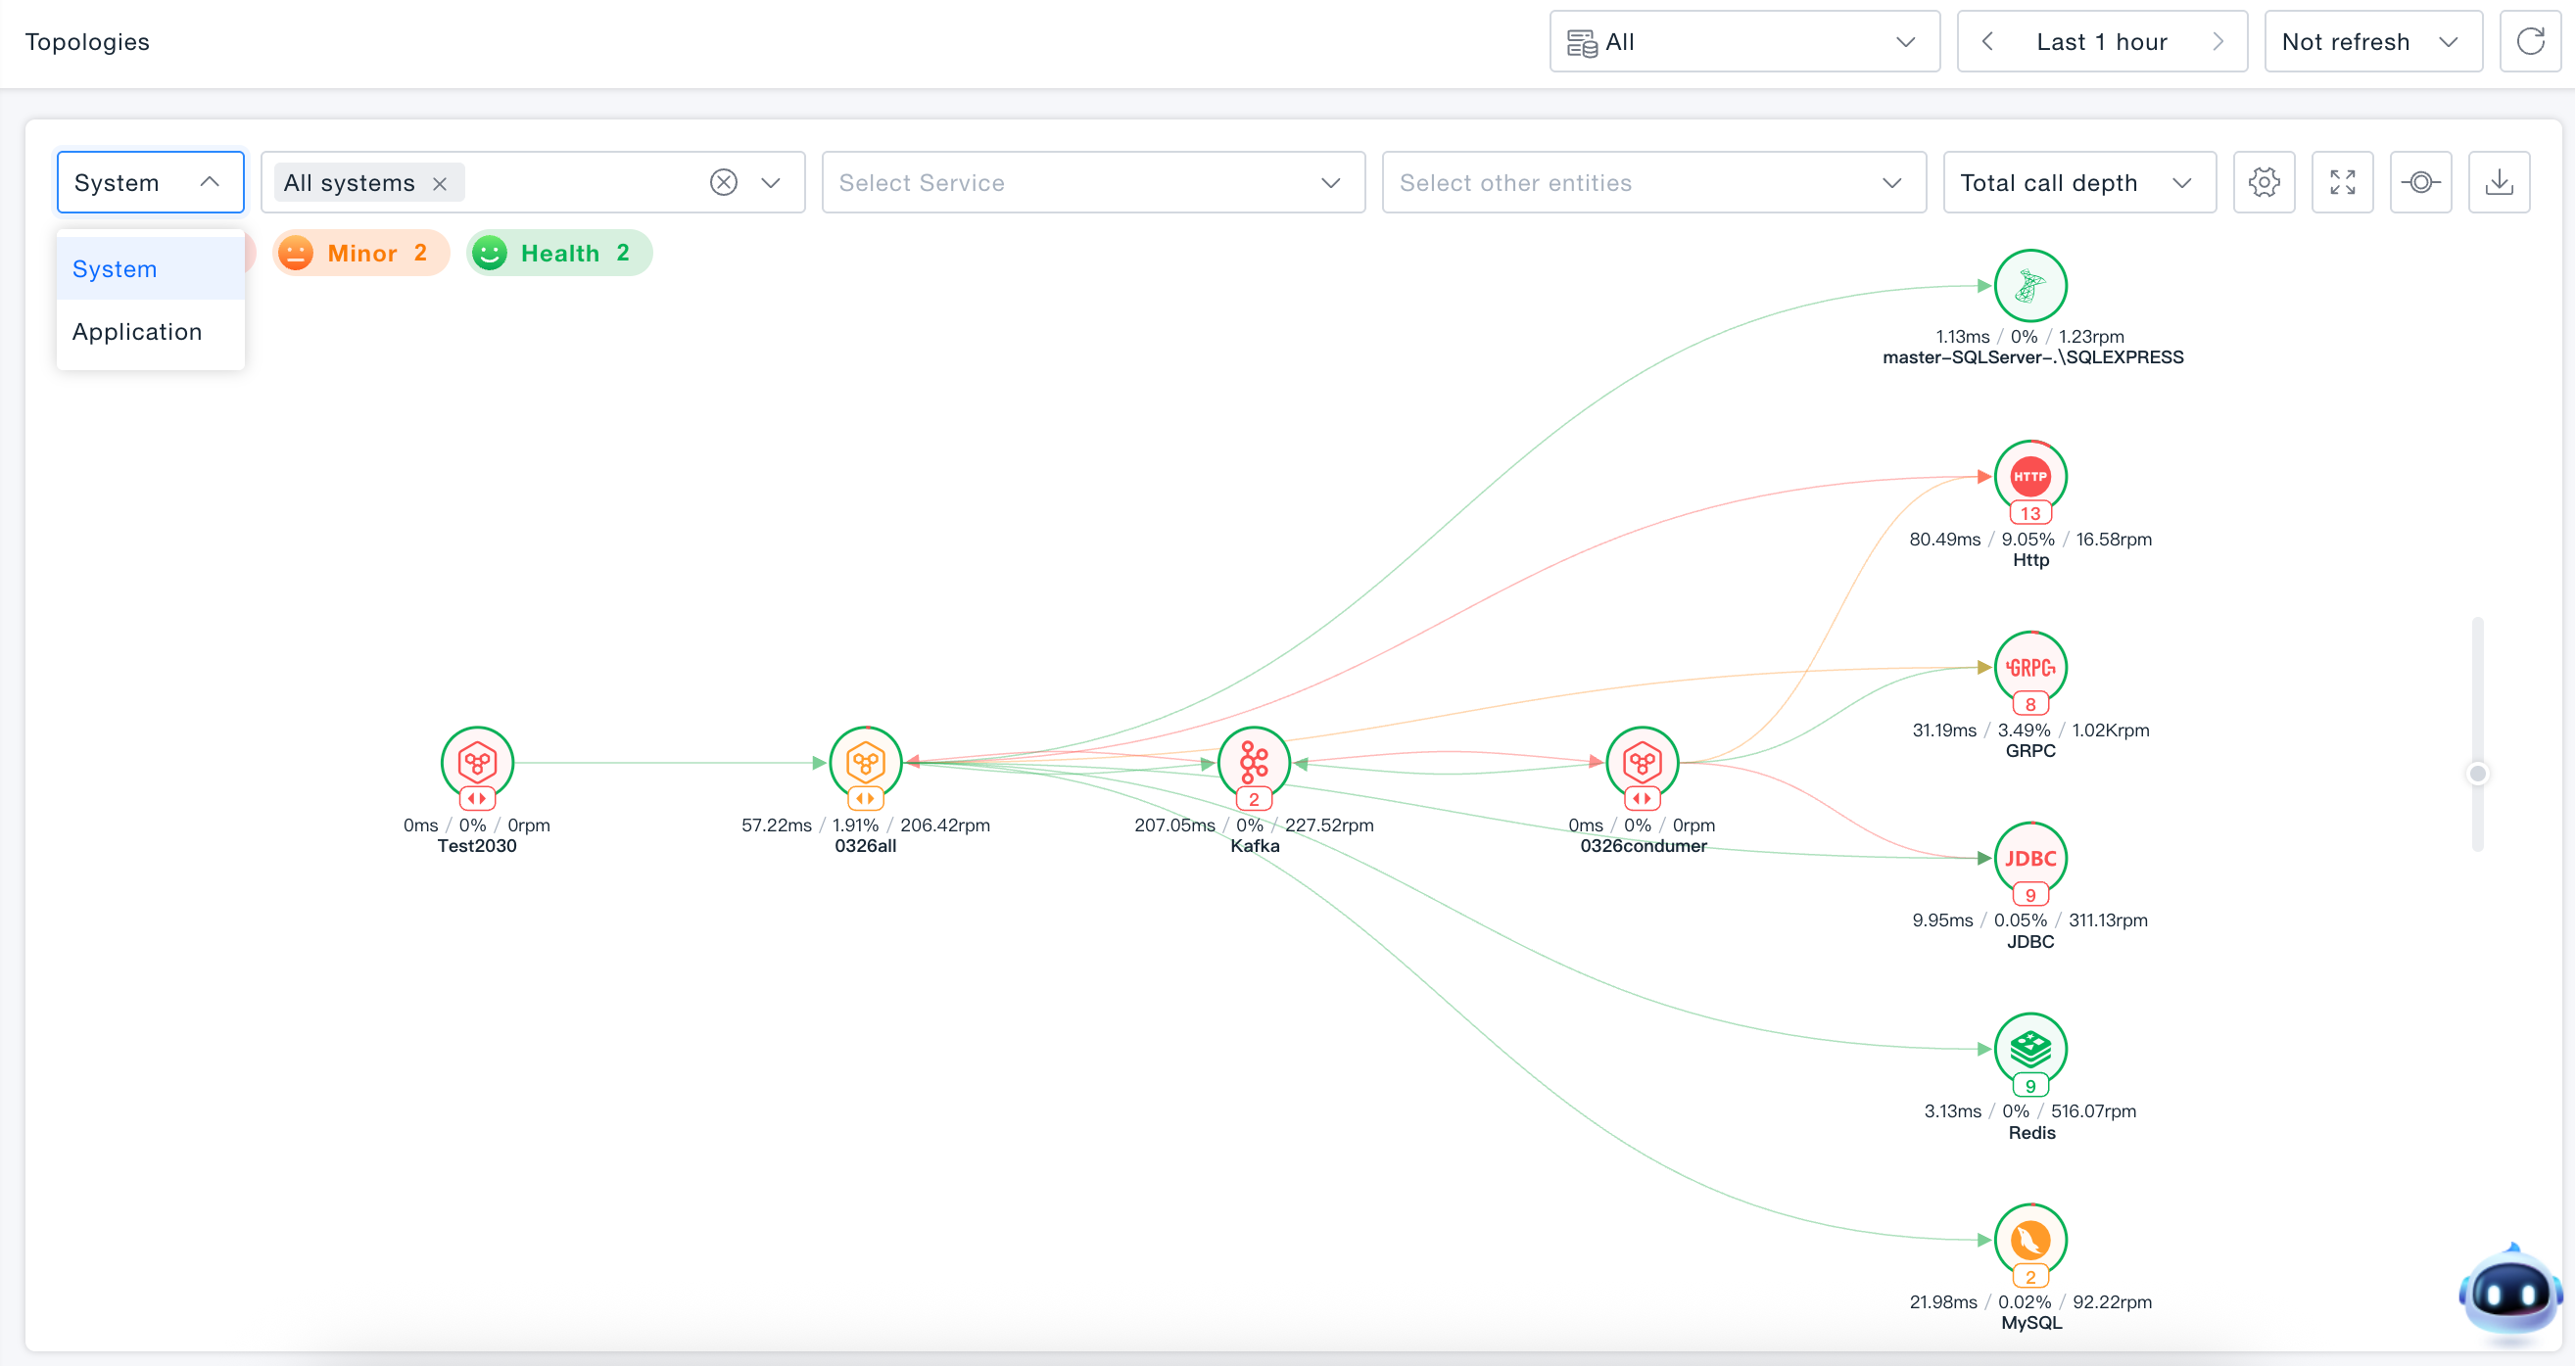
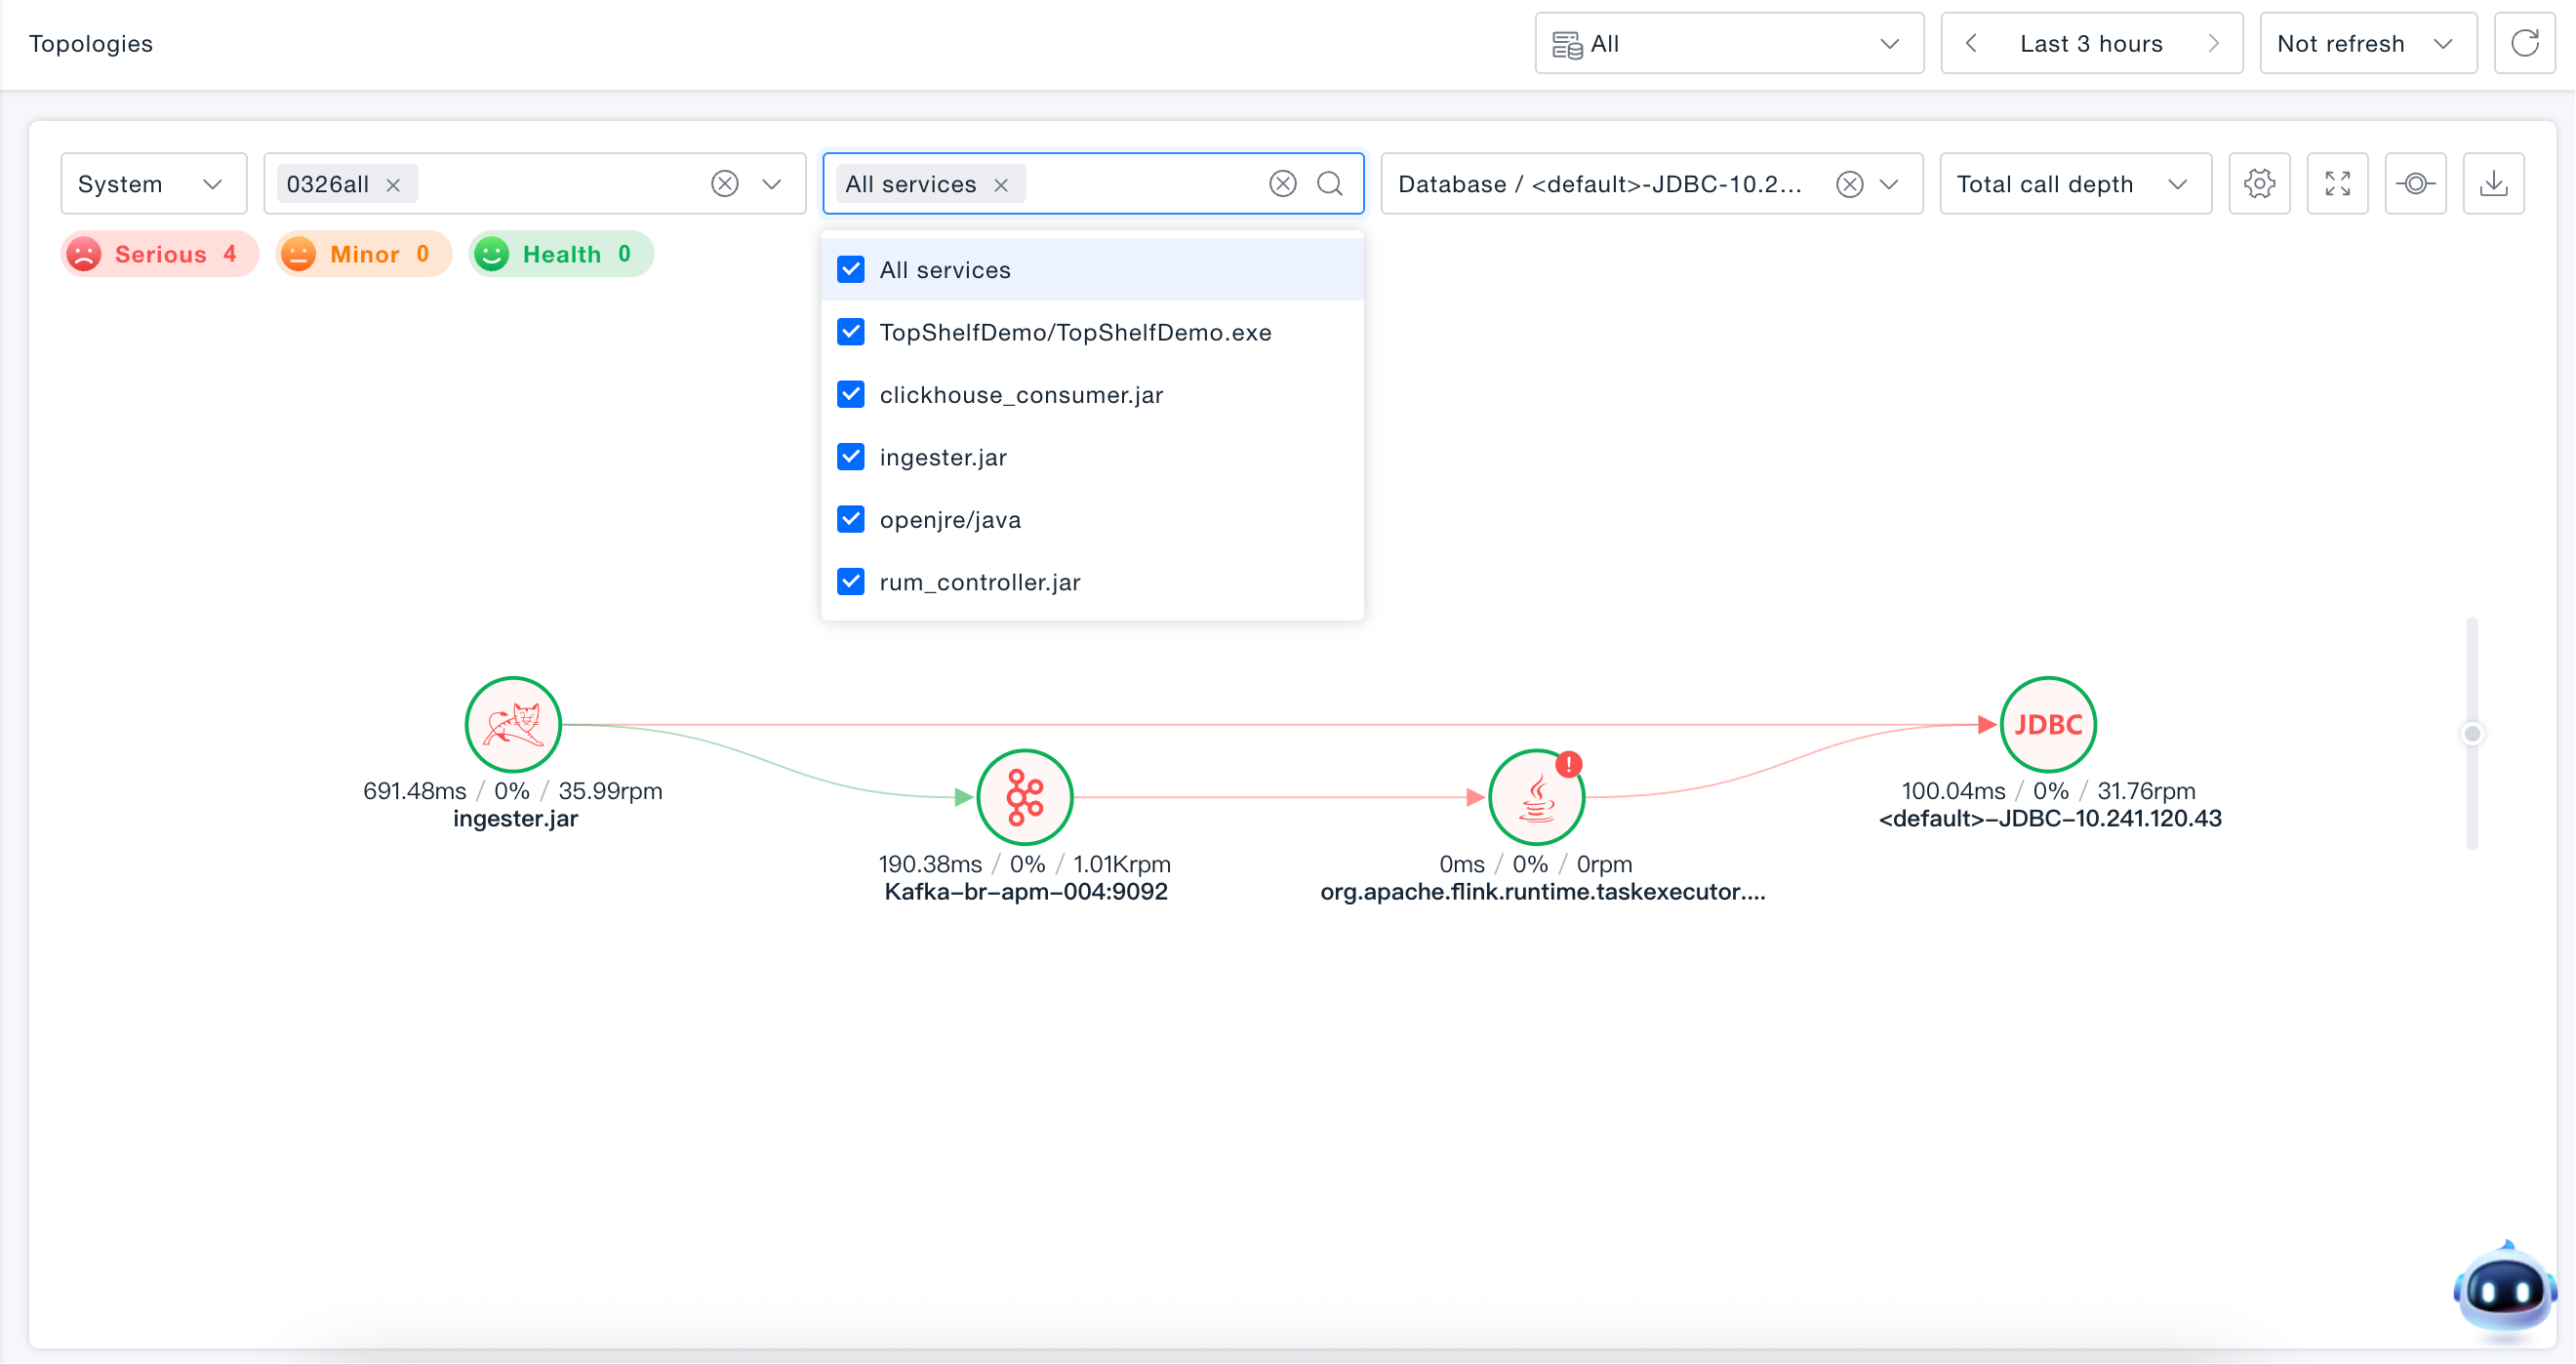
Cascading Filter
Supports system / application dimension switching, with multiple selection for systems and services, enabling quick filtering of databases, message queues, remote calls, and other entities; after adjusting the range of the pre-filter box, the post-selected content is automatically cleared.
- System Dimension: Multiple system selection → Multiple service selection → Single selection of other entities (database / message queue / remote call), with cascading filtering of associated topology between entities.
- Application Dimension: Single application selection → Multiple page selection, displaying the topology of the application or page and its associated services and backend entities.
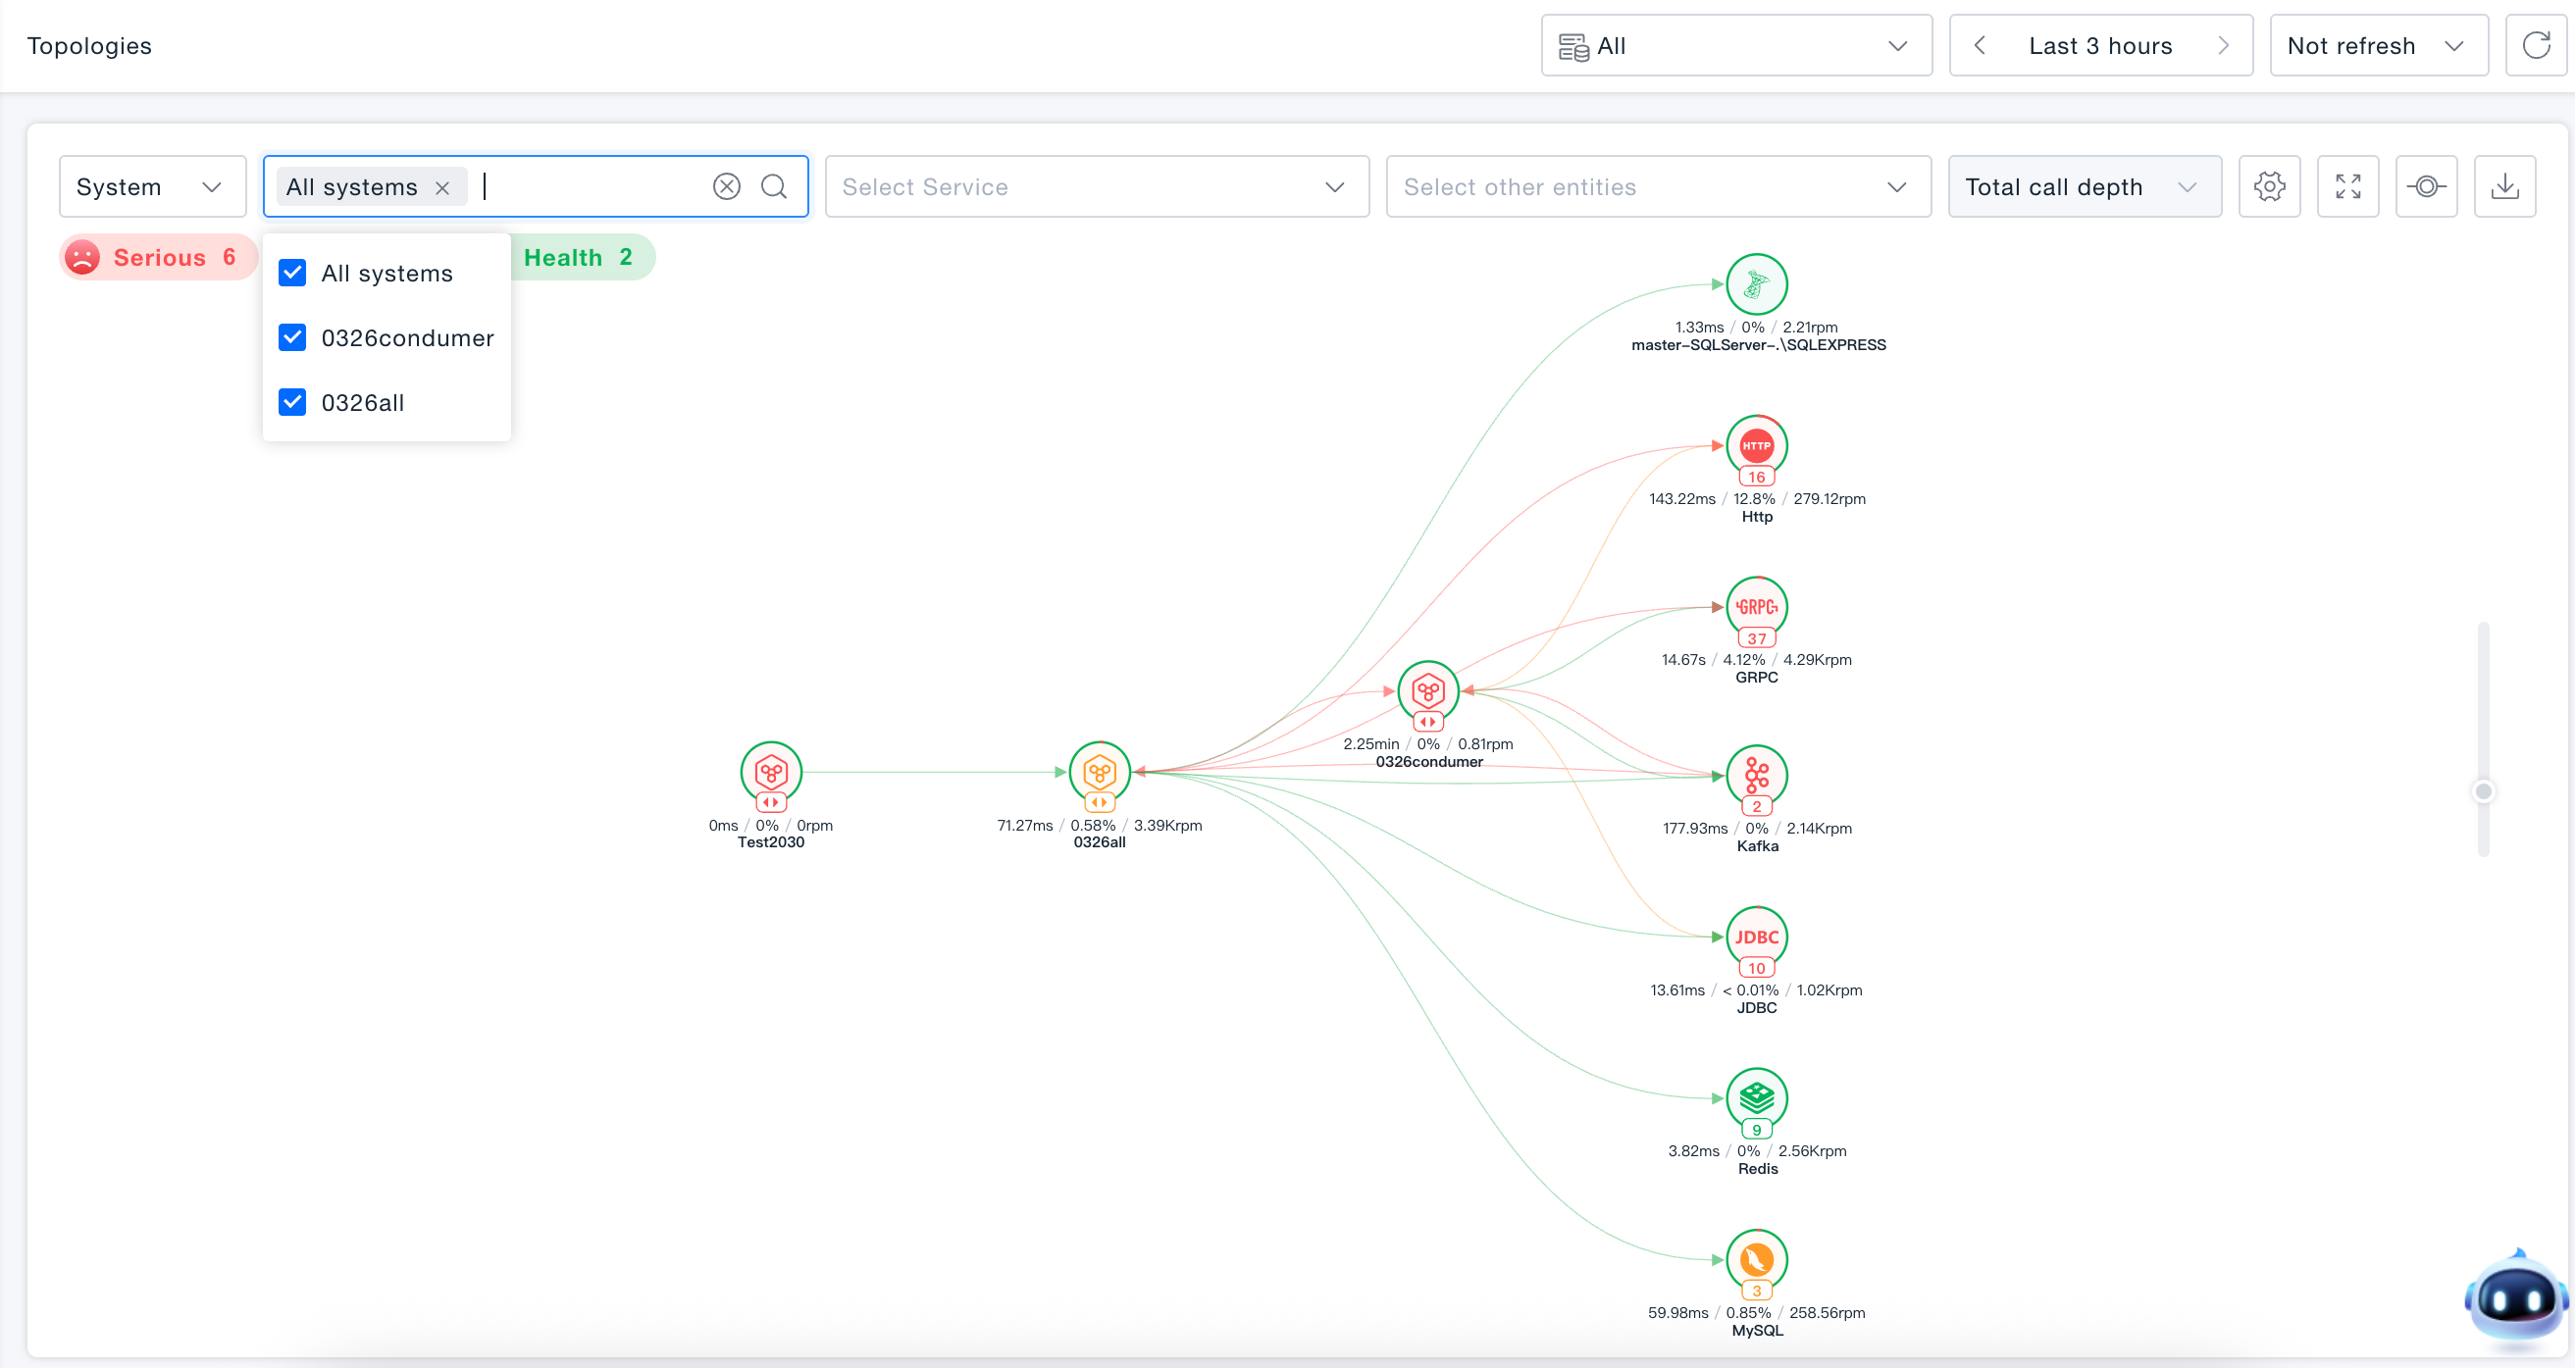
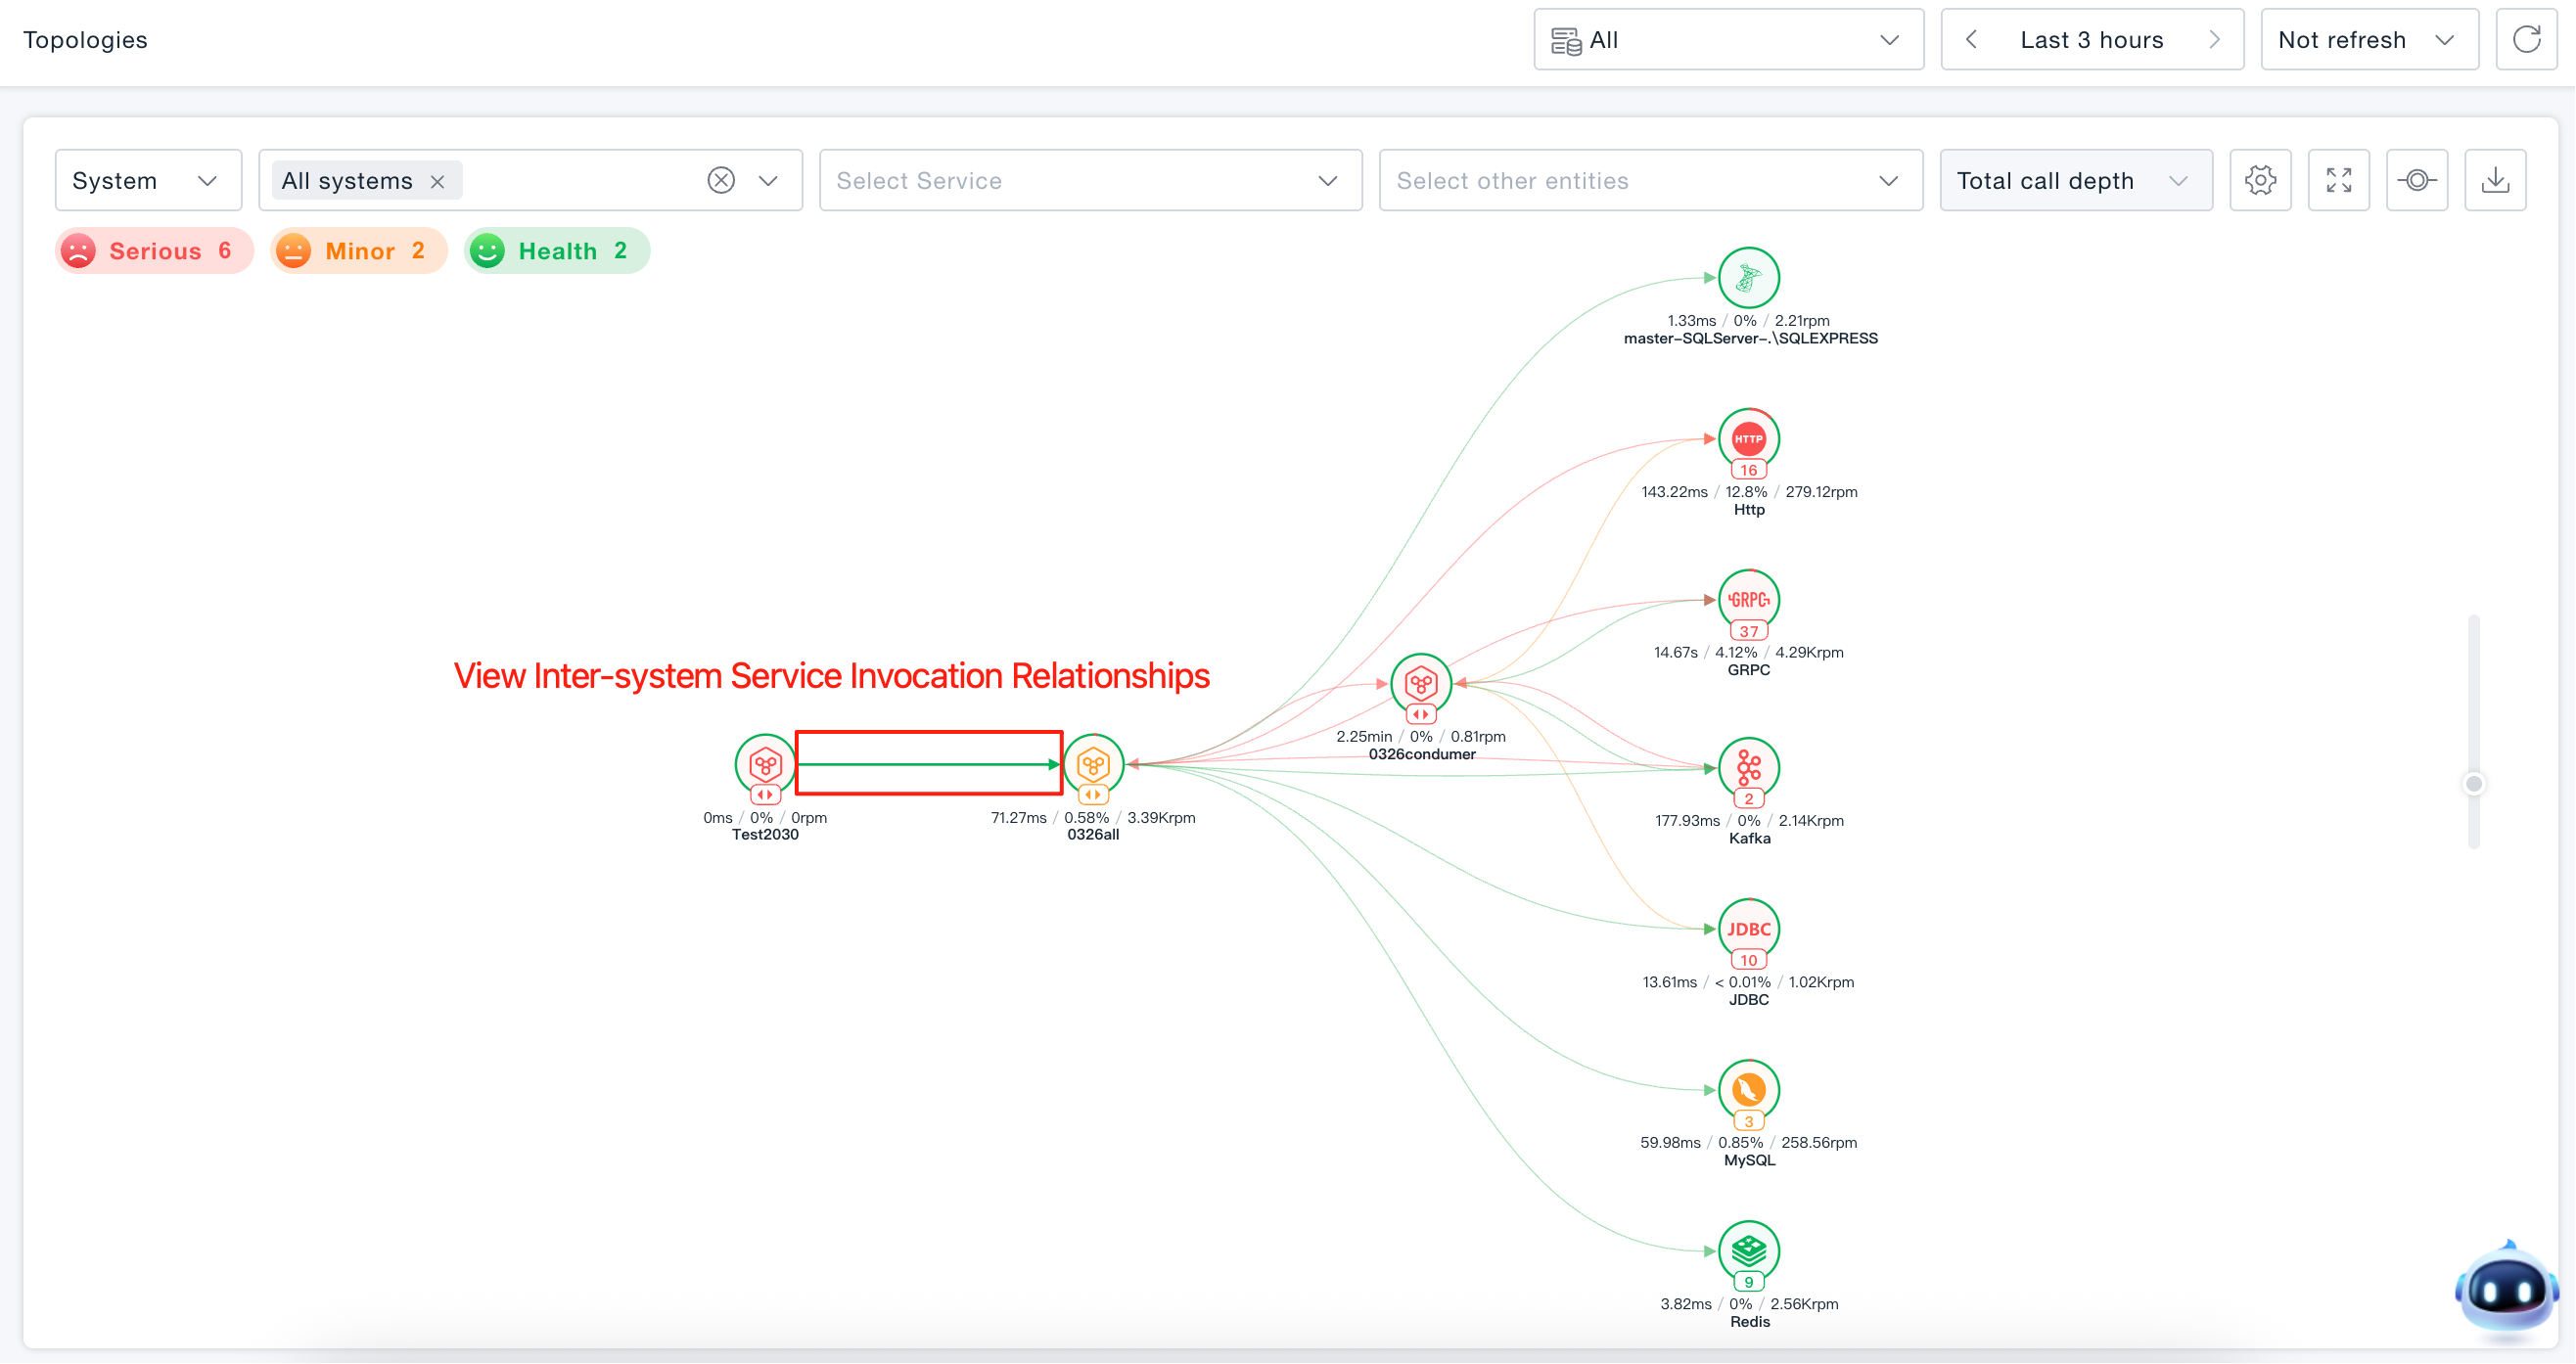
System Topology
Supports viewing invocation topology for all systems or individual systems. Enables understanding of system performance, inter-system invocation performance, and invocation performance between systems and backend entities.
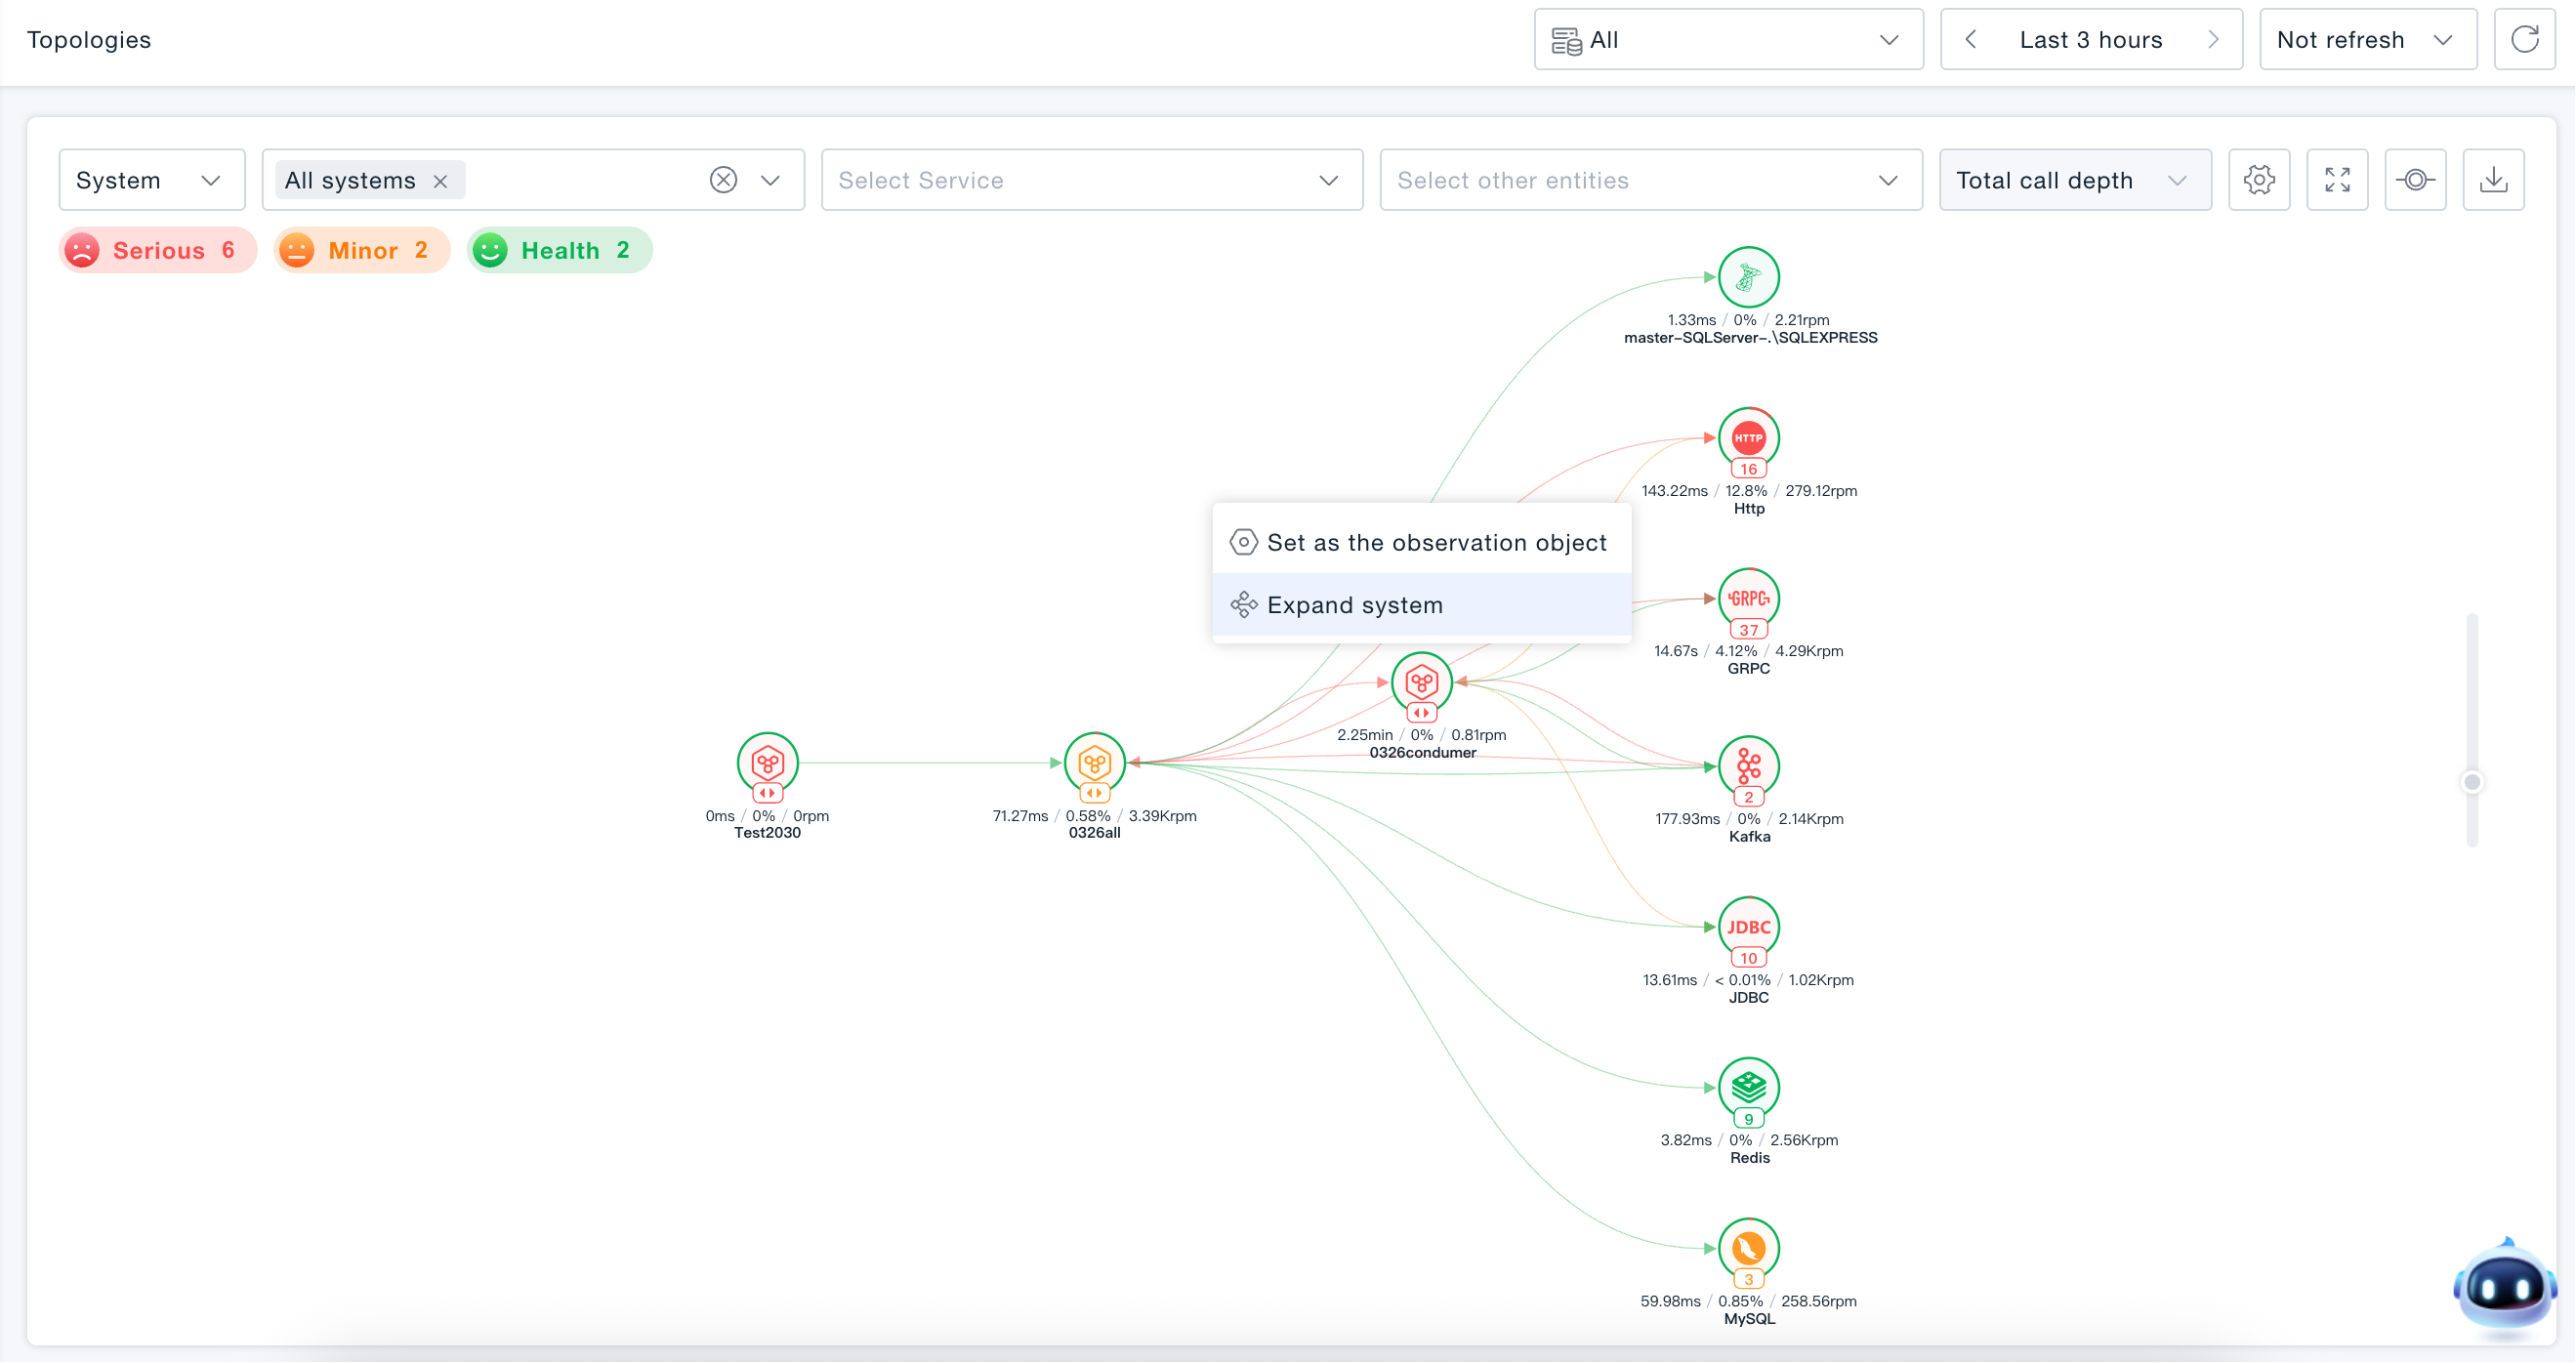
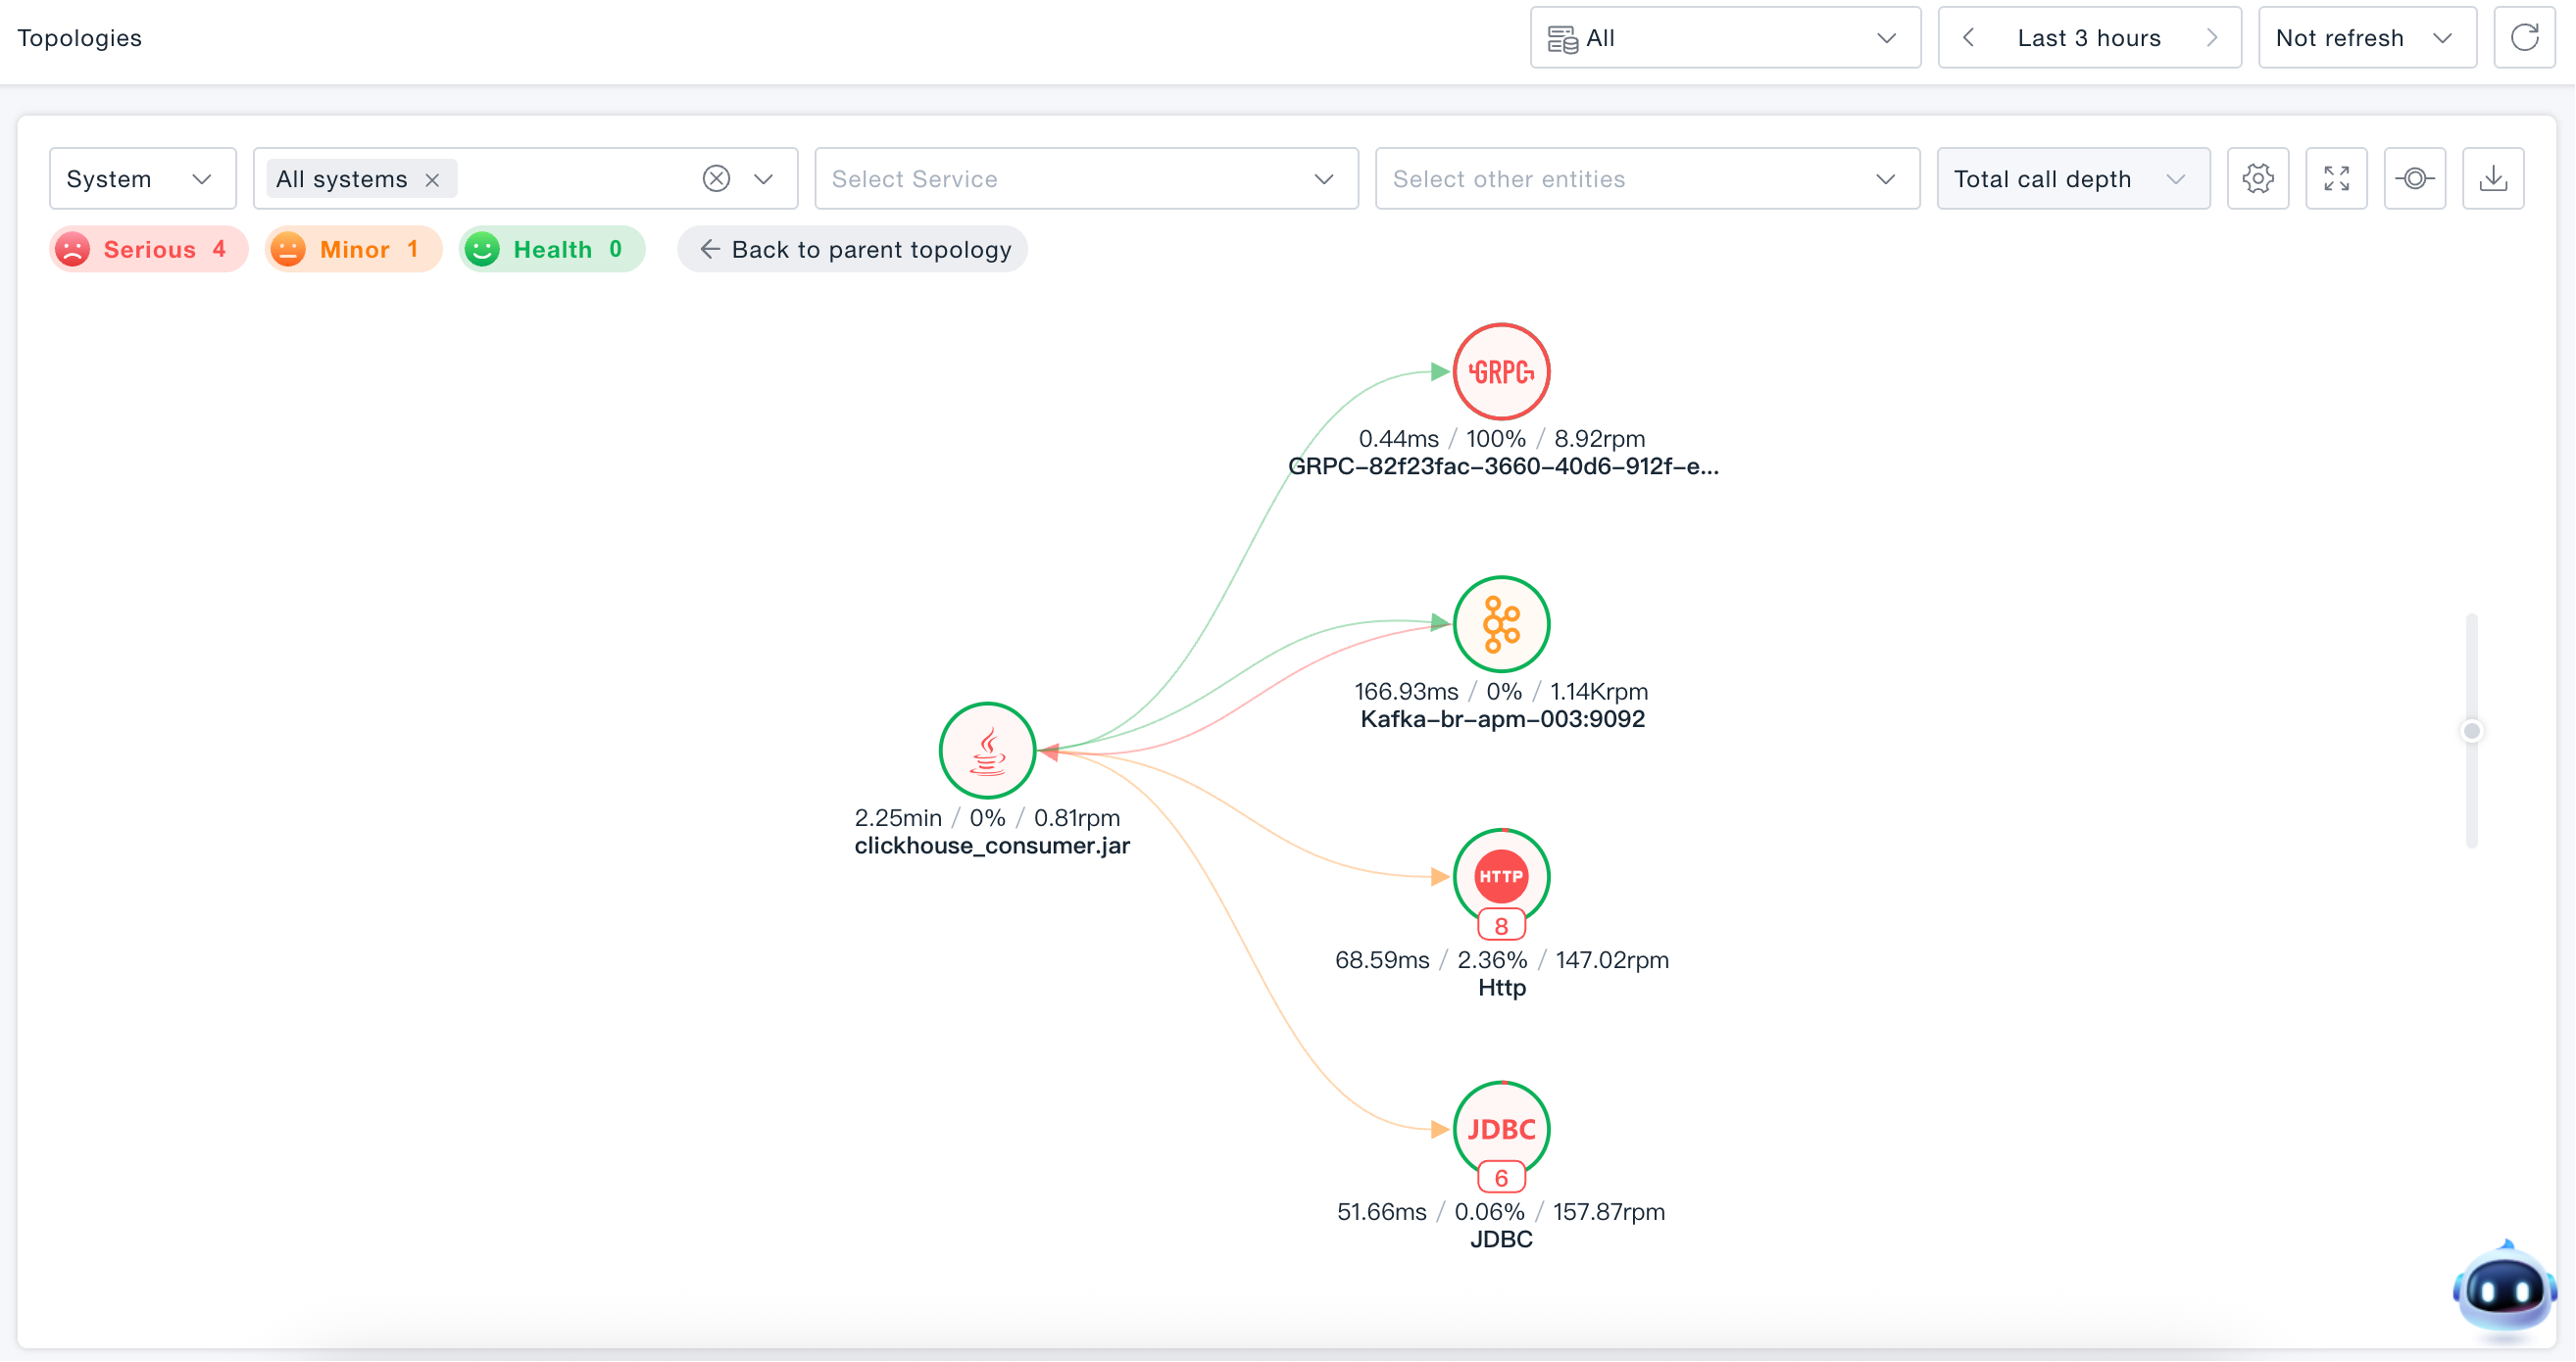
Expand System
Hover the mouse over the specified system node and click to expand the system to view the invocation topology relationships between all associated services within the system.
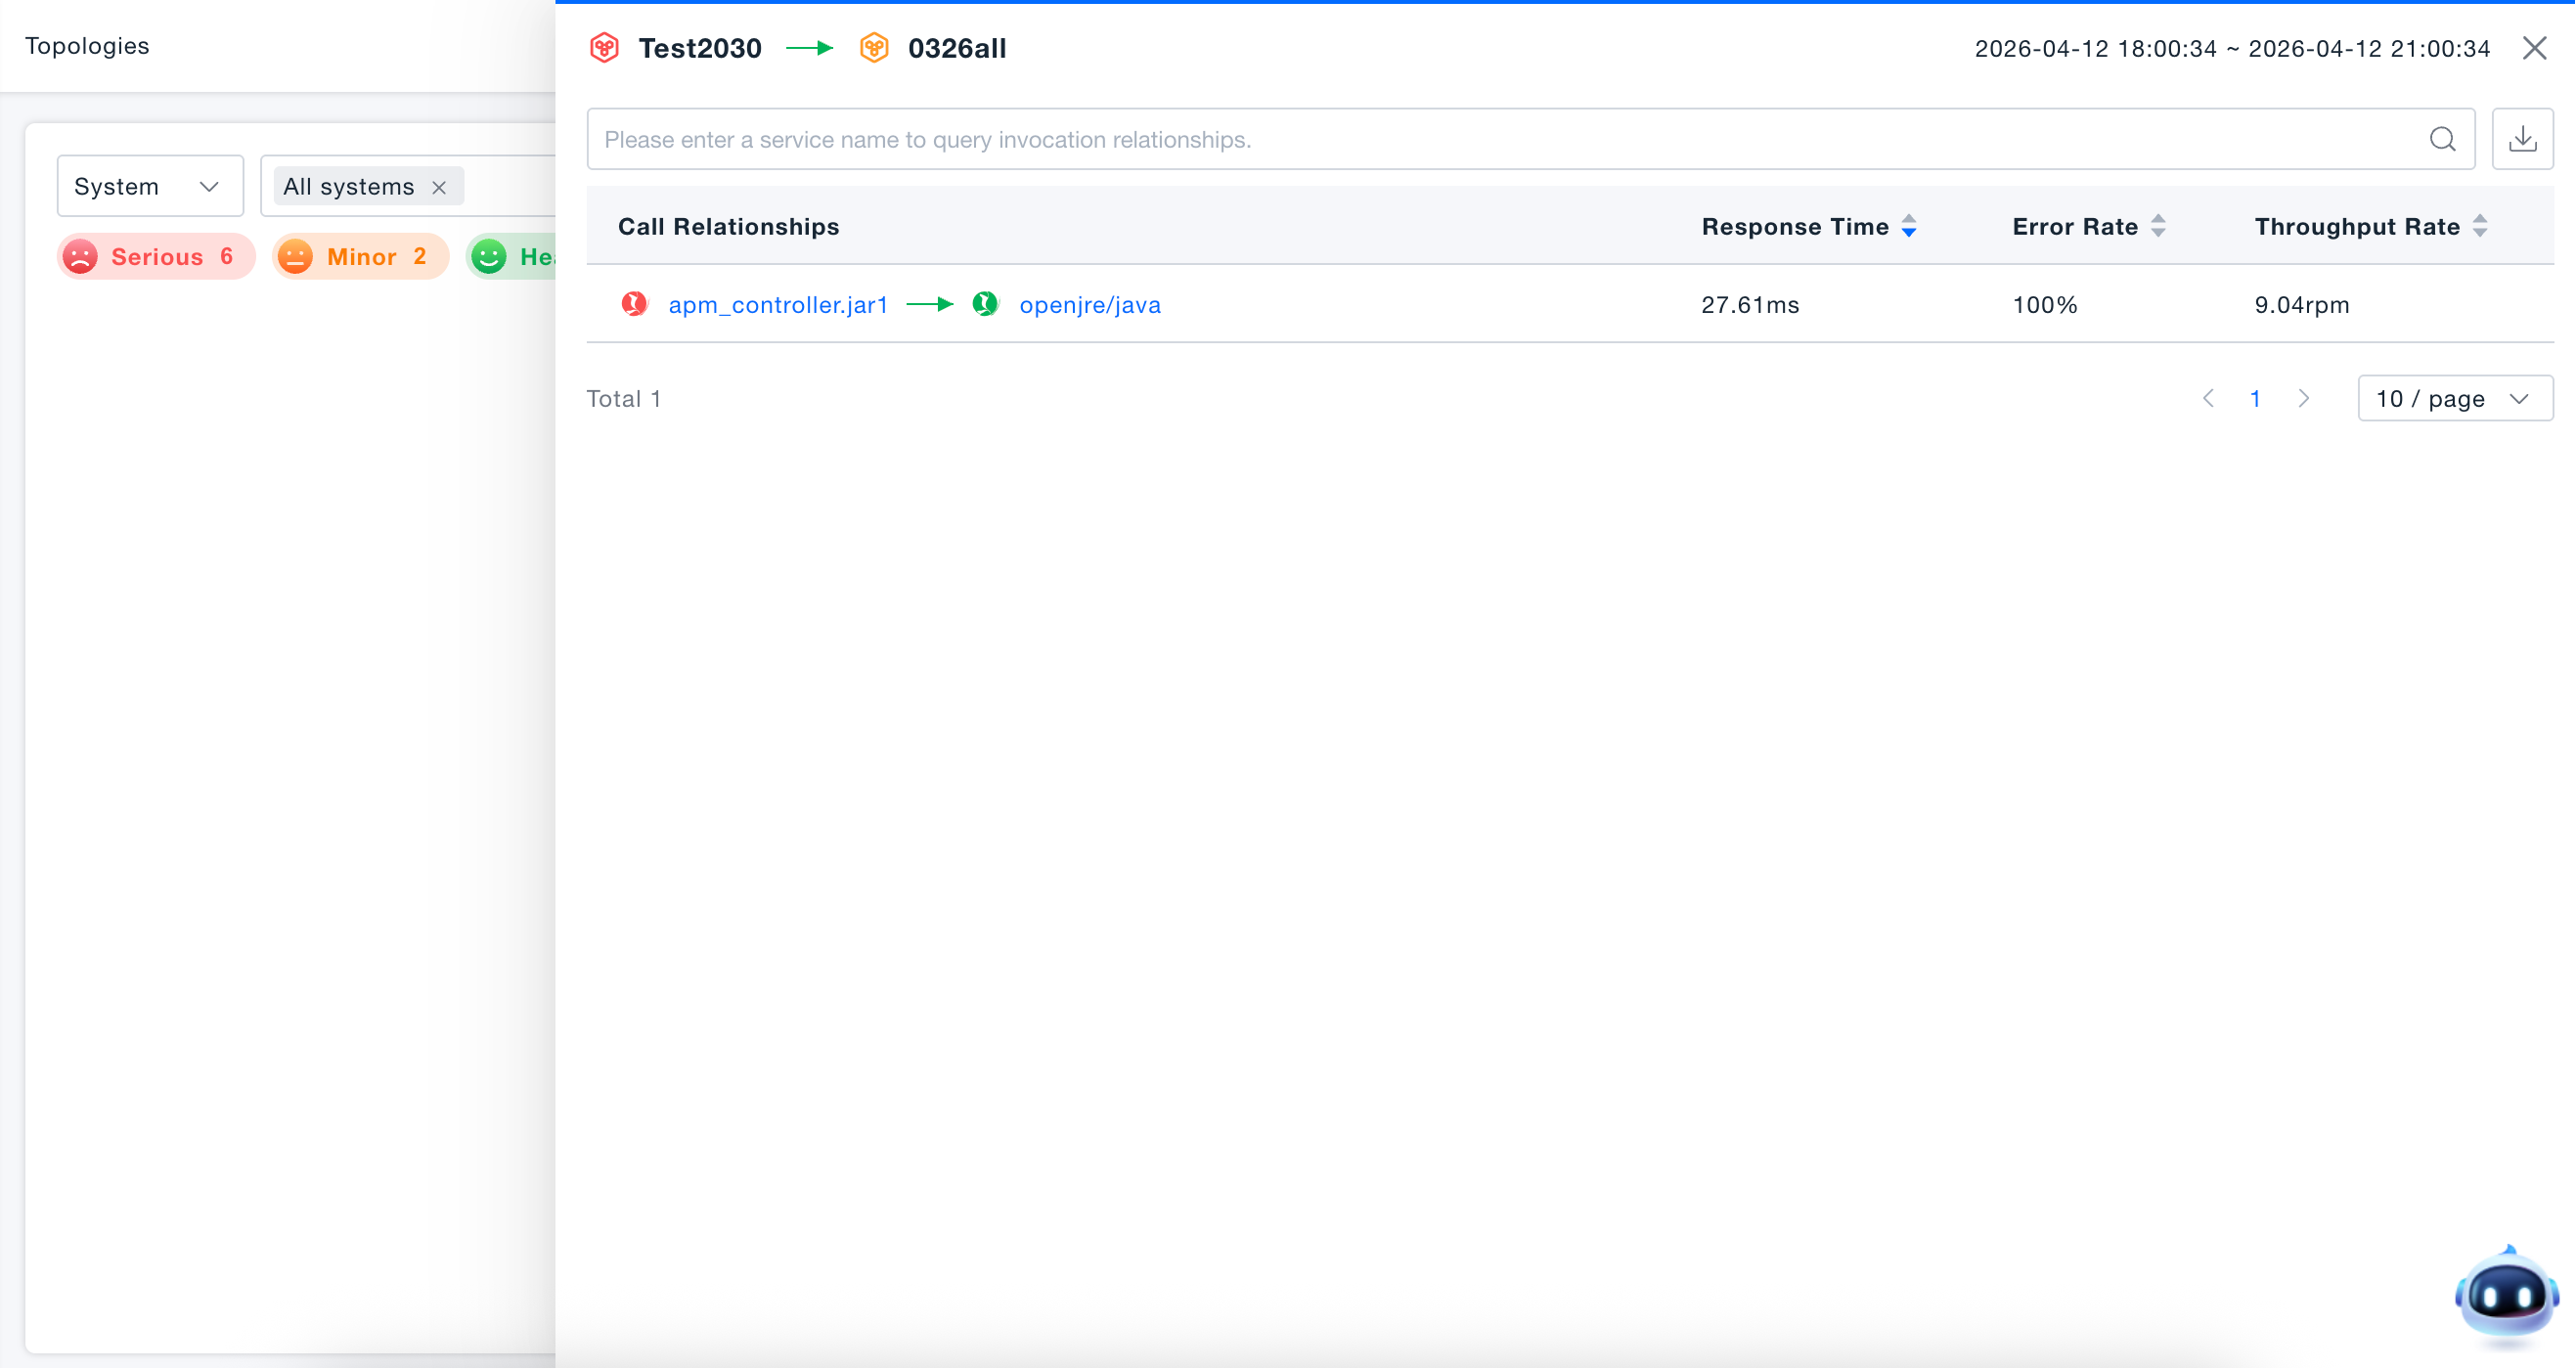
View Inter-system Service Invocation Relationships
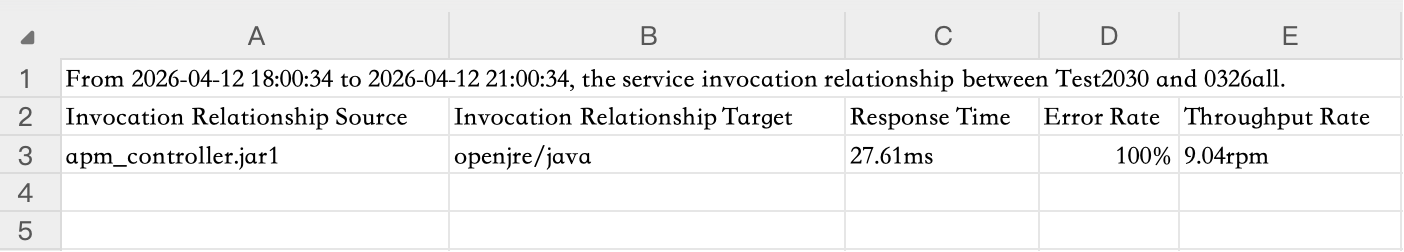
Click the inter-system invocation connection to open the service invocation relationship list in a drawer form, supporting detail viewing, filtering, sorting, and export.
- Information Display: Service technology type, name, response time, error rate, throughput
- Interactive Operations: Open service information drawer by service name, service name filtering, metric sorting, Excel export
Service Topology
Supports viewing invocation topology for all services or individual services. Enables understanding of service performance, inter-service invocation performance, and invocation performance between services and backend entities.
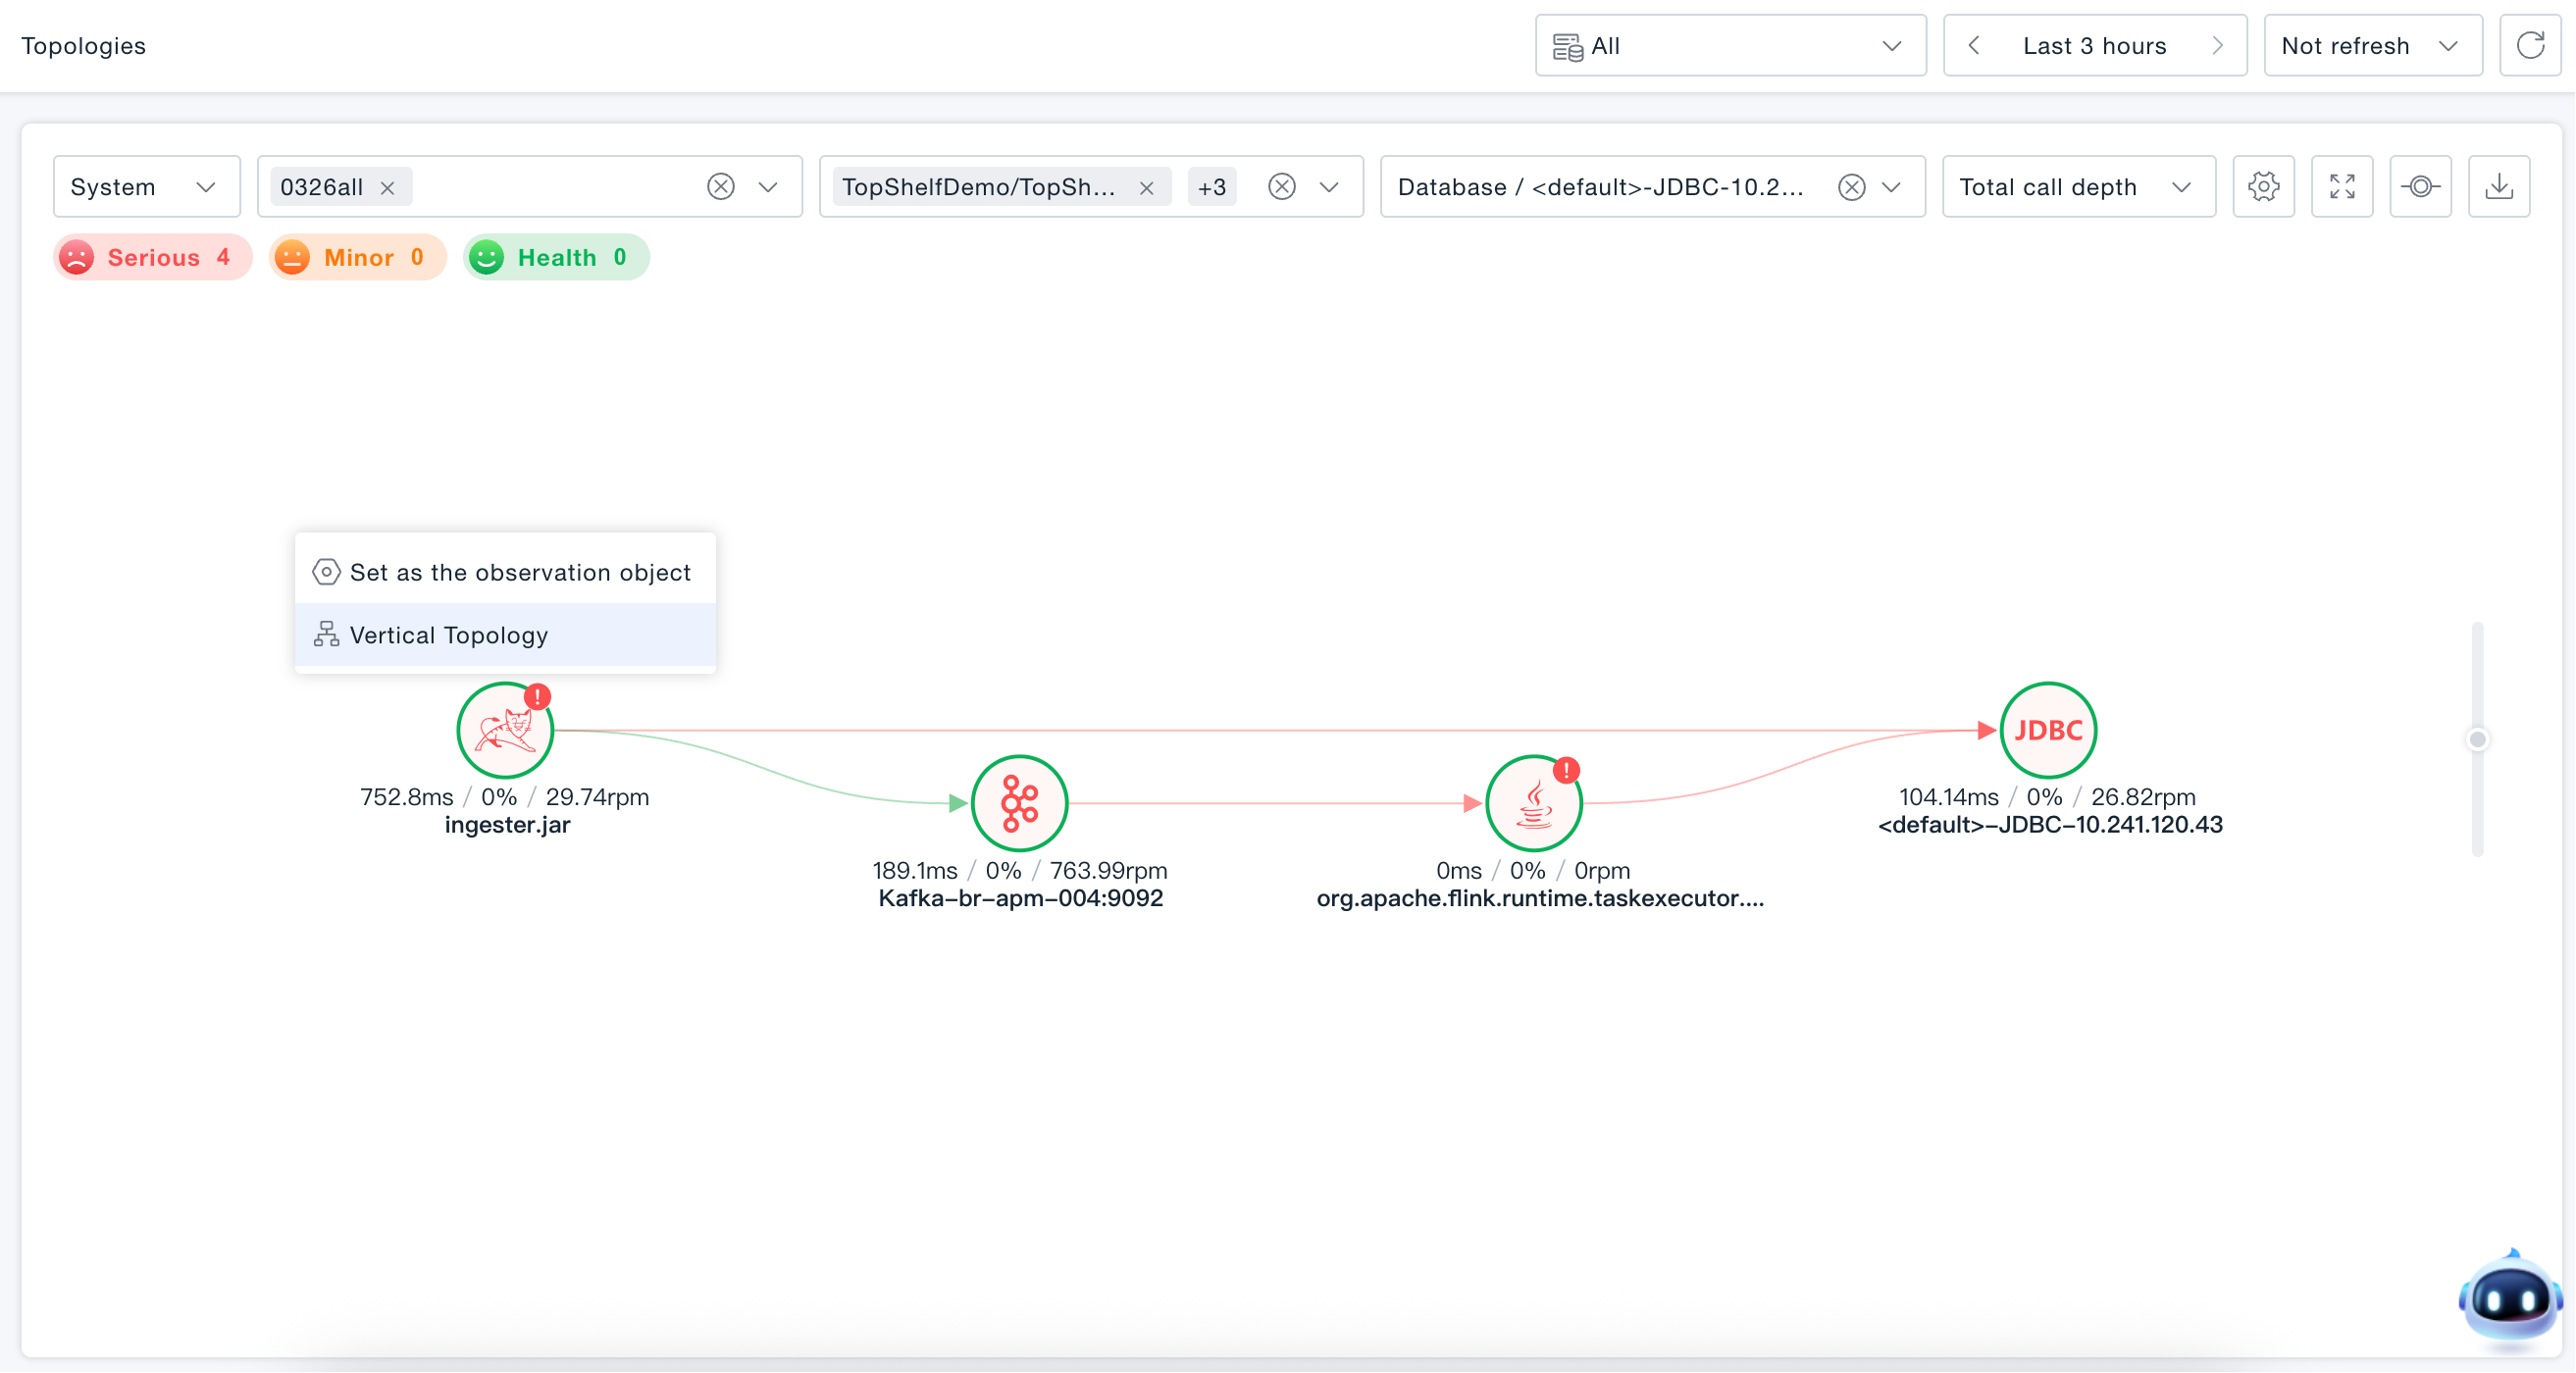
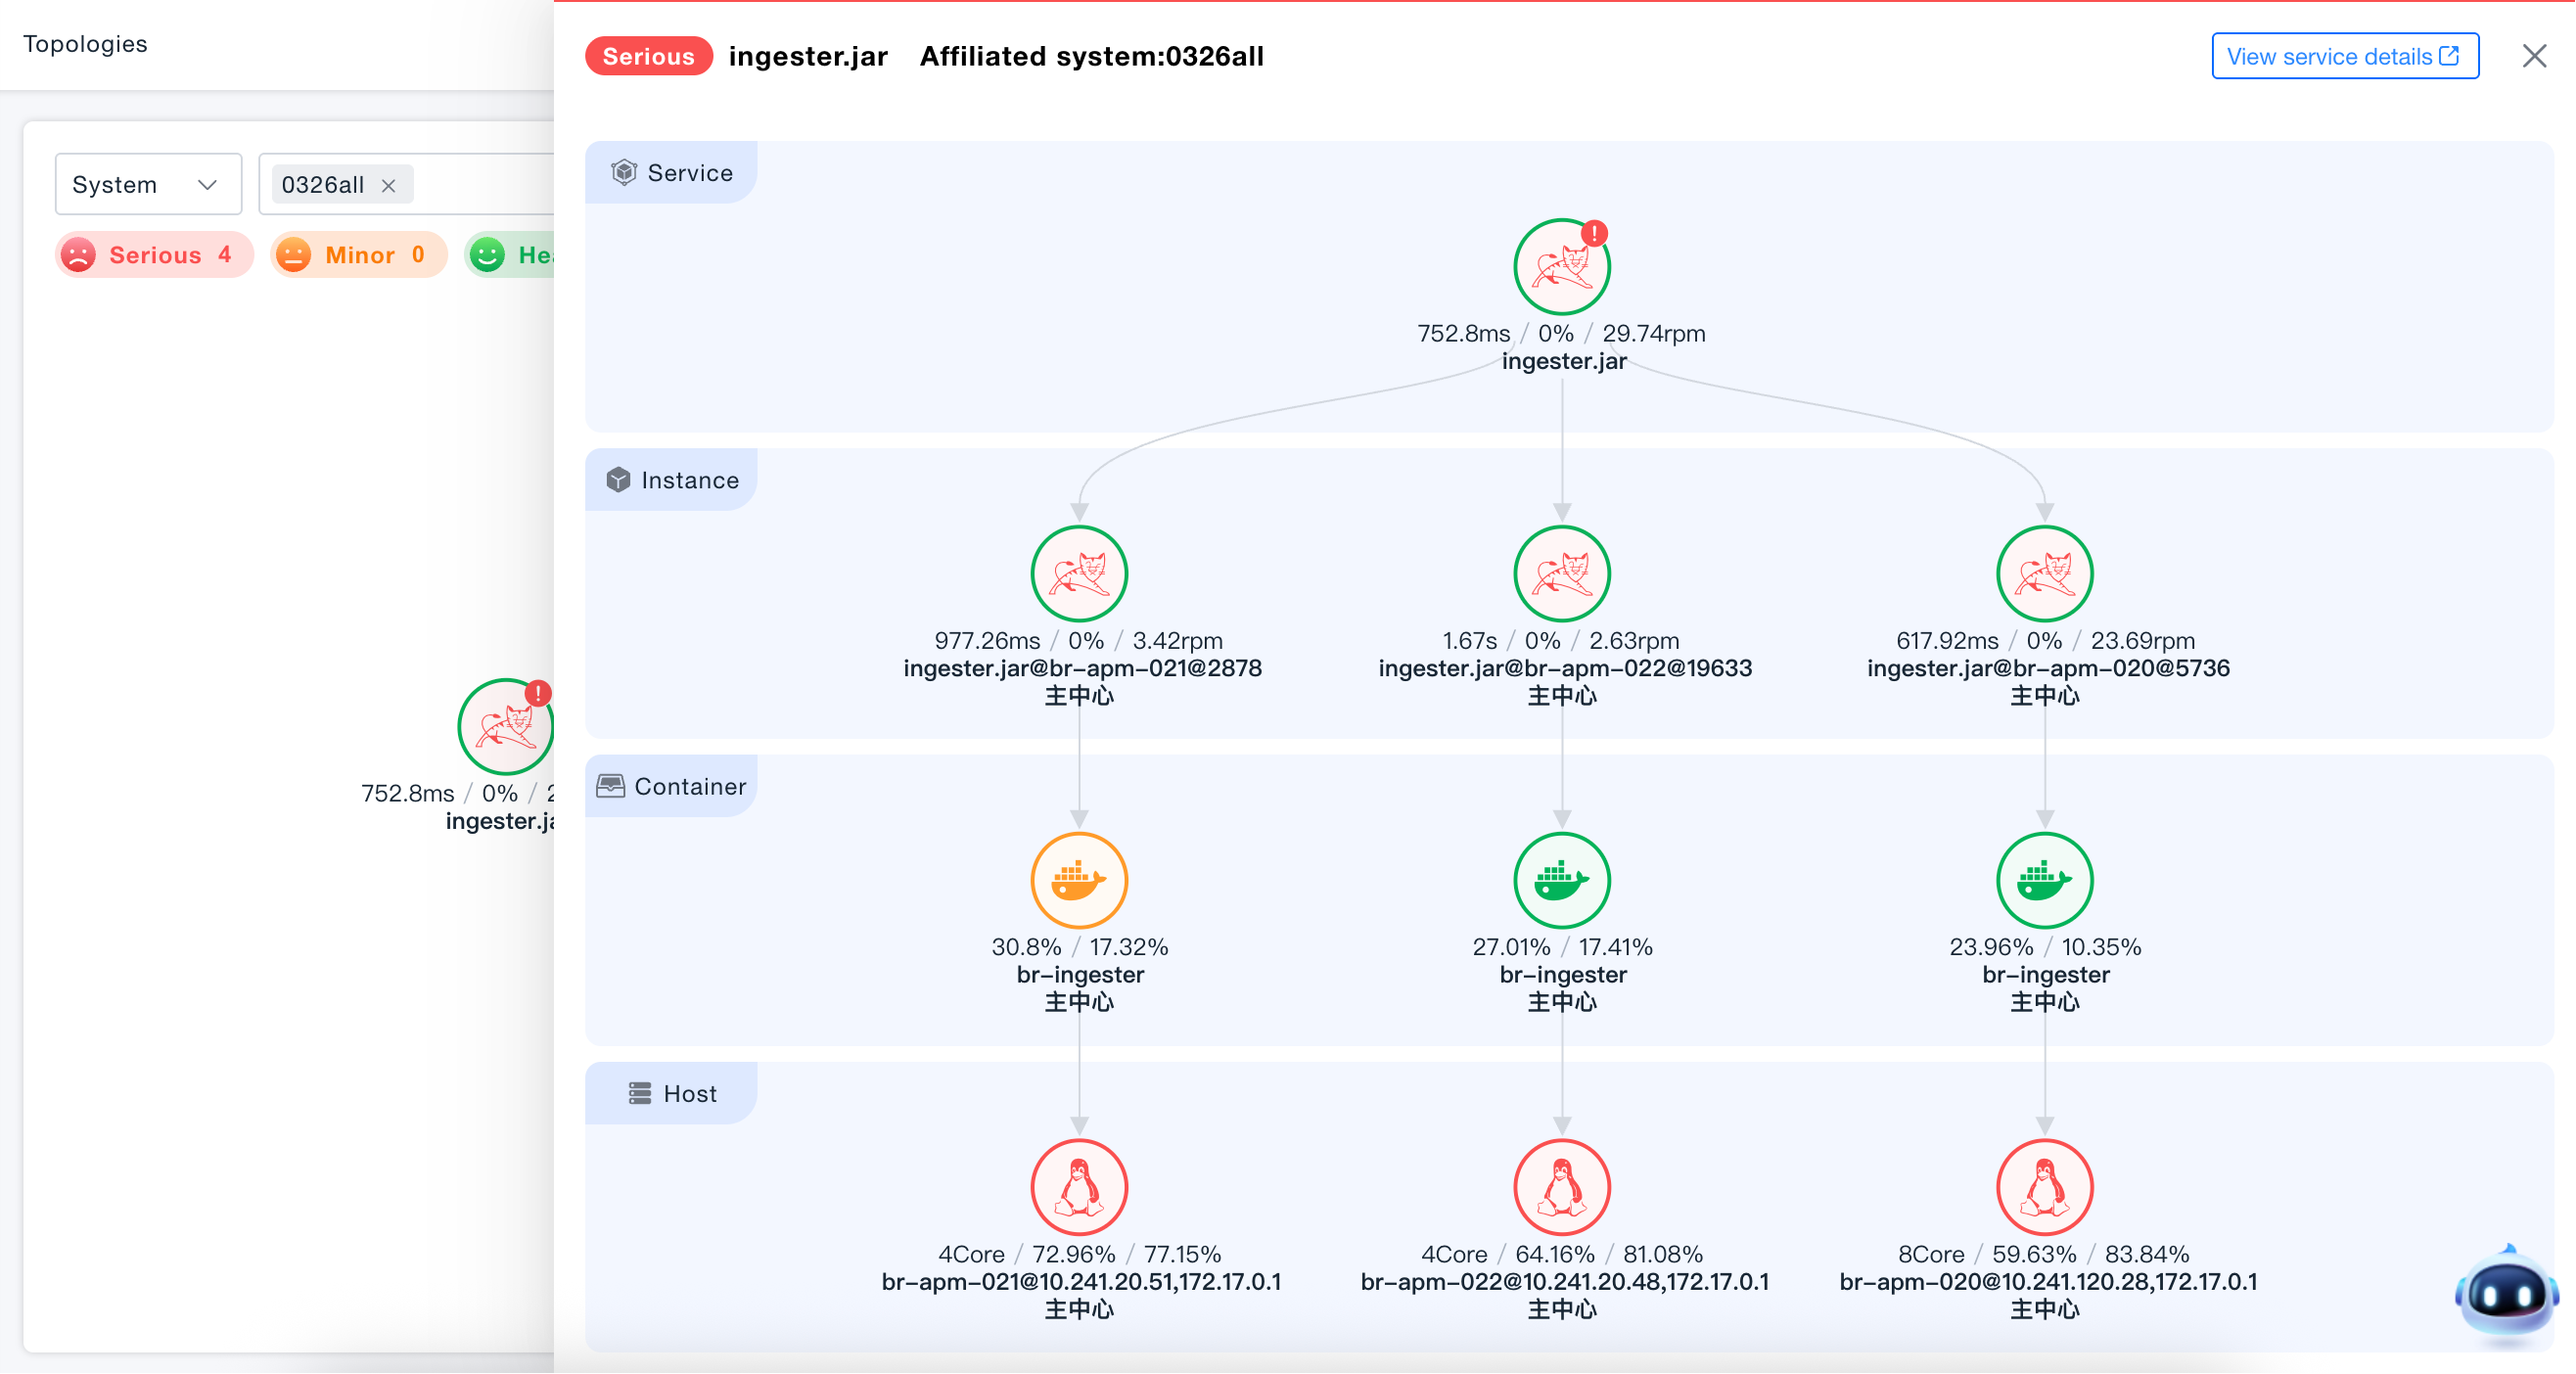
Vertical Topology
Hover the mouse over the specified service node and click Vertical Topology to view the vertical dependency relationships of the current service, understand the dependencies between instances, containers, and hosts, and analyze instance load and resource utilization.
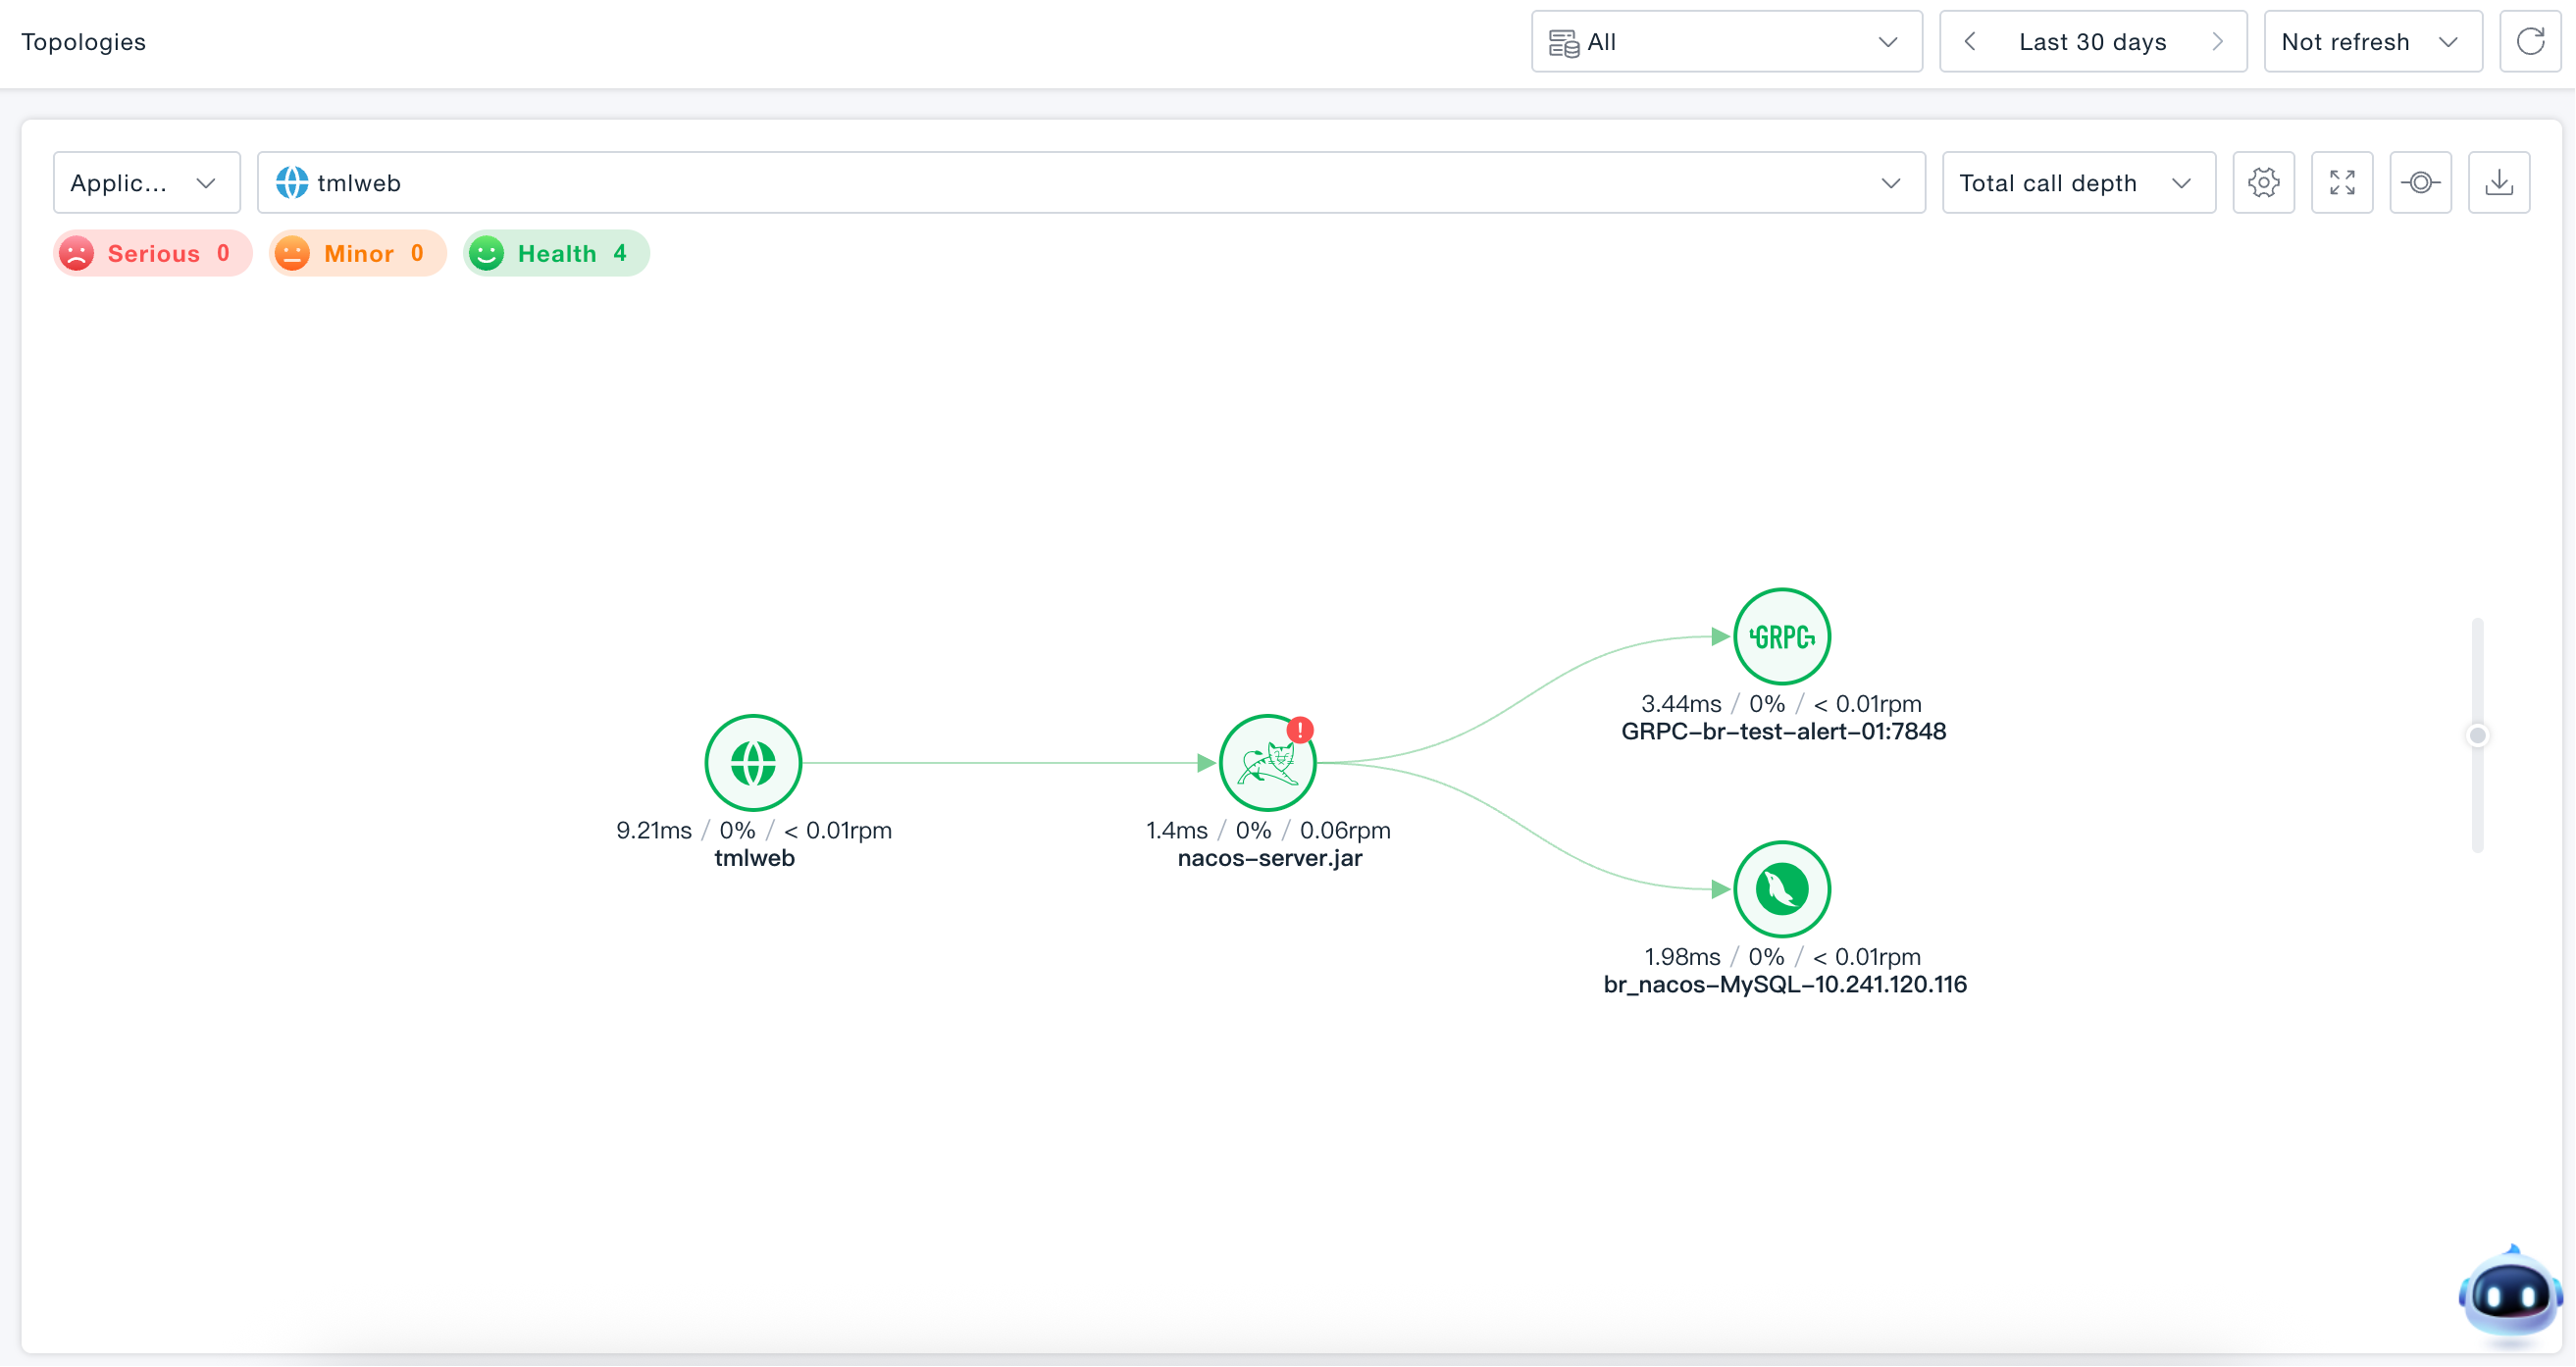
Application Topology
Supports viewing invocation topology for individual applications. Enables understanding of application performance and invocation performance between applications and backend services and entities.
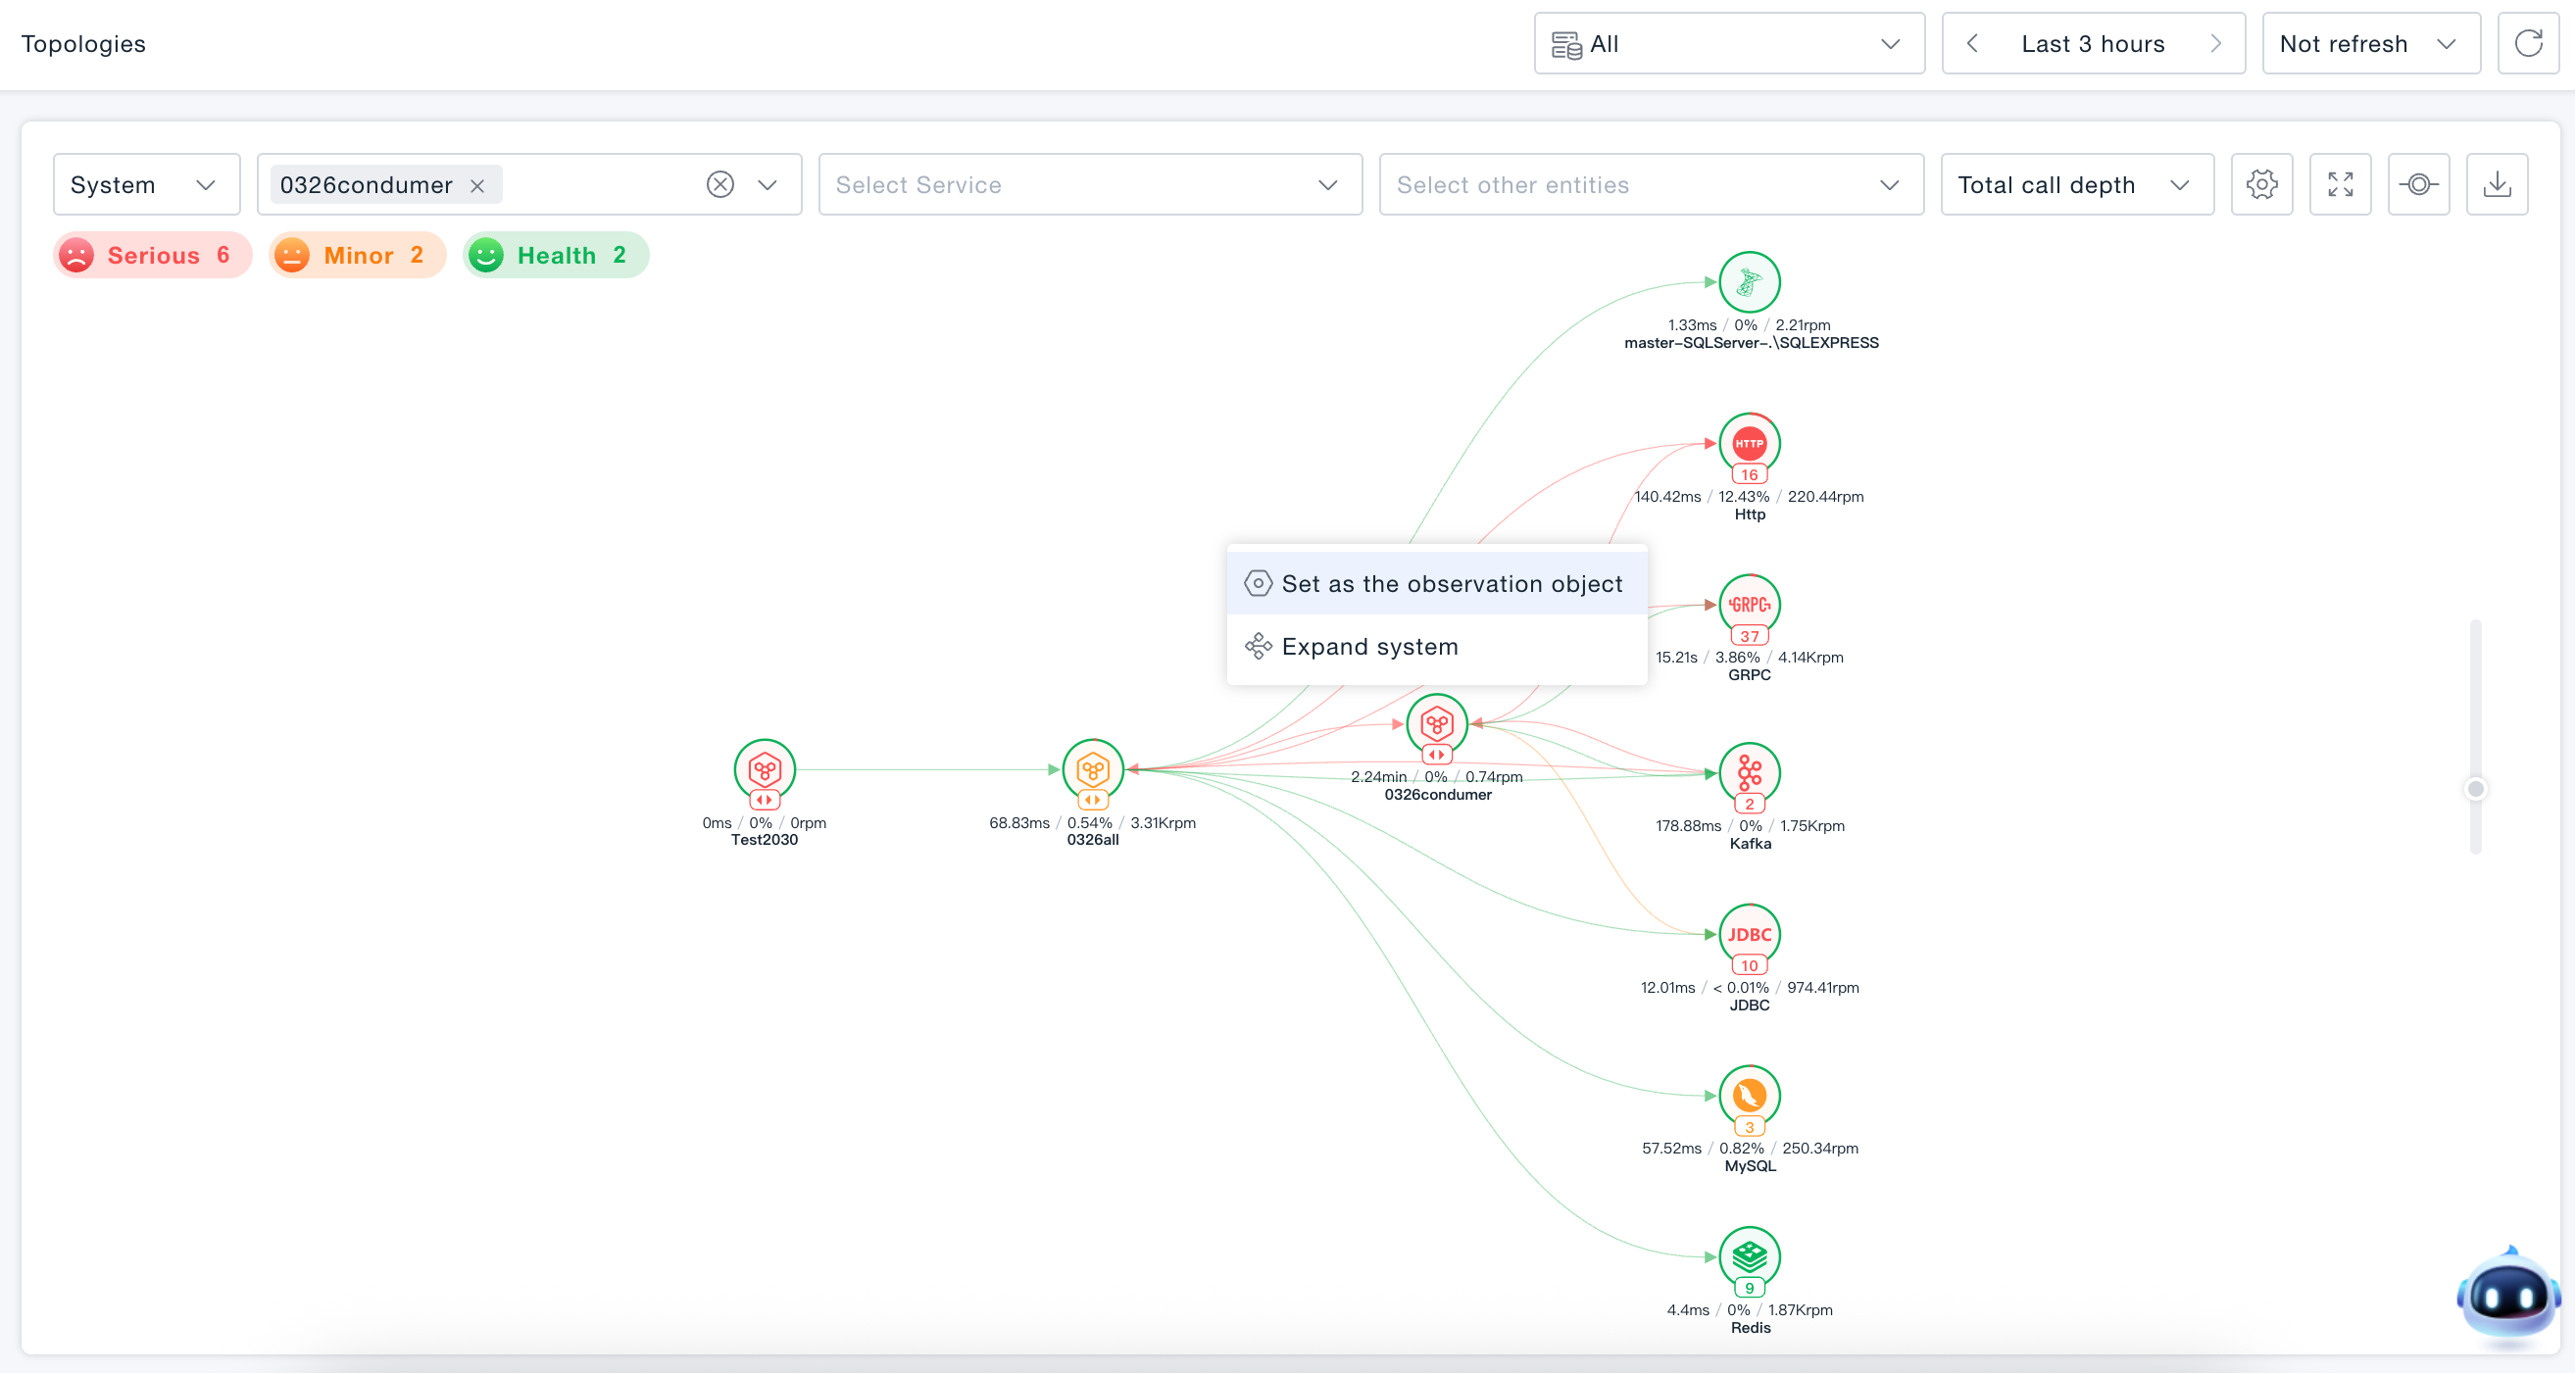
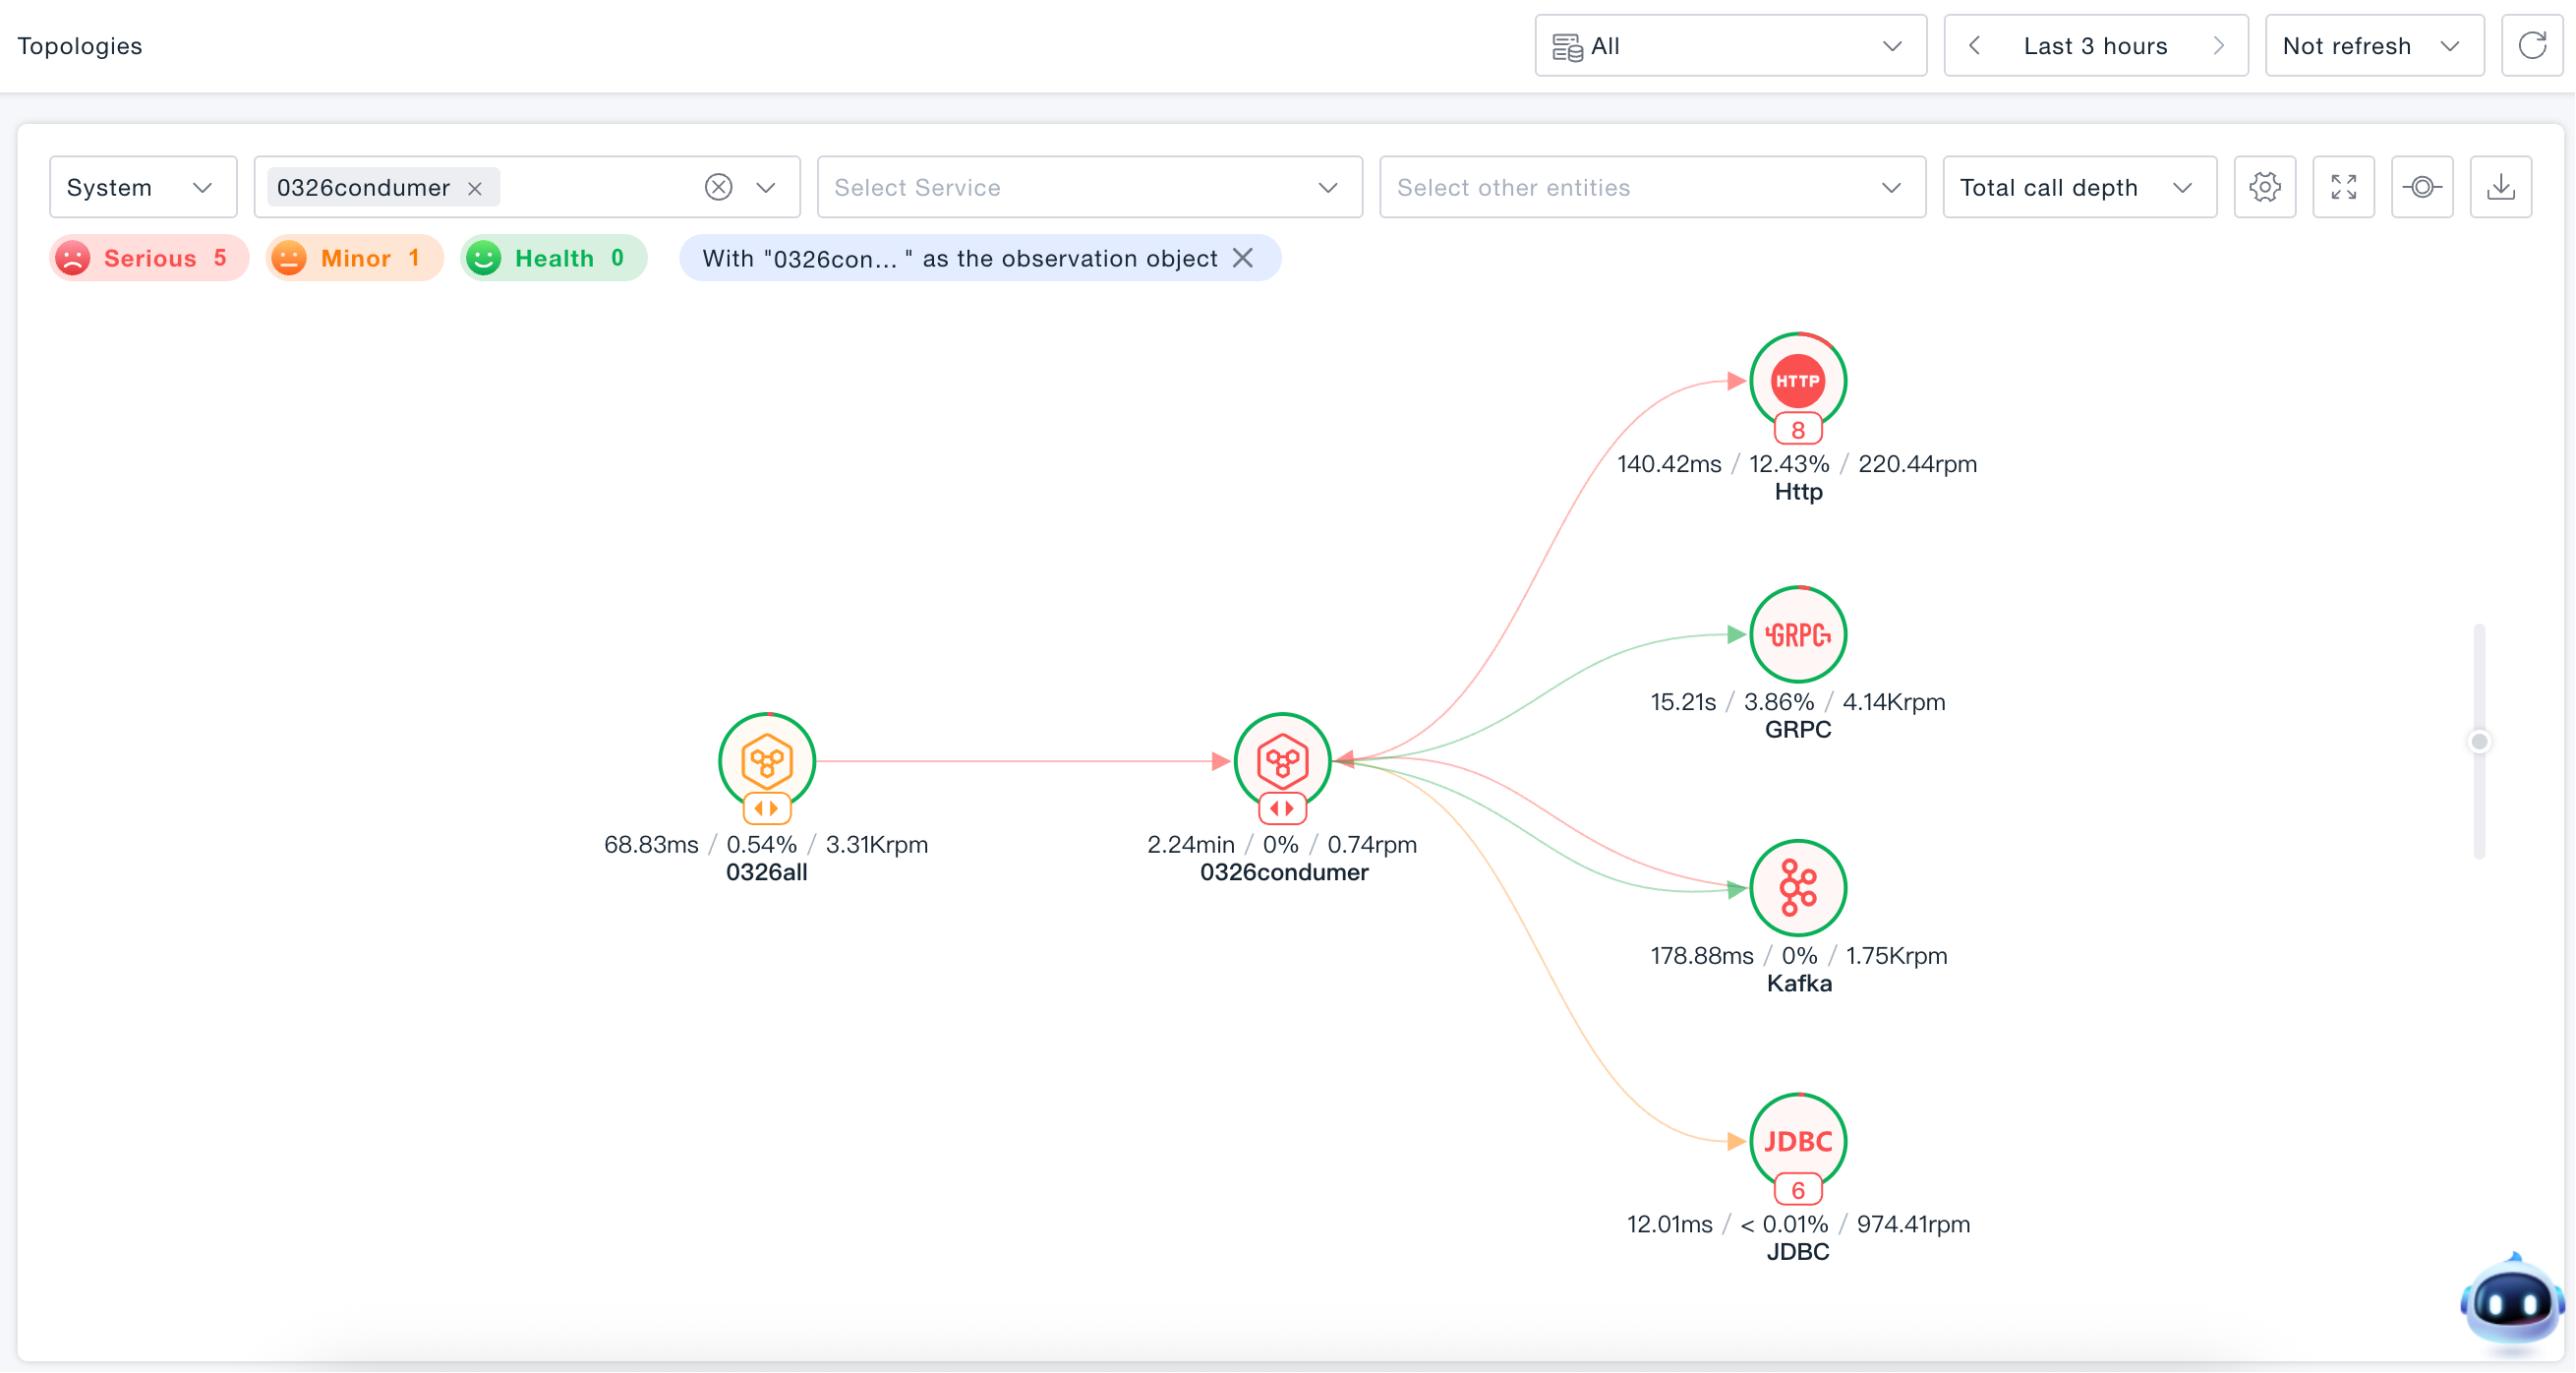
Set as Observation Object
Hover the mouse over the specified node and click Set as Observation Object. The topology diagram will be re-rendered with this node as the core, only retaining entities directly associated with the observation object (i.e., entities with direct invocation relationships upstream and downstream), and hiding isolated nodes.
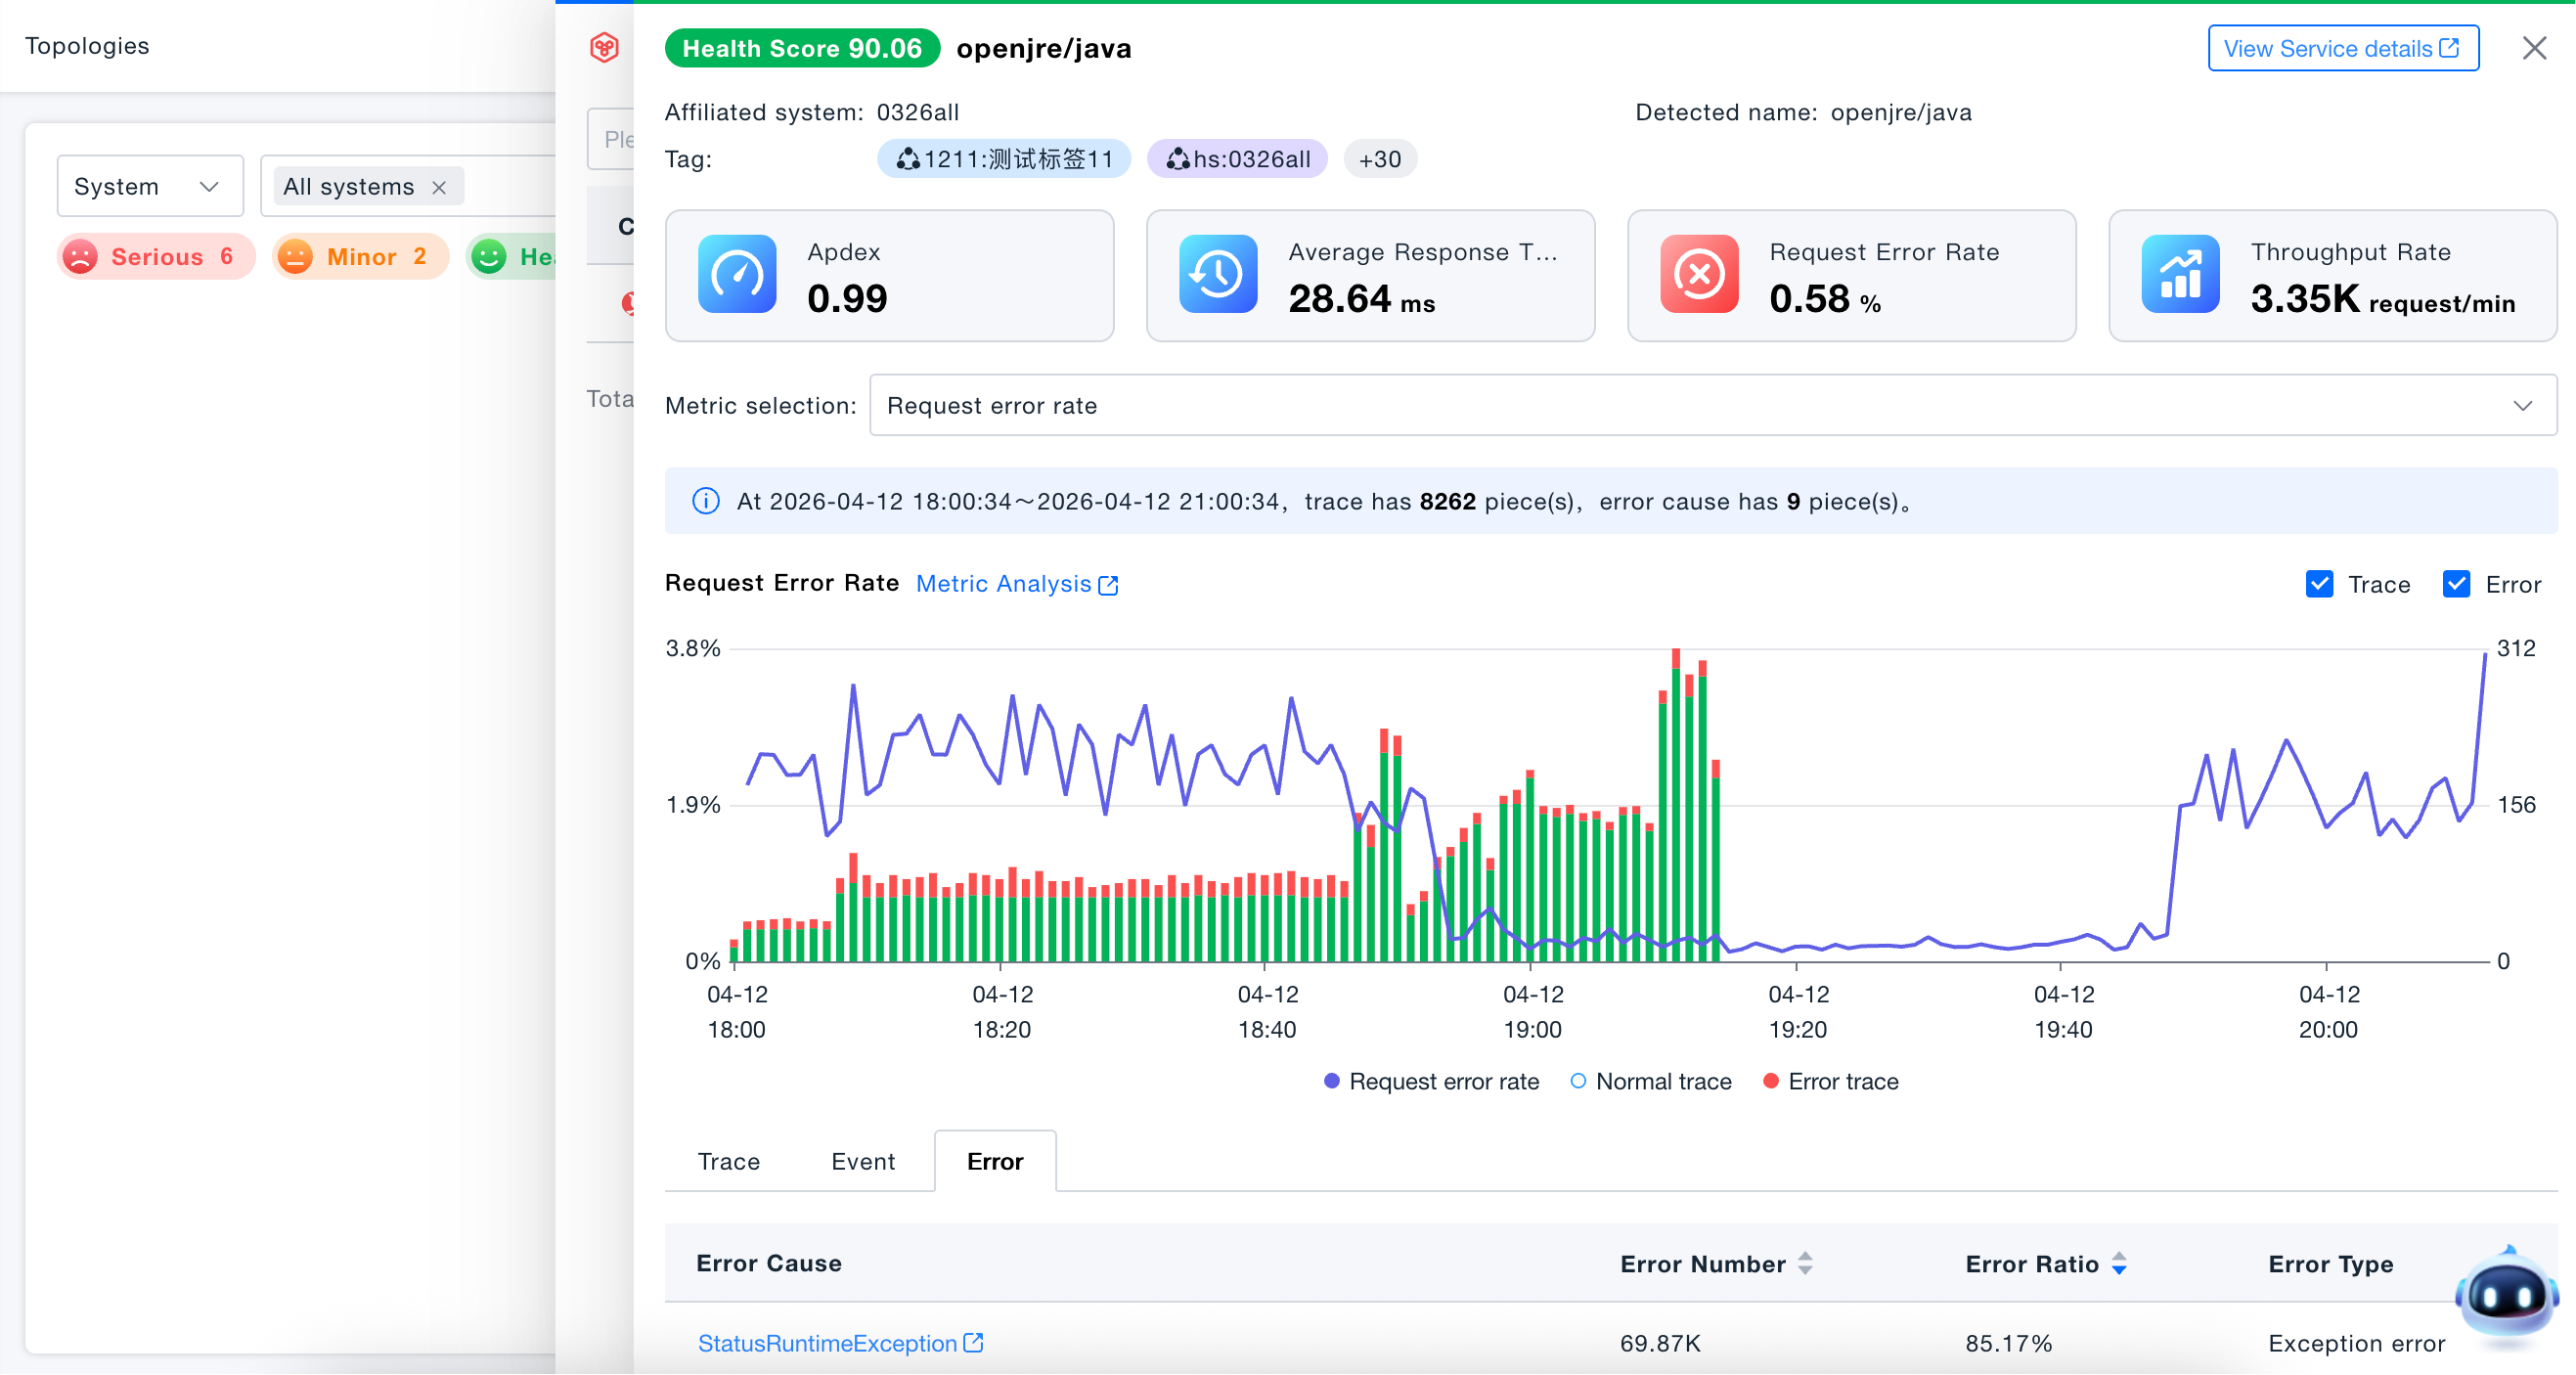
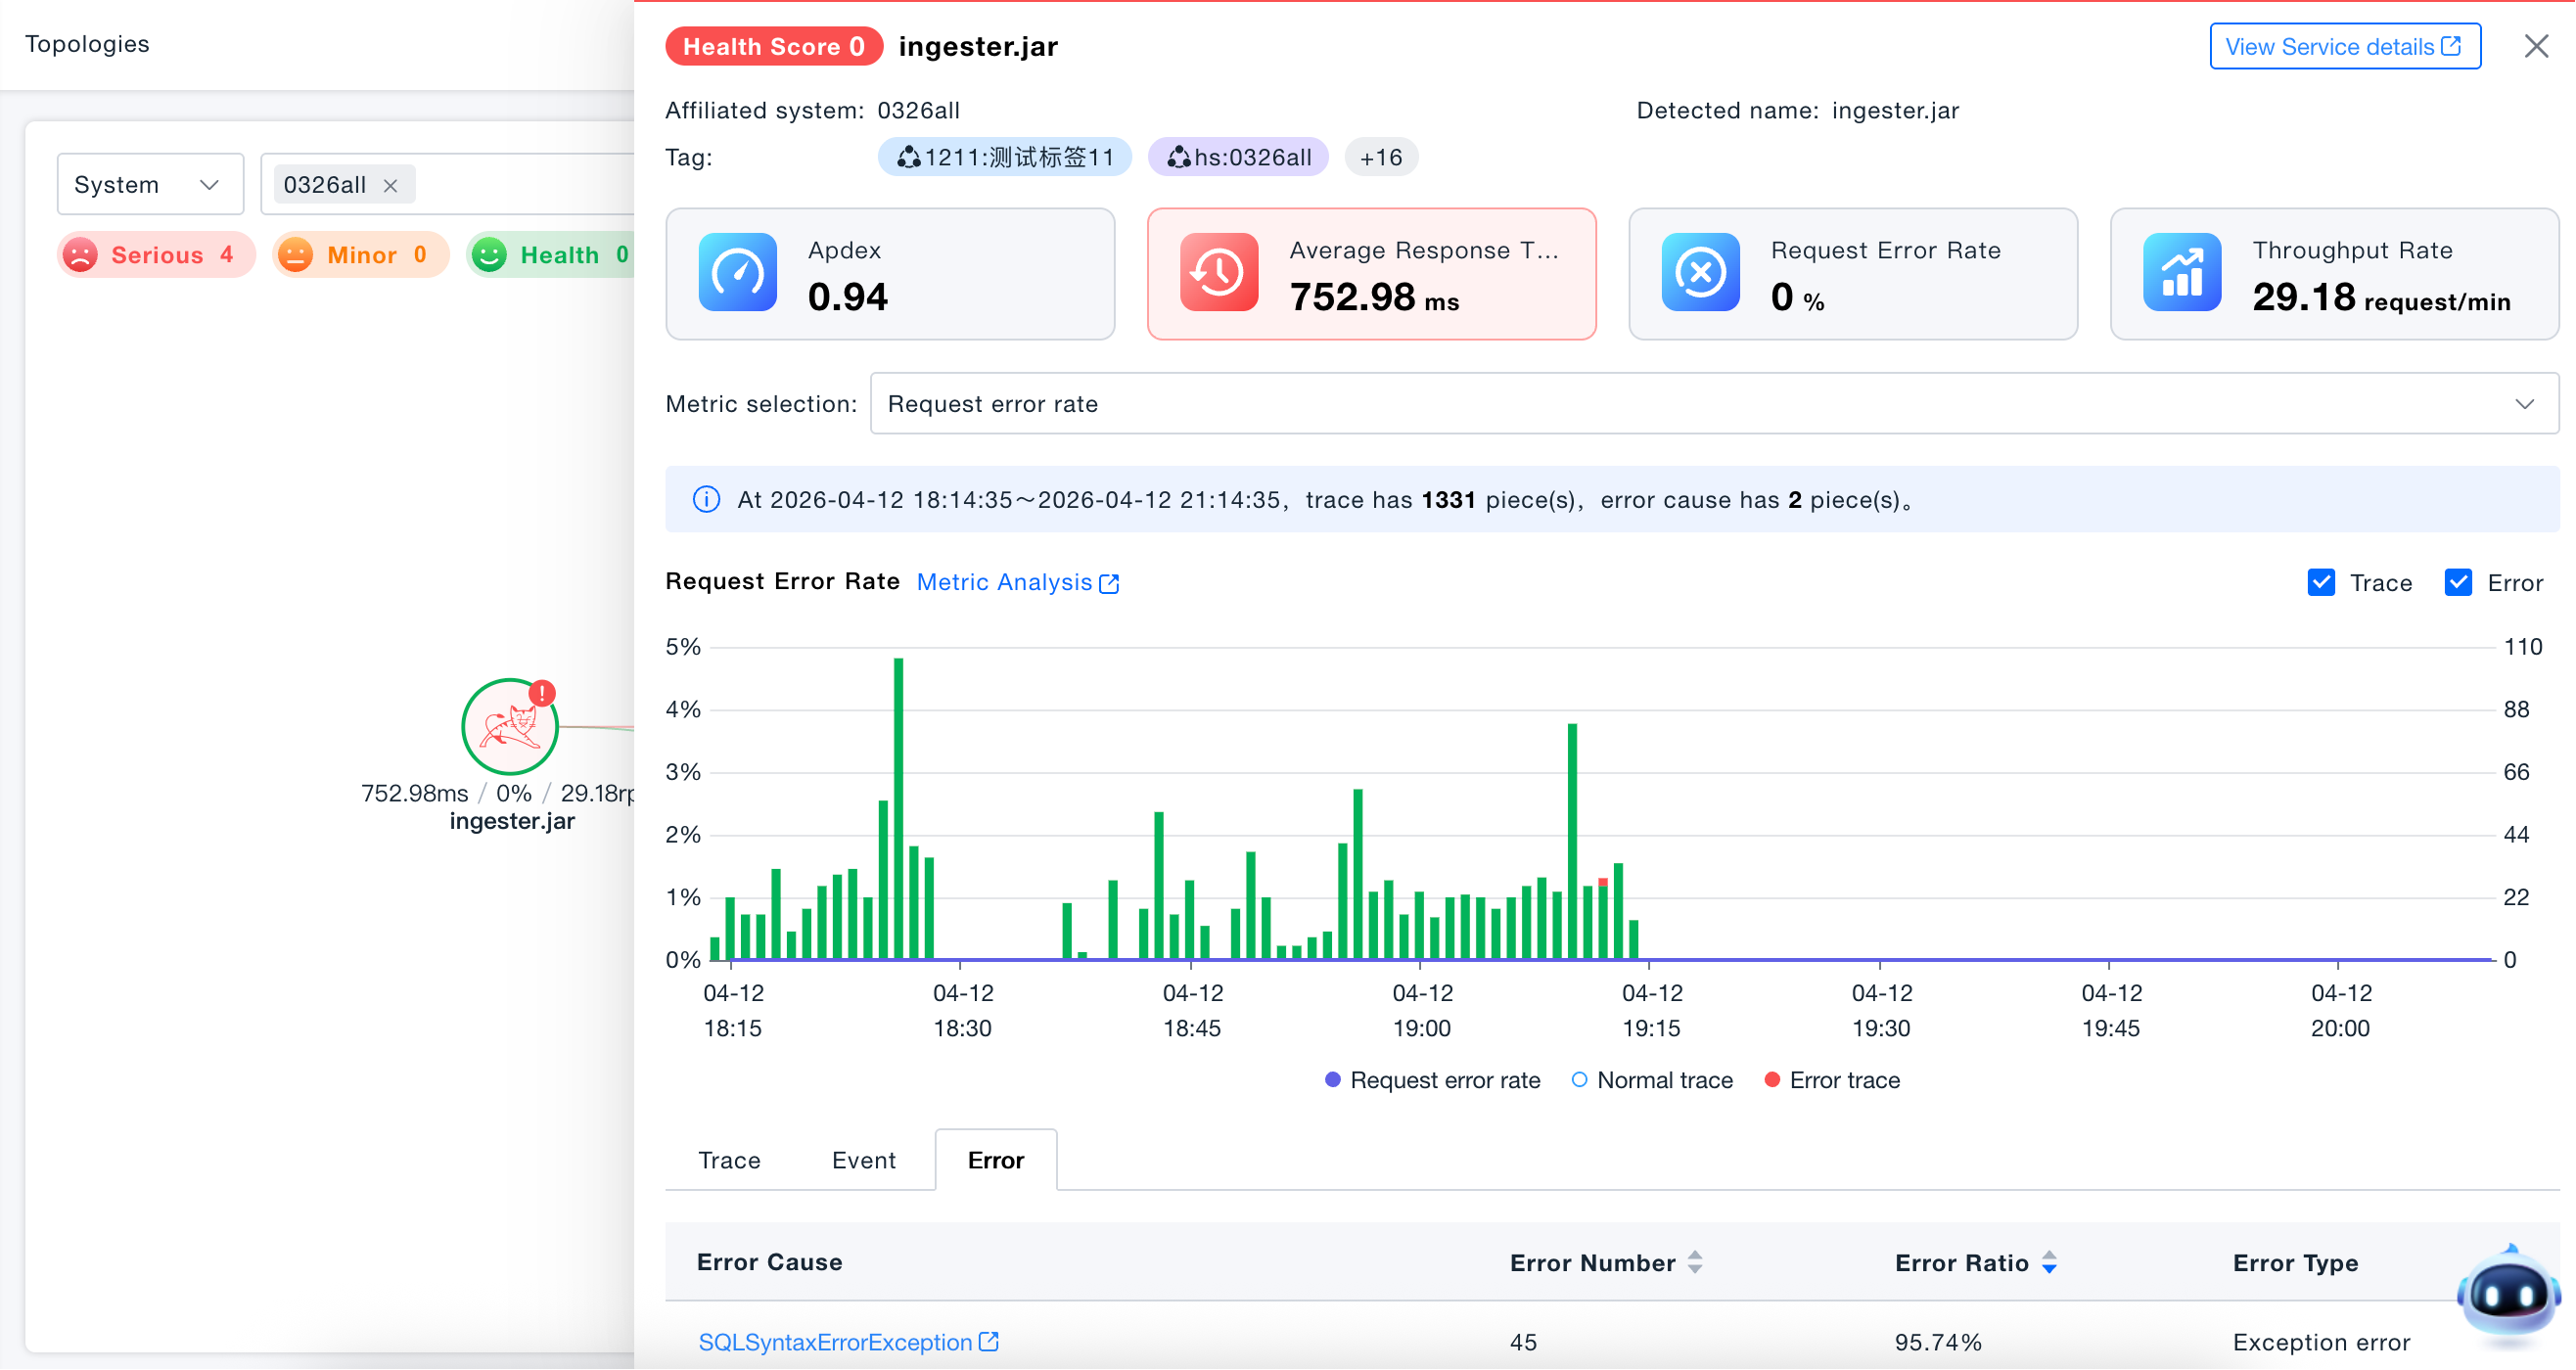
Node Overview
Click any node to enter the node overview, which supports node health analysis. You can correlate from key metrics to traces, events, and errors, and quickly locate critical traces, important events, or error analysis in one step, helping to rapidly identify performance issues. Any node supports viewing metrics or issue overviews, allowing you to view key metrics and any other metrics. Flexible correlation tools for metrics, traces, and events facilitate rapid problem localization.
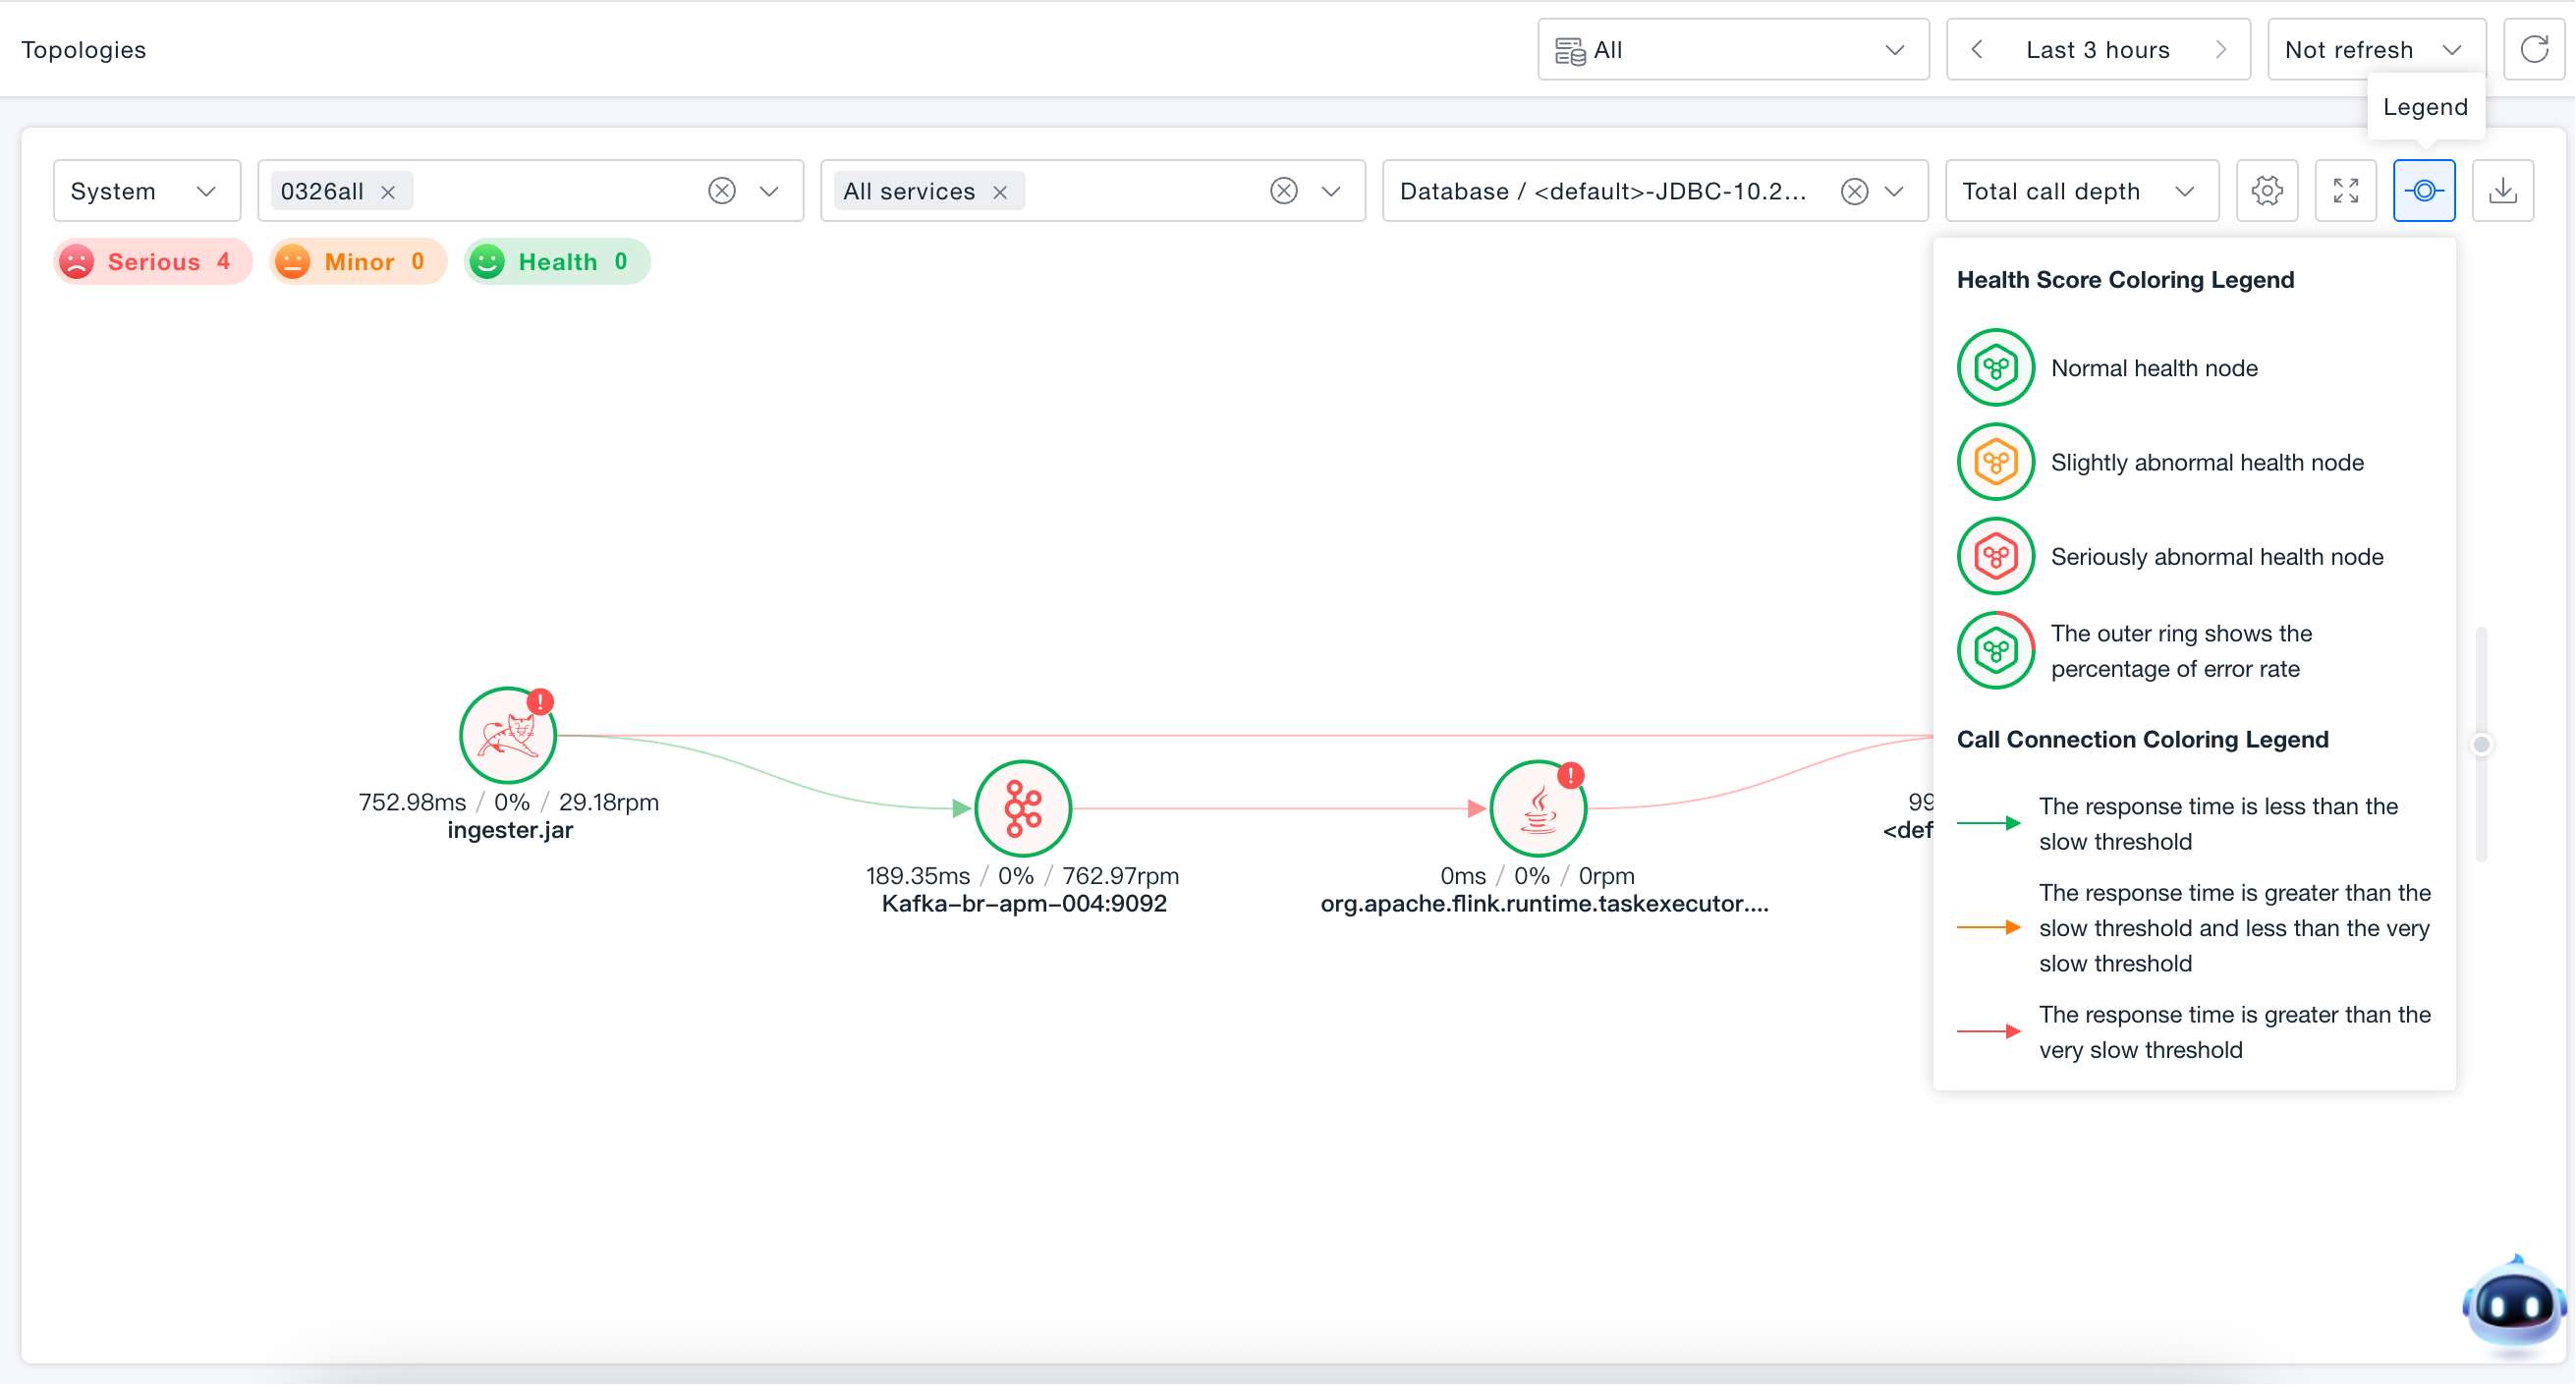
Topology Coloring
Users can modify the topology node coloring scheme based on health score or problem alerts.
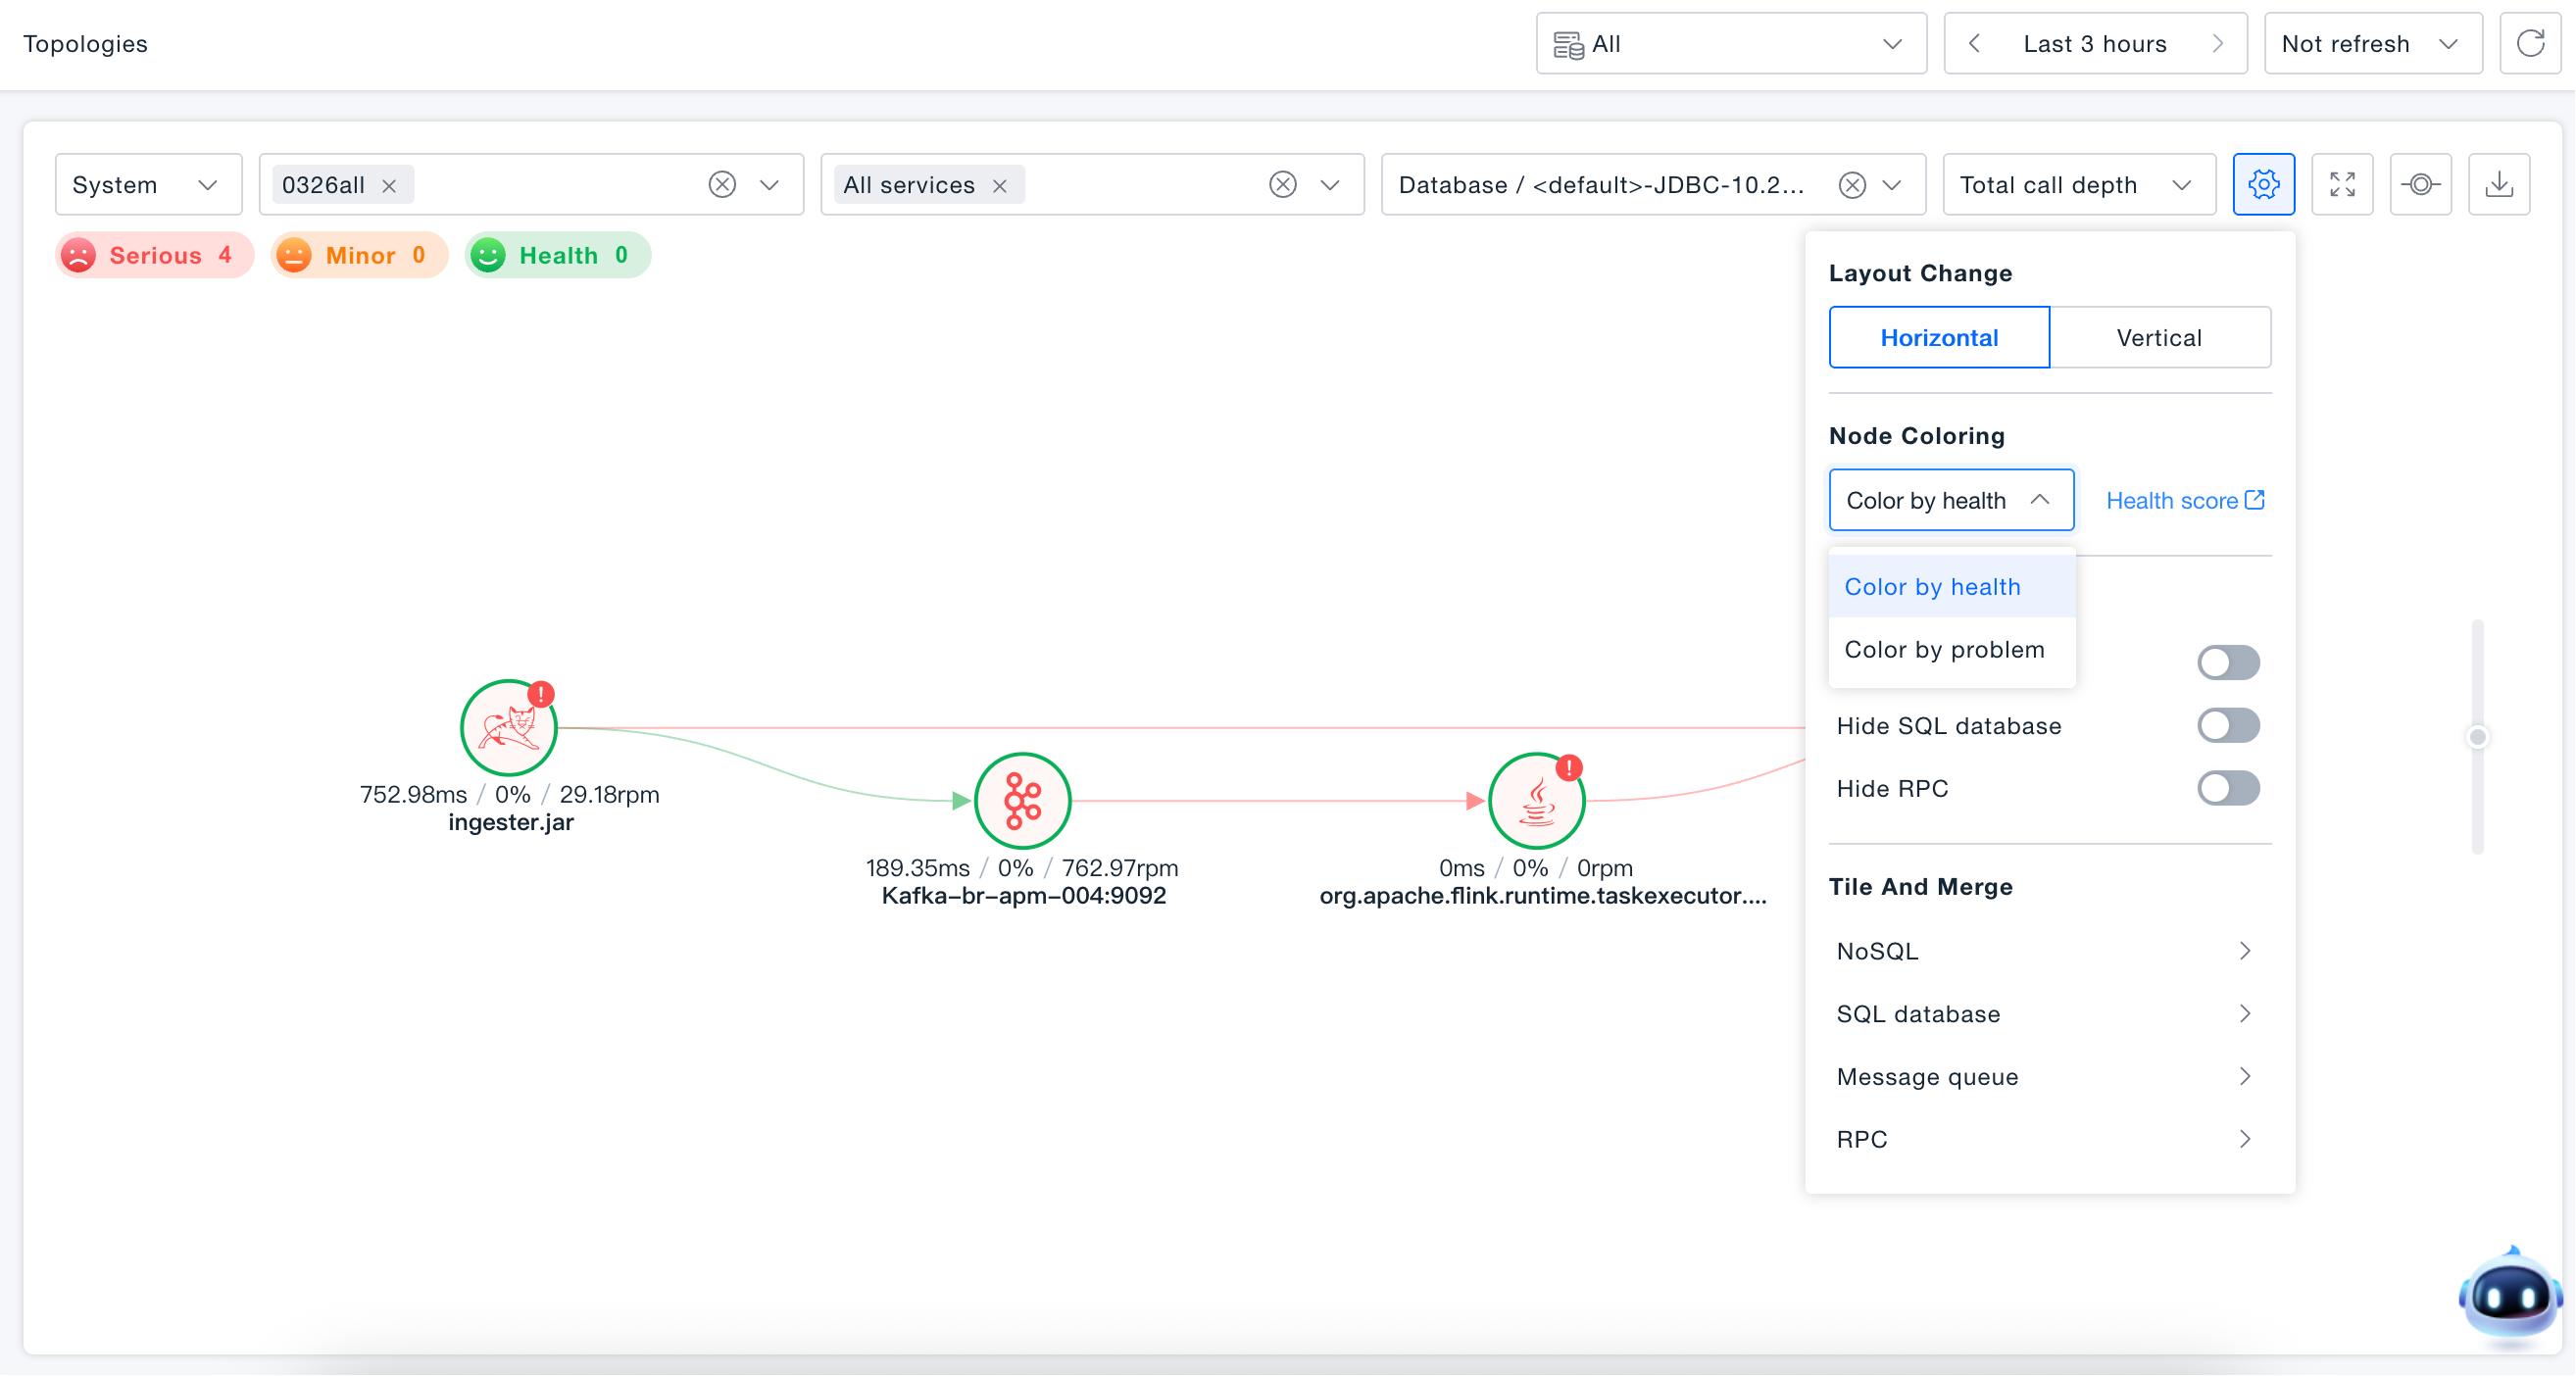
Health Score Coloring Legend:
- Green: Node with normal health.
- Orange: Node with minor health anomaly.
- Red: Node with critical health anomaly.
- Red Outer Ring: Outer ring displays the error rate proportion.
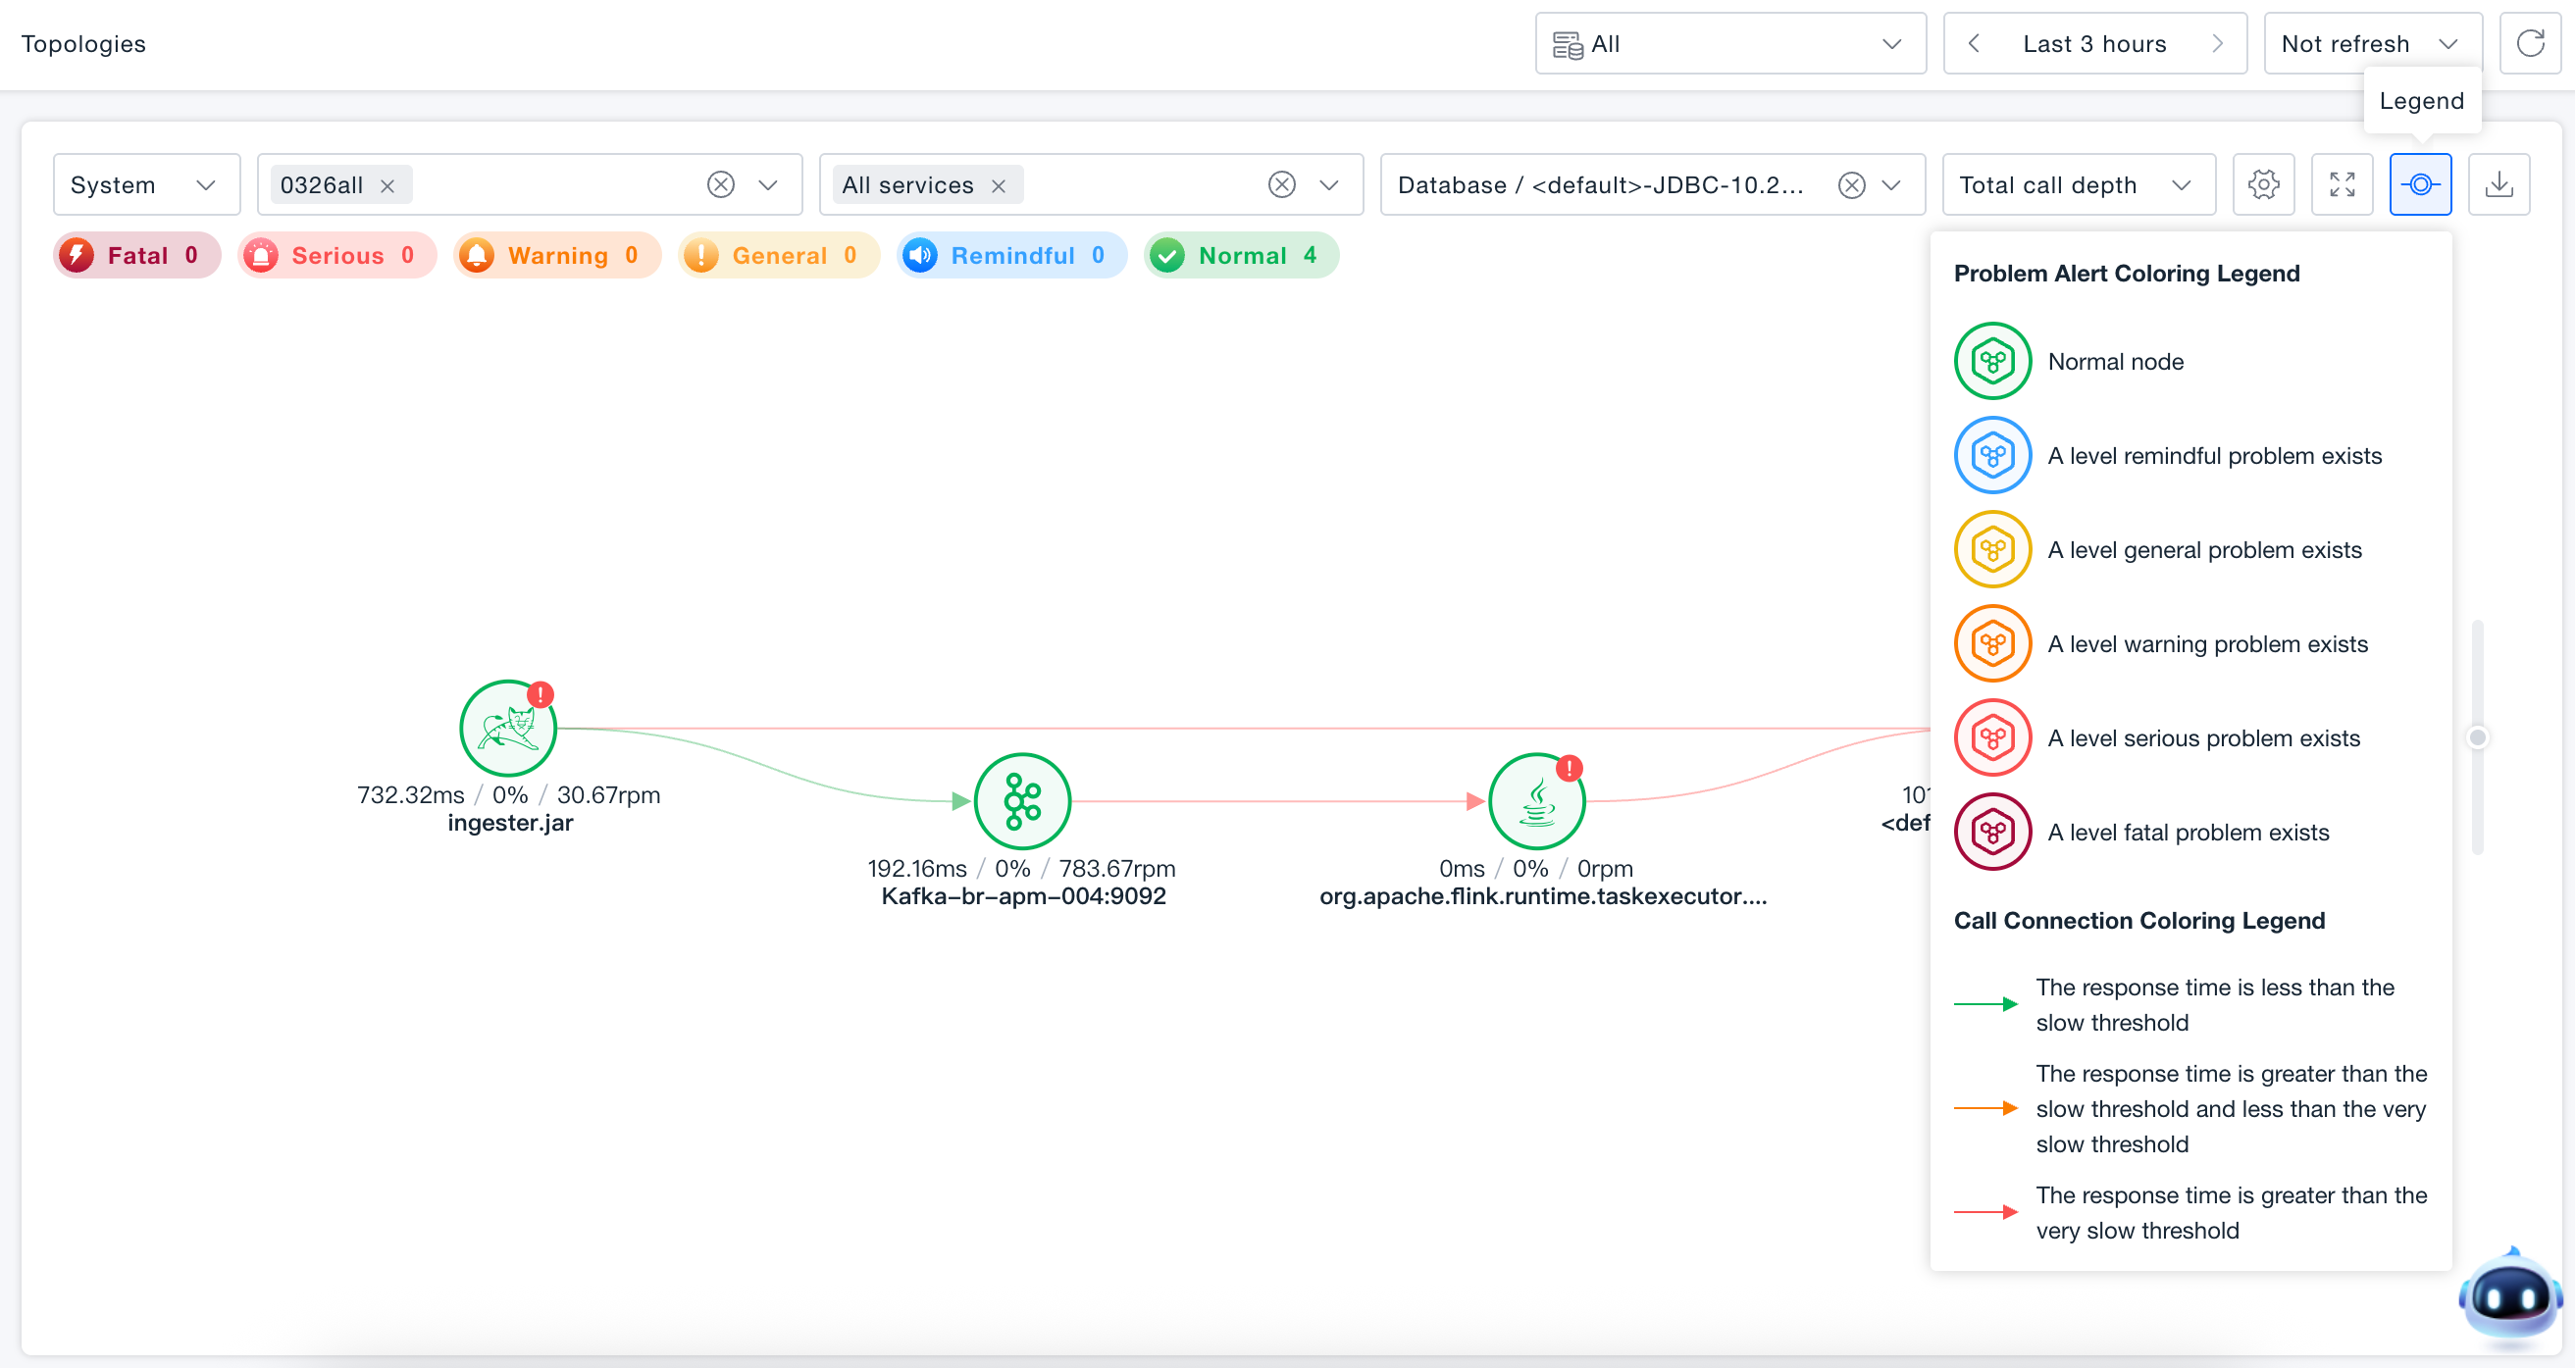
Problem Alert Coloring Legend:
- Green: Normal node
- Blue: Node with informational alerts
- Yellow: Node with minor issues
- Orange: Node with warning-level issues
- Red: Node with critical issues
- Purple: Node with fatal errors
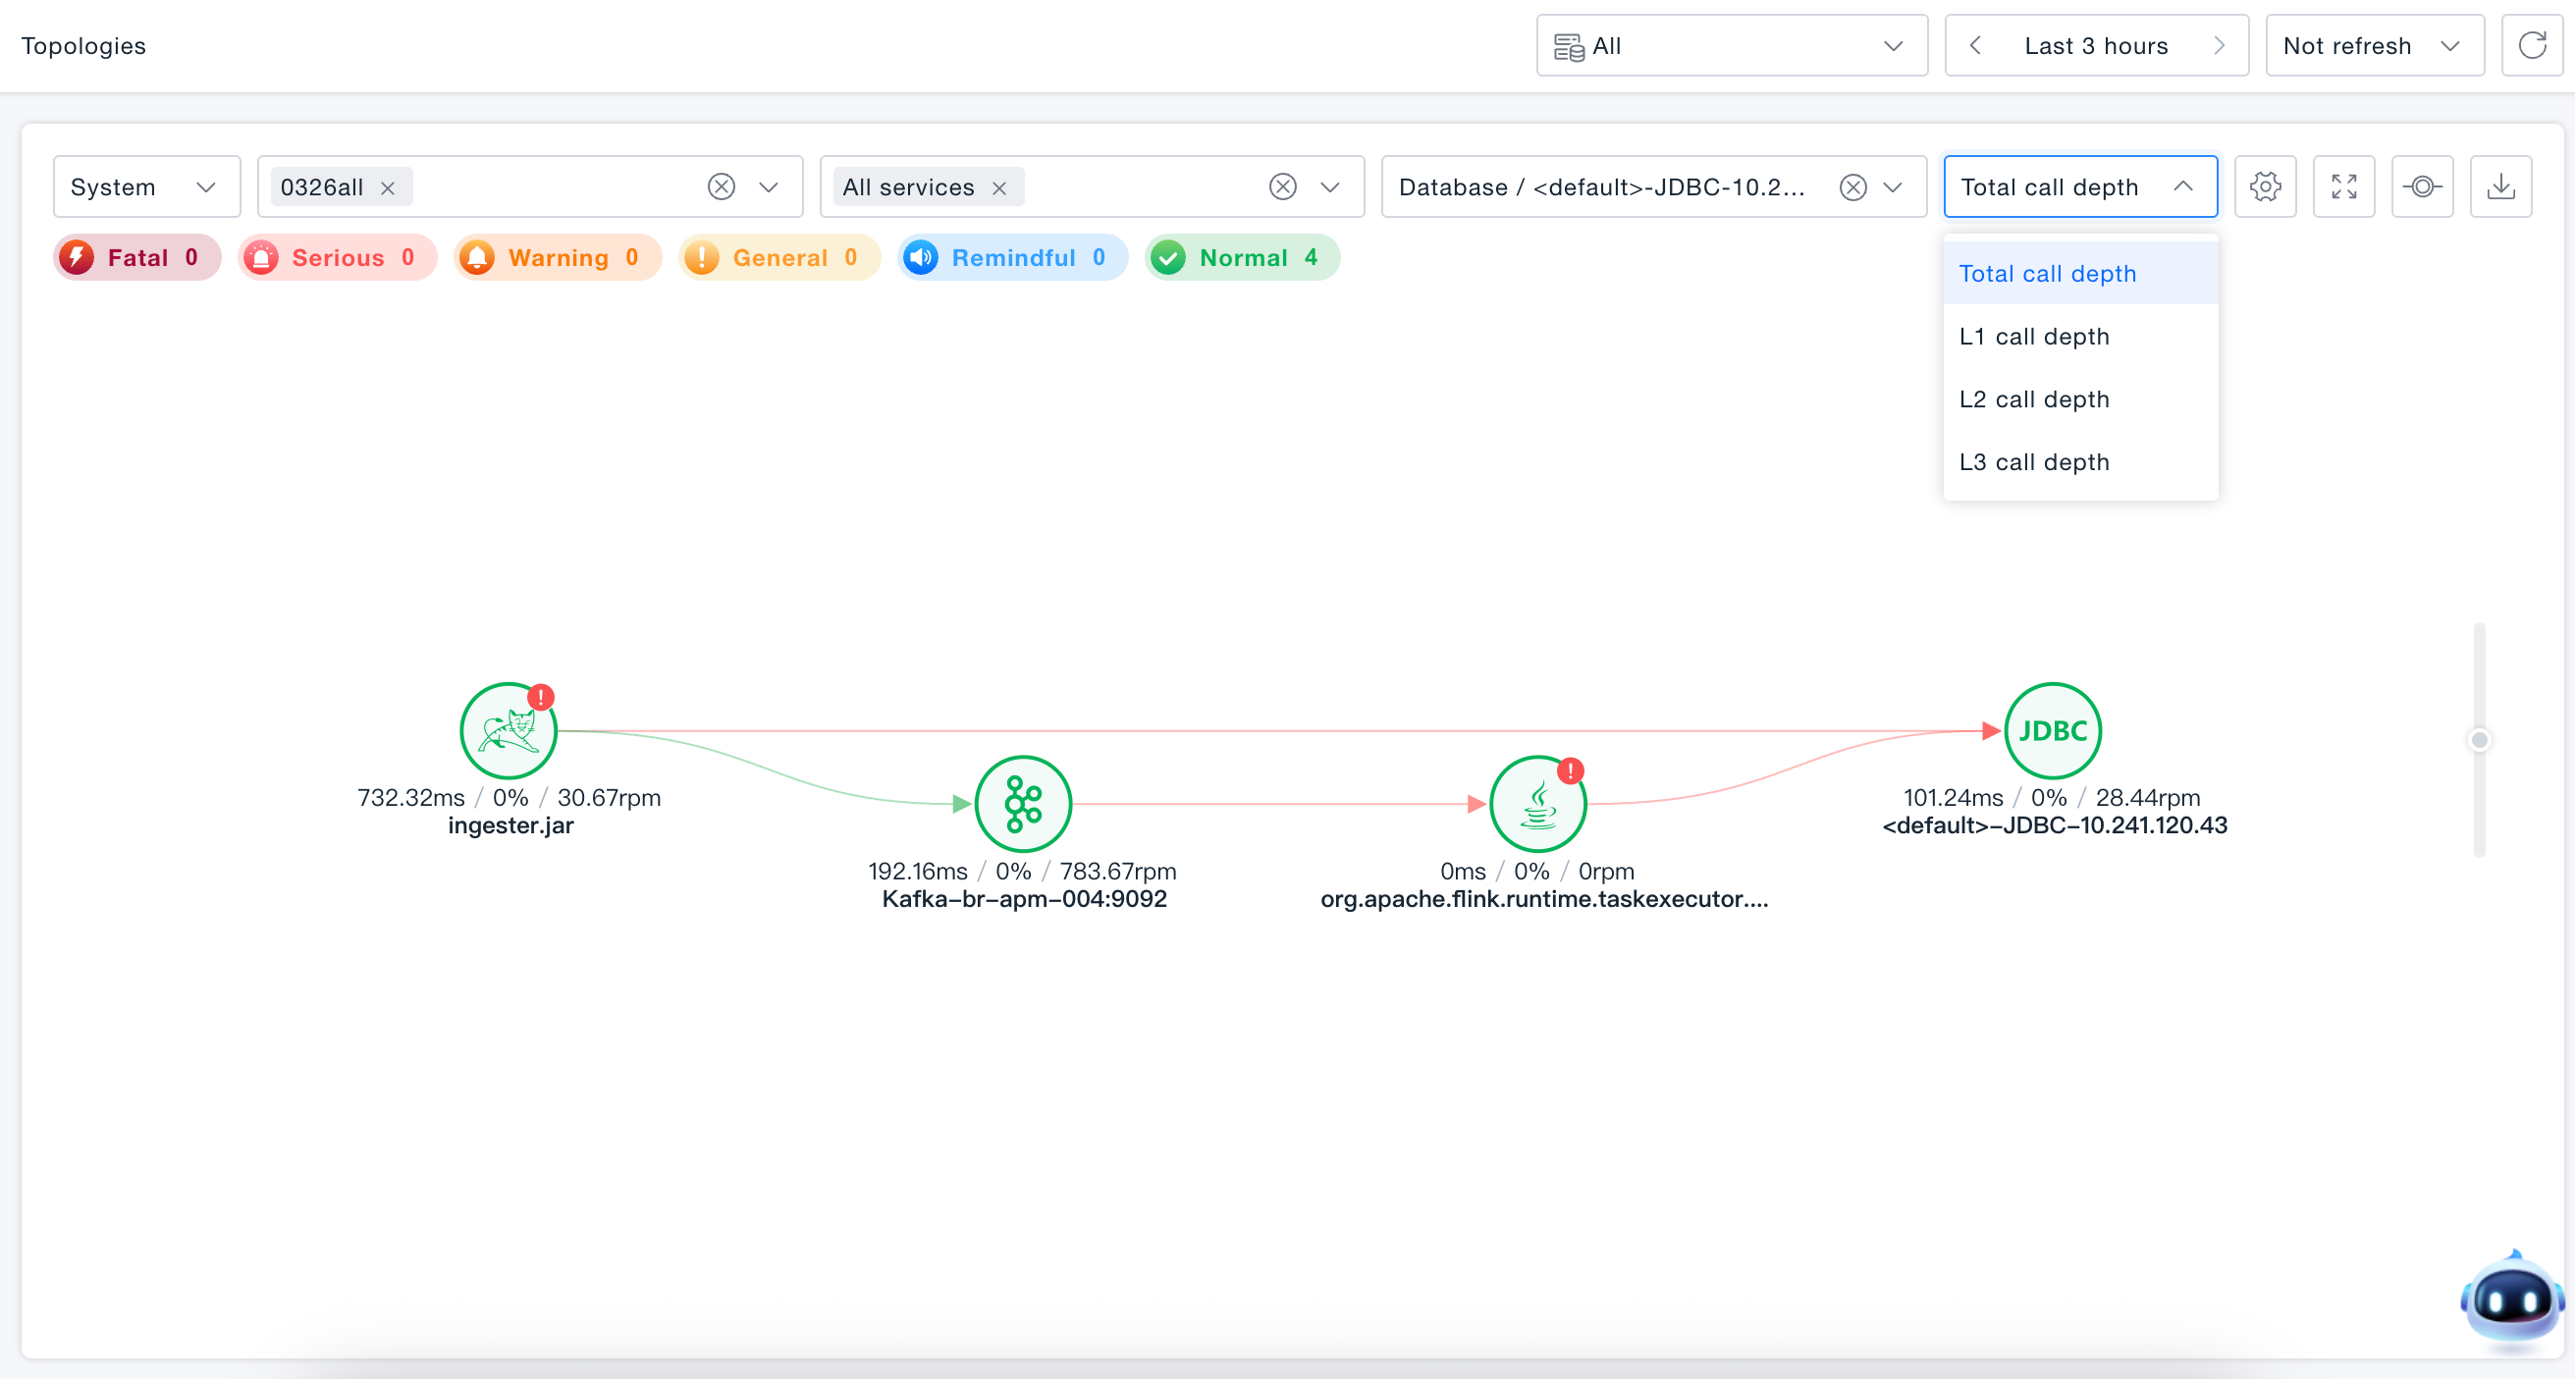
Invocation Depth
The invocation topology supports four levels of depth rendering (All levels, 1st level, 2nd level, 3rd level), simplifying topological relationships for a clearer view.