Create Business Trace
Creating and Naming a Core Business Flow
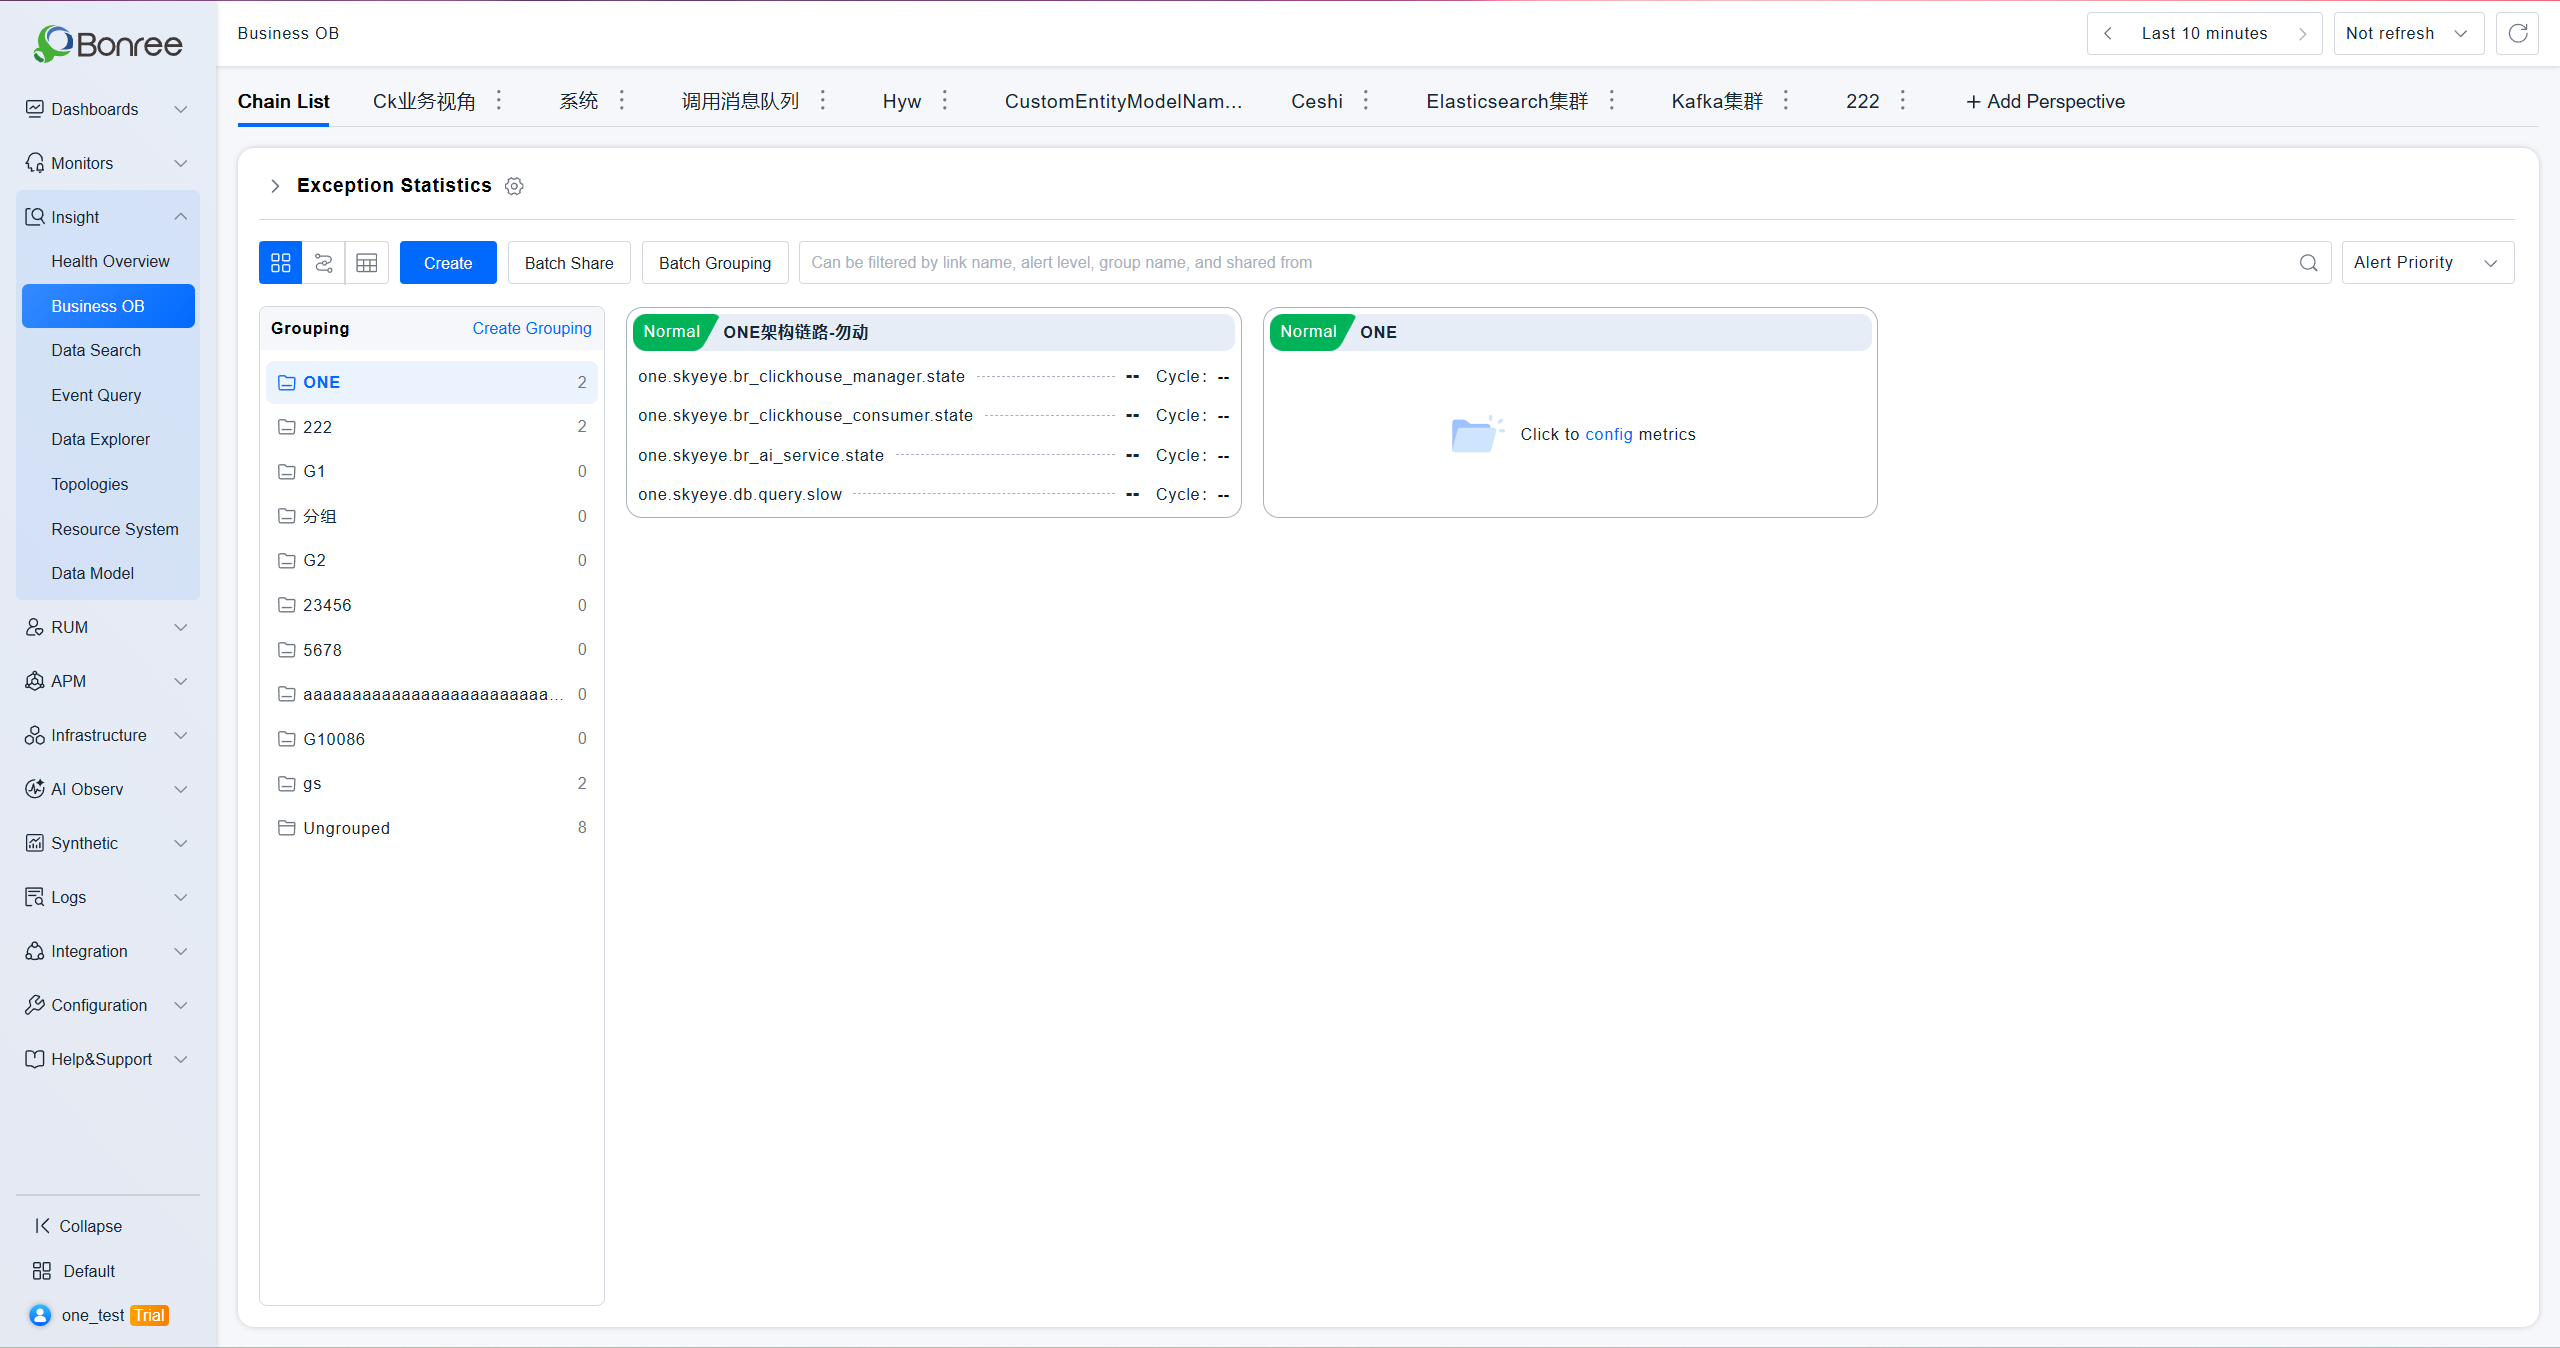
- Navigate to the Observability & Insights -> Business OB page and click the 「Create」 button.
- Input a name for the core business flow or use the default name. After saving, you will enter the core business flow orchestration page.
Orchestrating a Core Business Flow
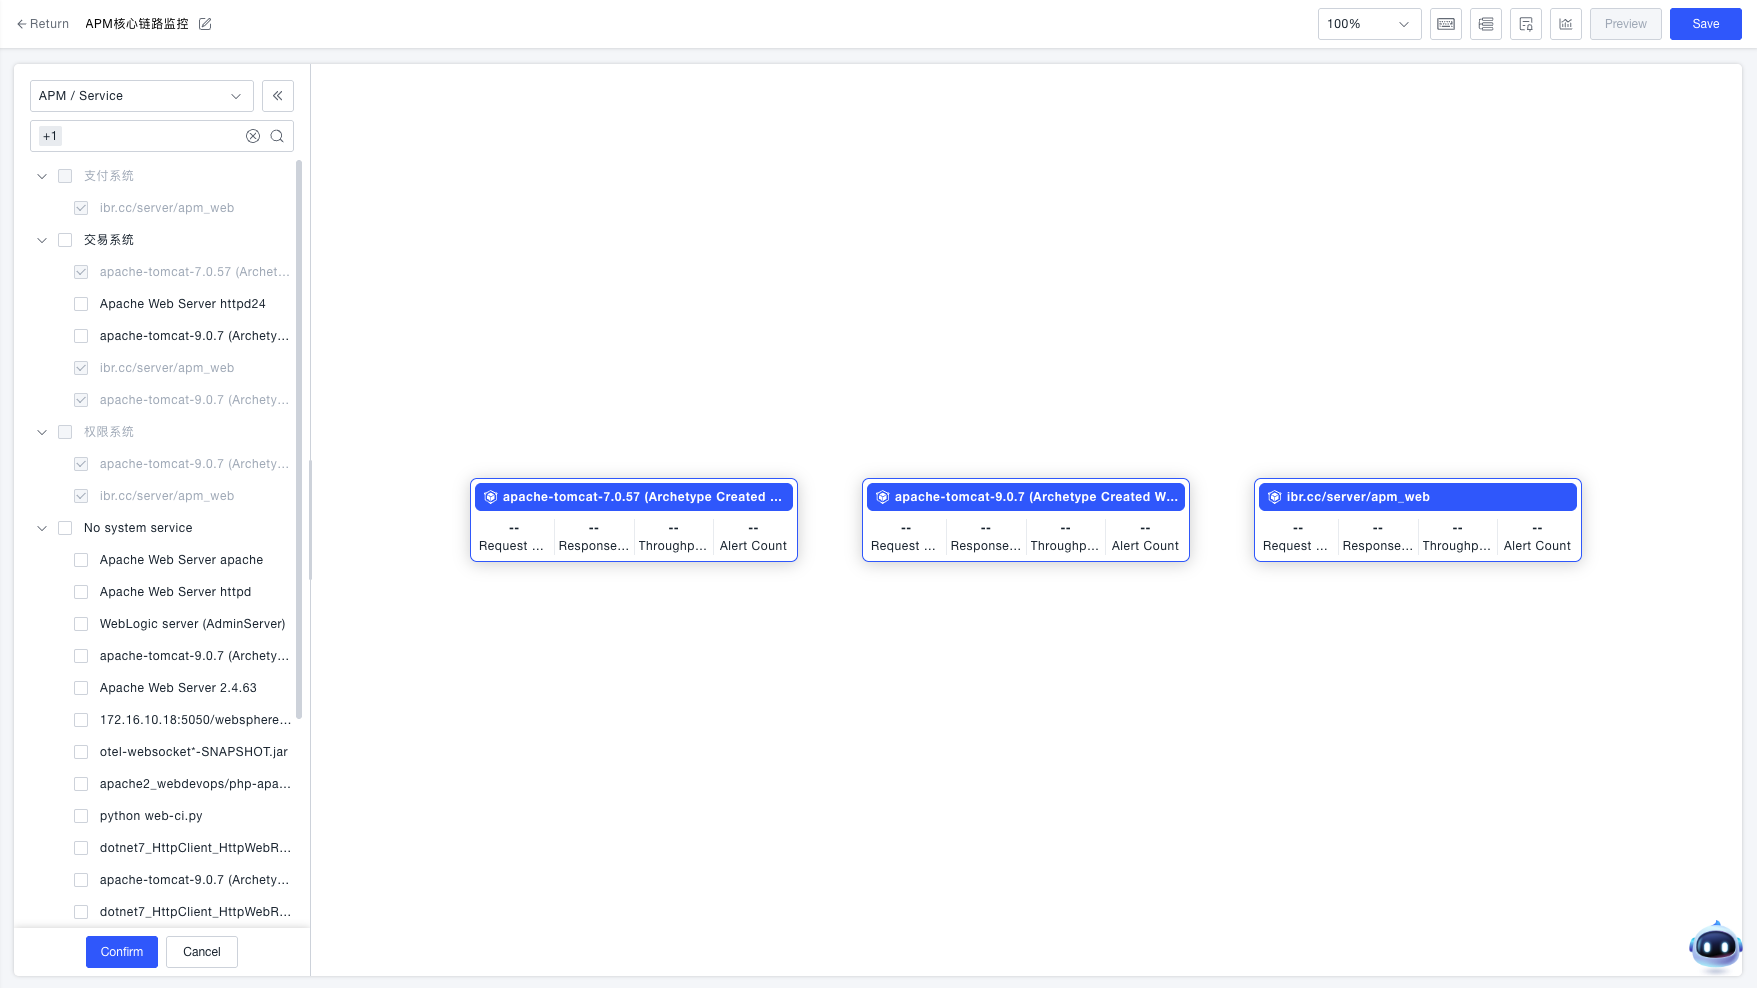
Adding Business Nodes
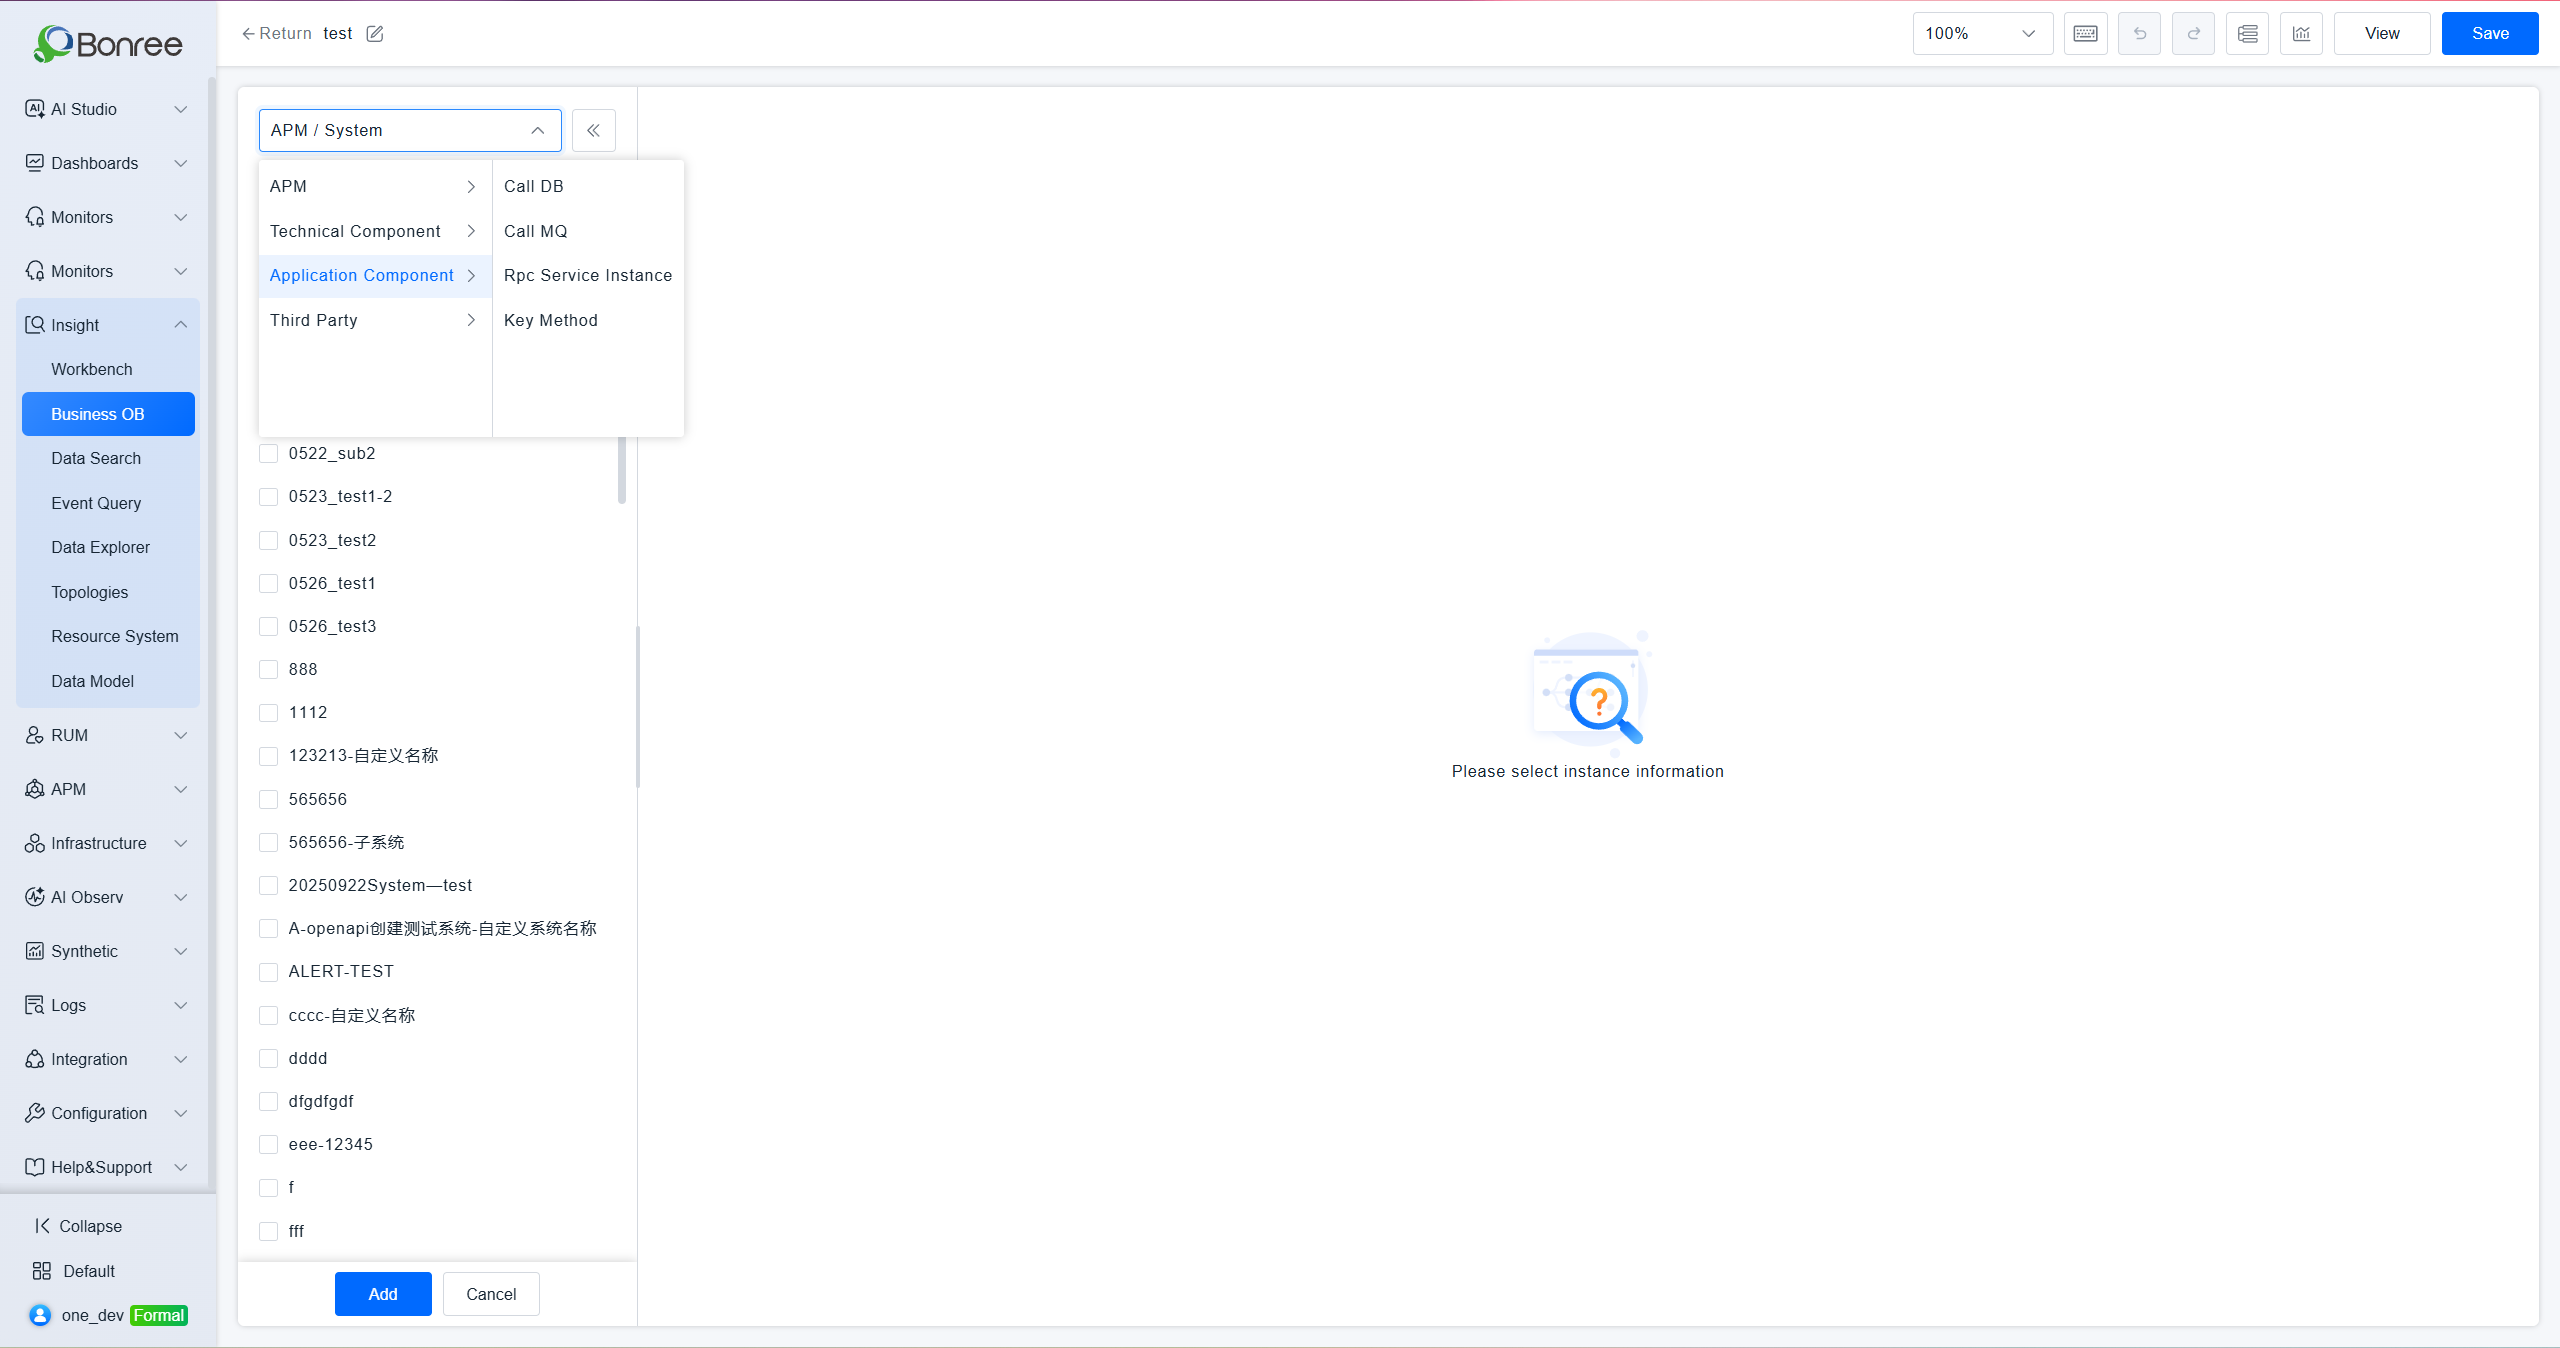
In the left selection area, choose the systems or services you want to monitor. Select them via checkbox and save to add the required business nodes to the canvas.
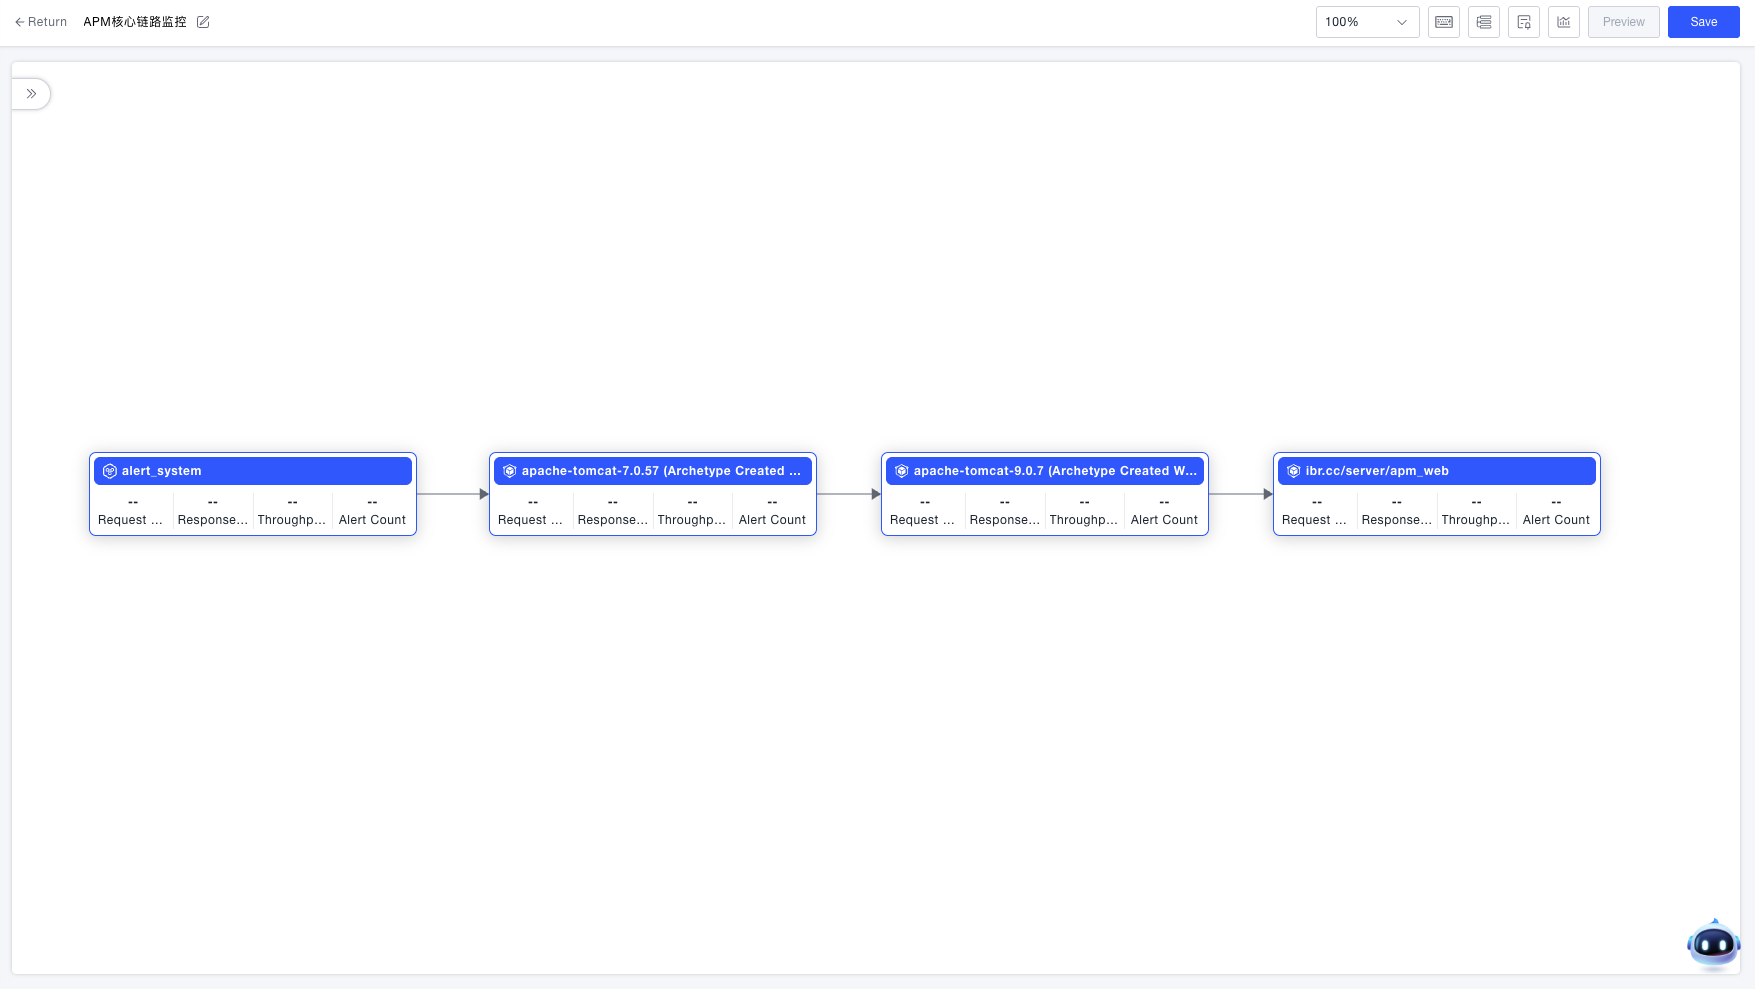
Establishing Connections
On the canvas, drag to draw connection lines between nodes according to the actual call relationships to map out the business topology.
Flow Configuration (Optional)
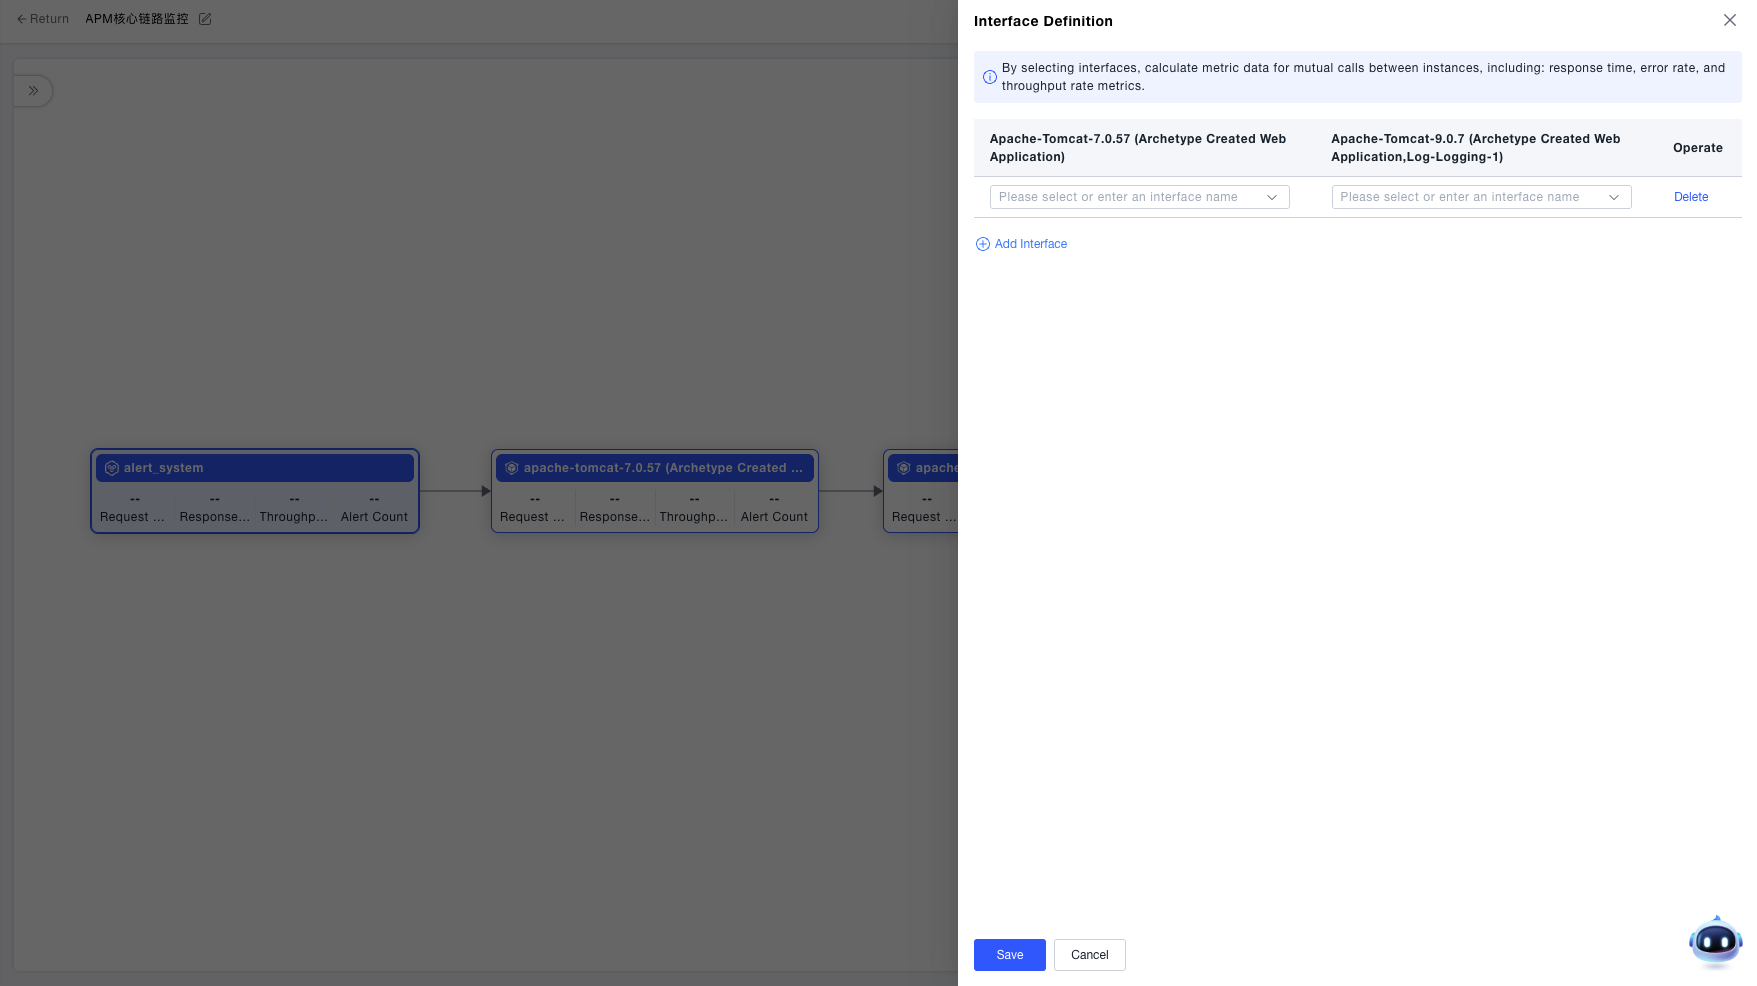
Interface Definition
Define interfaces to calculate metrics (like response time, error rate, and throughput) for calls between nodes. If no interfaces are defined, metrics will be aggregated based on all interface calls. Follow these steps:
- Hover over the connection line between nodes and click the 「Define Interface」 button.
- Click 「Add Interface」, select the calling interfaces between the two instances, and save.
After saving, hover over the connection line in view mode to see the metrics between the nodes.
Supported Entity Types
The following entity types are currently supported in Business Trace:
- System
- Service
- Technical Component
- Application Component
- Third-party Entity
Business Observability supports selecting and configuring application component entities: database calls / message queue calls / remote service instances / key methods.
Set Entry Node
Mark the system or service representing the business entry point (e.g., API Gateway or frontend application) as the entry node. Follow these steps:
- Click the edit icon on the node card.
- Select 「Set as Entry Node」 to designate the current node as the entry node.
Calculation Method: After setting the entry node, its core metrics are calculated based on the related first-degree downstream nodes. For example: If A is the entry node with calls to B and C, A's metrics are calculated from the metrics of the A-B and A-C edges. For non-entry nodes, metrics are calculated from the incoming edge metrics. For example: If A calls B and C calls B, then B's metrics are calculated from the A-B and C-B edge metrics.
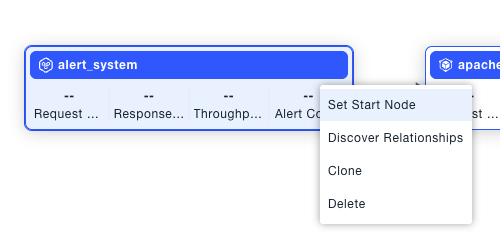
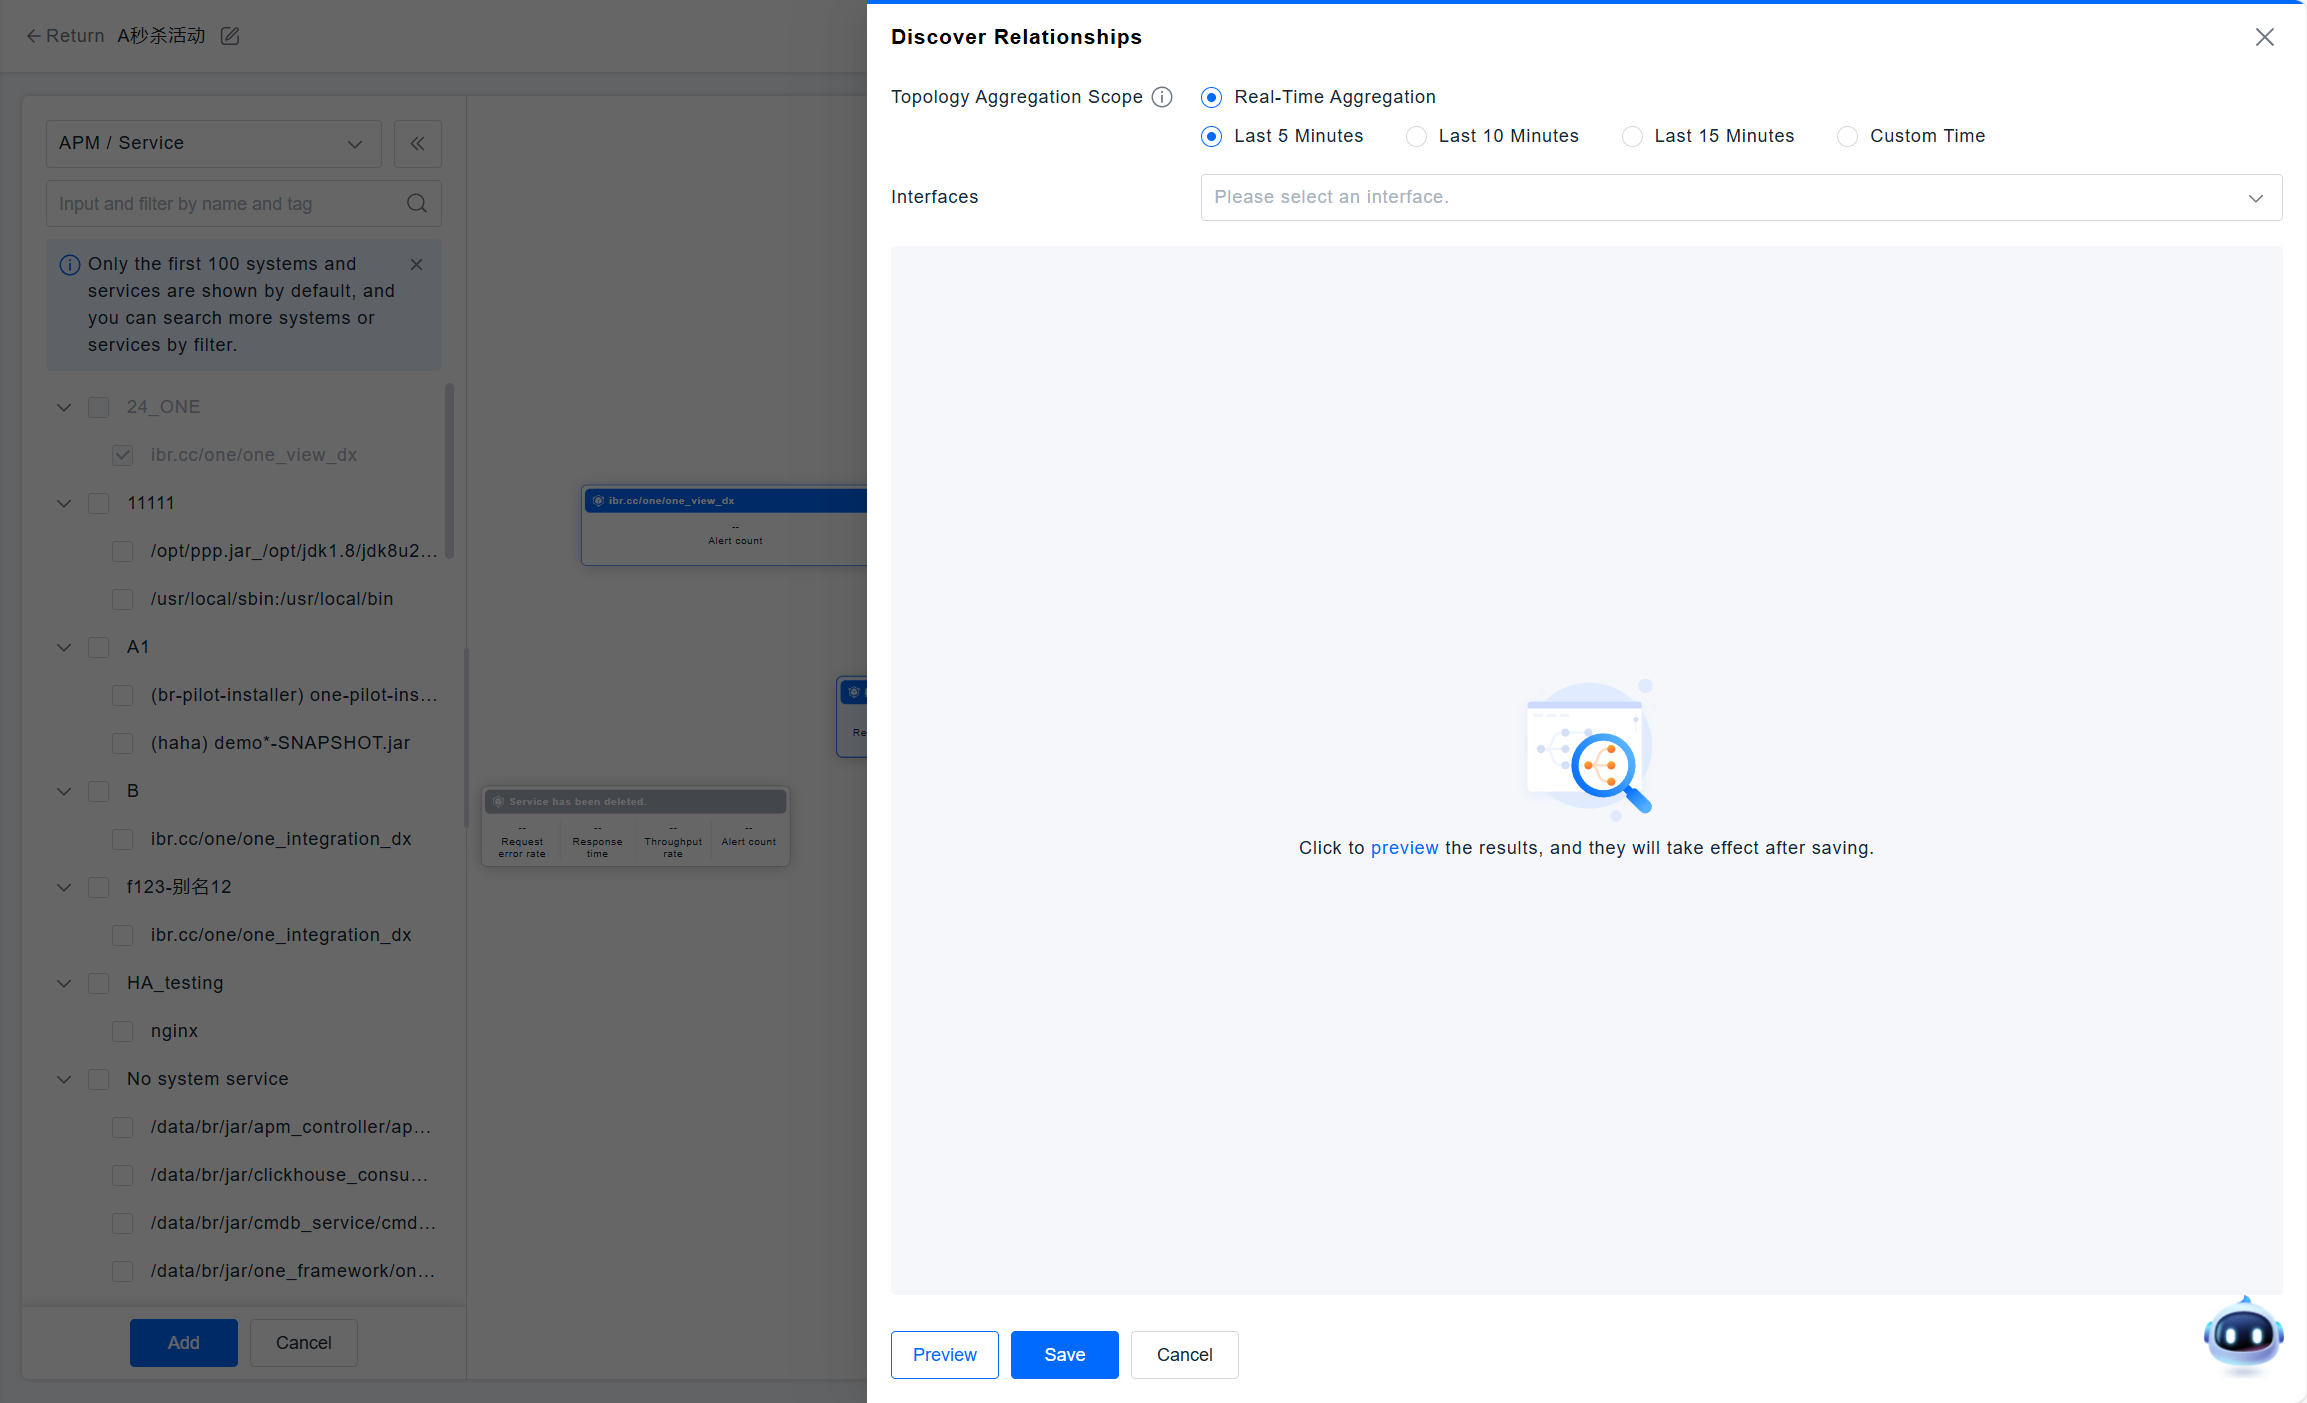
Discover Relationships
Based on the selected services and specified interfaces, the platform will map context-related information using call chains. After checking the corresponding services, these service nodes and connections will be automatically added to the canvas, helping you quickly discover and complete dependency relationships. The specific steps are as follows: Click the edit icon on the node card.
- Select "Discover Relationships" to view the related services of this node.
- Select the time range for aggregating call chains.
- Select interface information (optional, multiple selections allowed).
- After saving, the canvas will automatically add the corresponding service nodes and connections.
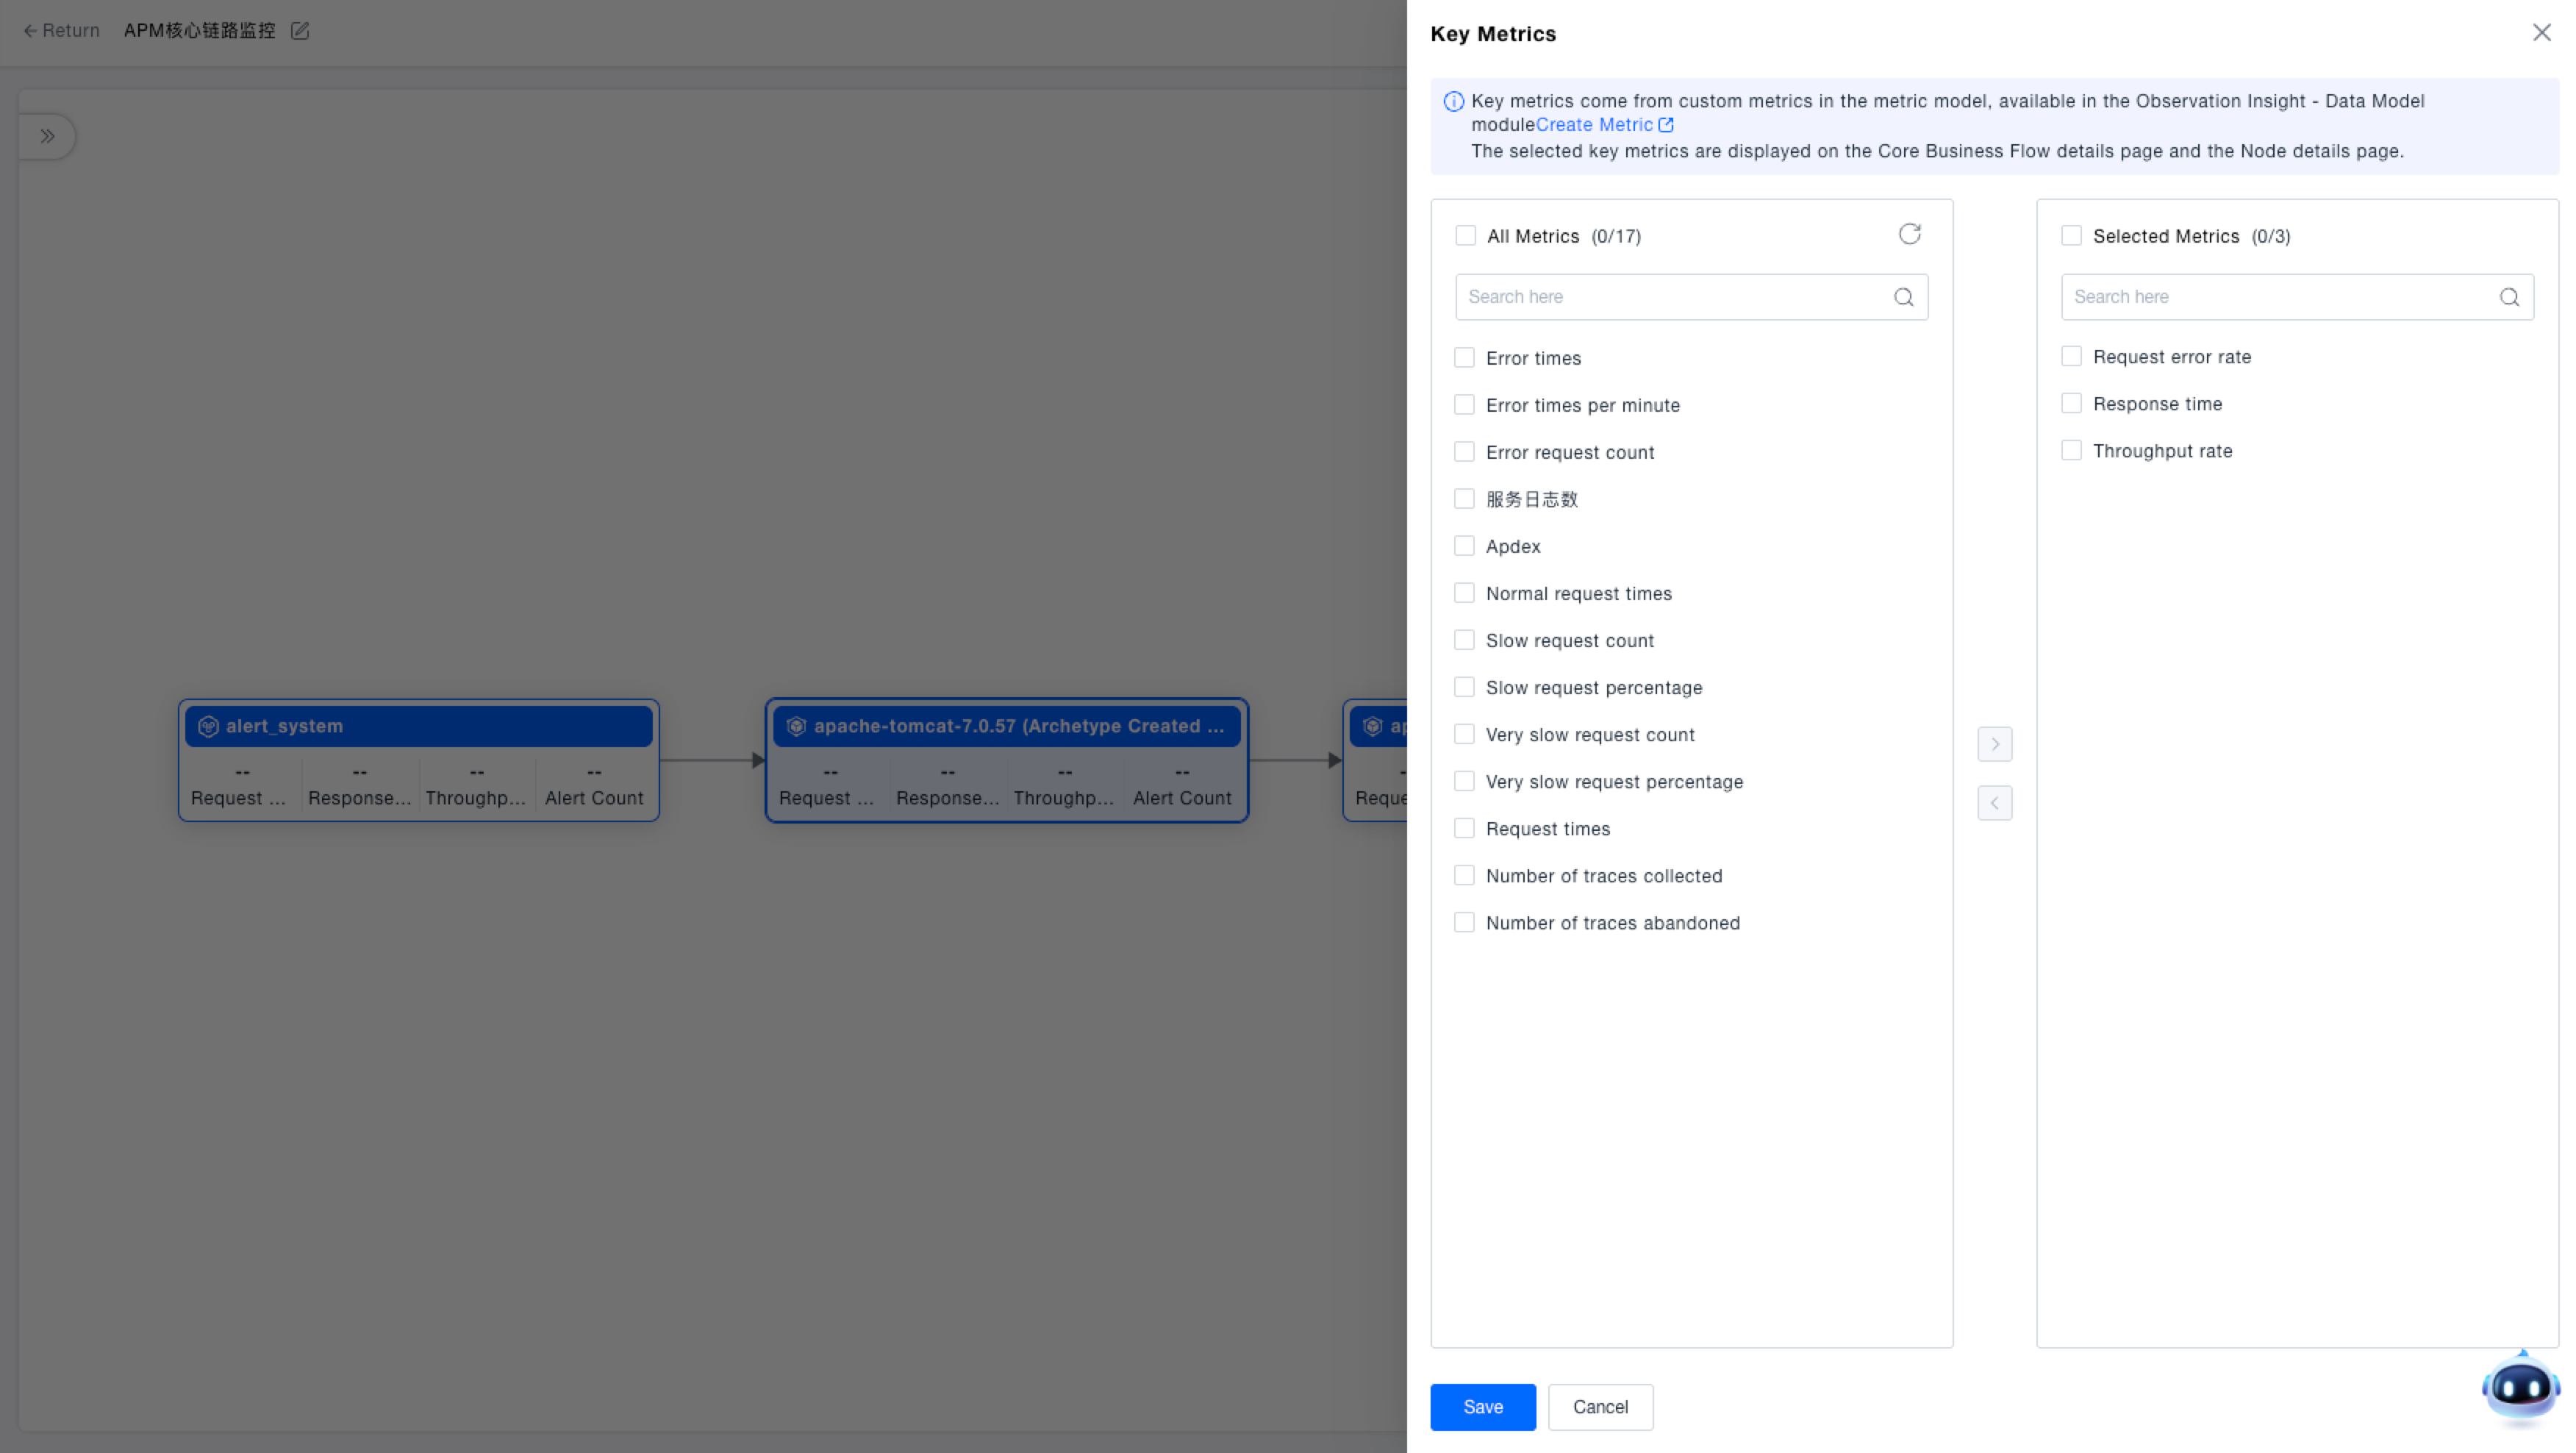
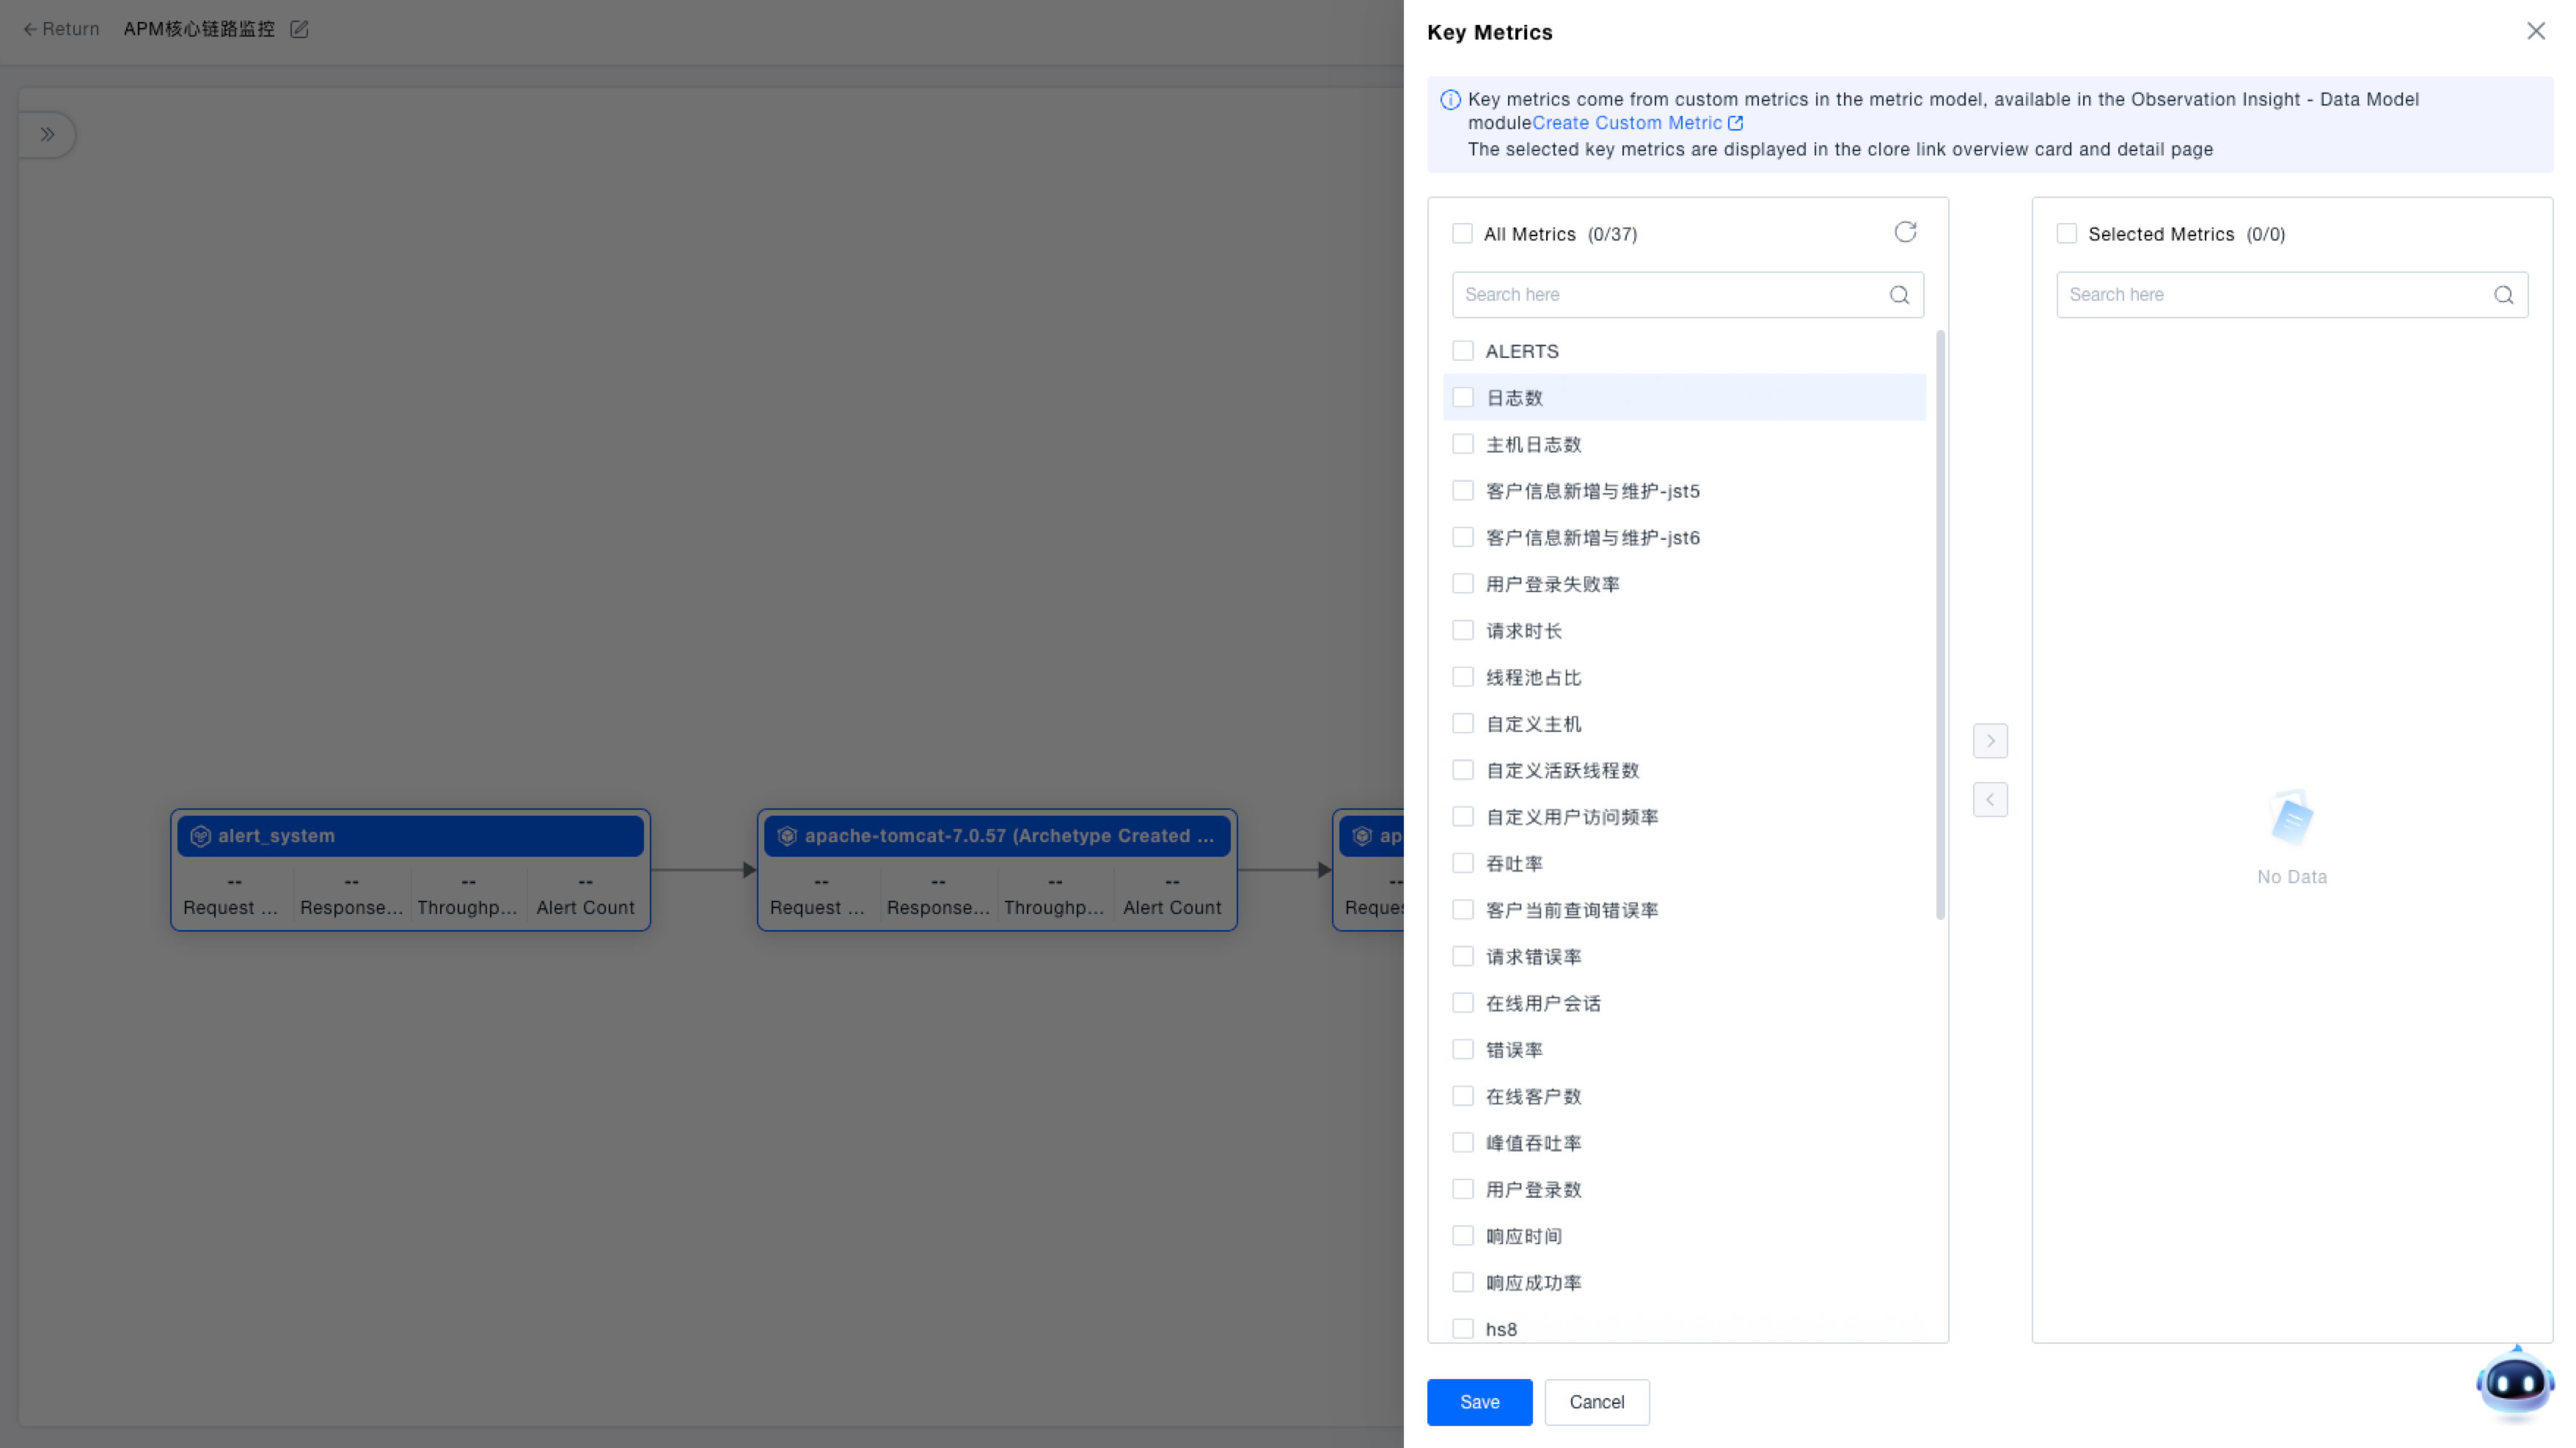
Configure Key Metrics
Configuring key metrics for service nodes. Follow these steps:
- Click the edit icon on the node card.
- Select 「Key Metrics」.
- Select the service-related metrics to add and save.
After saving, the service node card displays the added metric information.
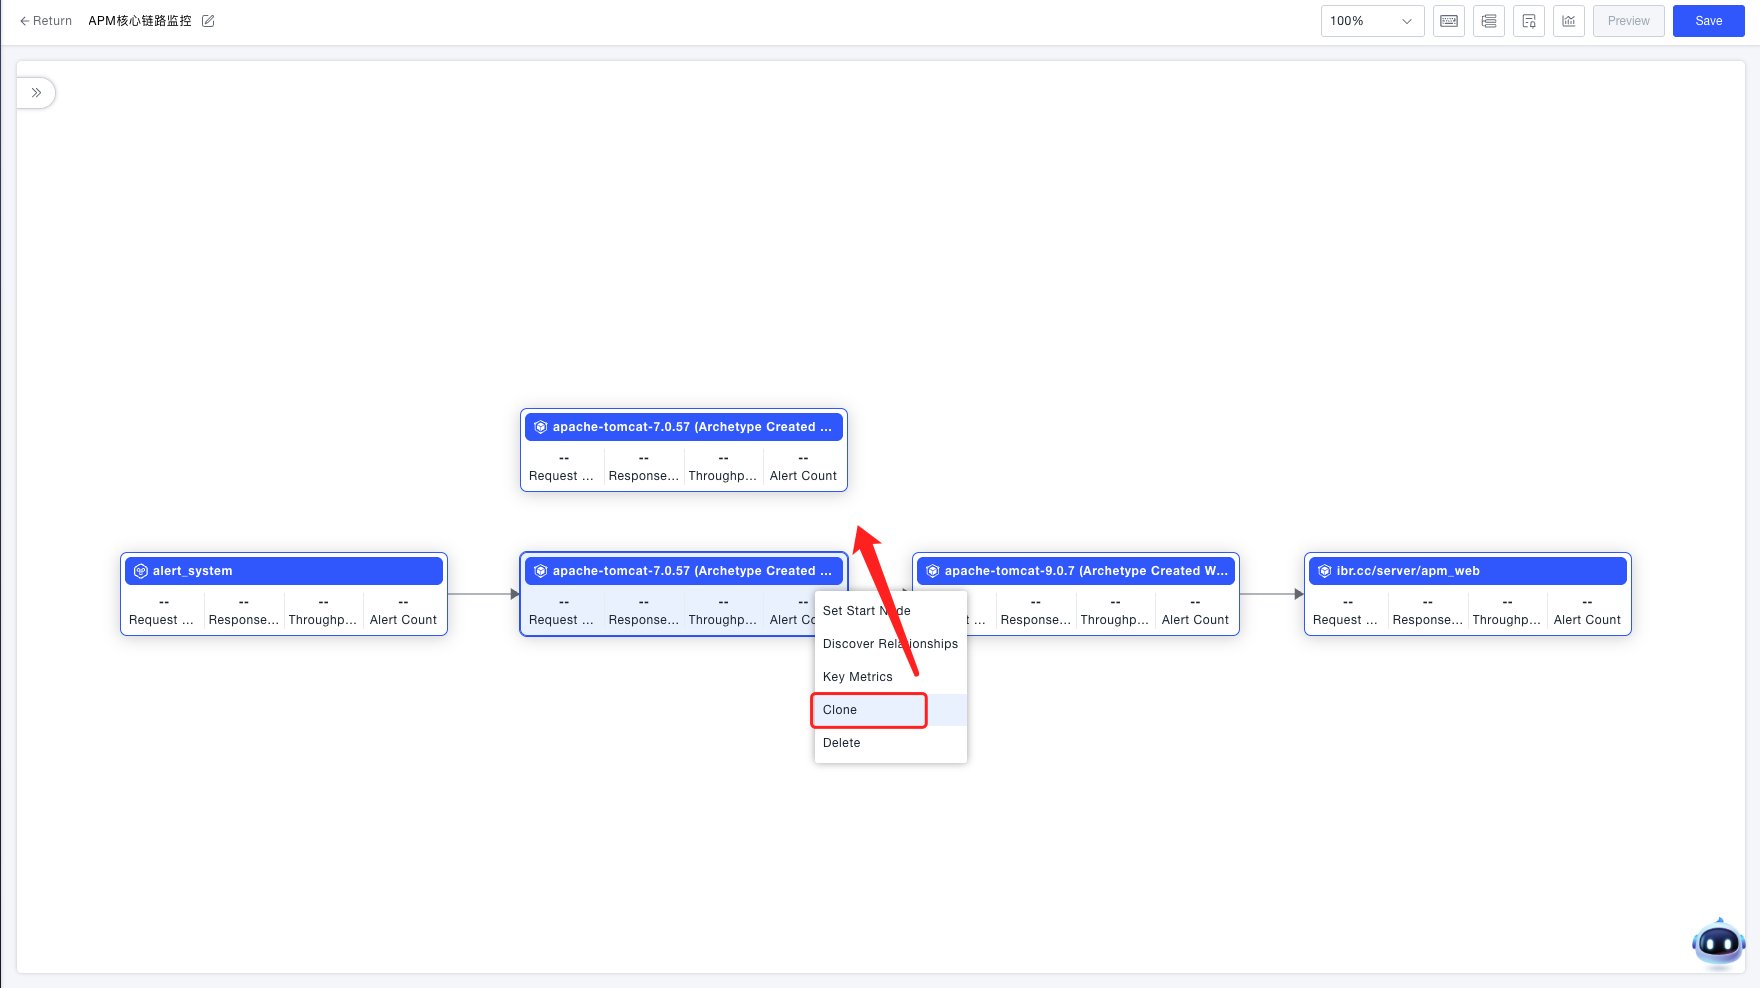
Clone Node
Cloning a node identical to the current node. Follow these steps:
- Click the edit icon on the node card.
- Select 「Clone」.
After successful cloning, an independent node identical to the cloned node is generated on the canvas and must be manually connected.
Monitoring Rule Configuration
Configure Key Metrics
The Key Metrics here refer to the critical business indicators for this core business flow. They can be added according to business needs and are used to monitor the status of the flow. Configuring these metrics is optional and does not affect the normal monitoring of the flow. Follow these steps:
- Click the "Configure Key Metrics" icon in the upper right corner.
- Select the metrics to add (you can click "Create custom metric" to create one) and save.
After saving, the configured metrics can be viewed both on the core business flow's health dashboard and its details page. For details, please refer to Analyze Core Business Flow.

Associate Alert Rules
Associate alert rules with the current core business flow. You can monitor the flow's operational status based on the count and severity of alerts triggered by the associated rules. Configuring these alert rules is optional and does not affect the normal monitoring of the flow. Follow these steps:
- Click the "Associate Alert Rules" icon in the upper right corner.
- Select the alert rules to associate and save.
After saving, the associated alert rules can be viewed on the core business flow health dashboard, where you can also see the count of triggered alerts and the alert list. For details, please refer to Analyze Core Business Flow.
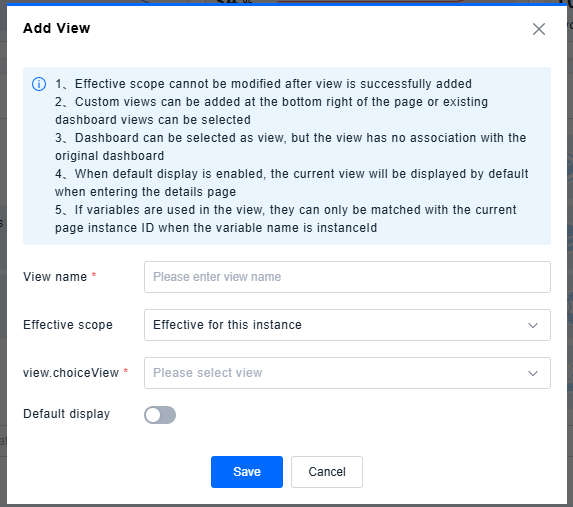
Custom Views
-
Click Add View to select an existing dashboard view or create a custom view.
Set the effective scope for the view. This cannot be modified after the view is successfully added.
- Effective for this instance: Applies only to the current service node detail page.
- Effective for partial instances: Apply filters to target specific instances.
- All valid: Applies to all service node detail pages across the core trace (restricted by technology type).
Configure whether the view is shown by default when entering the current node detail page. If multiple views are set to display by default simultaneously, they are shown in the following priority order: Effective for this instance > Effective for partial instances > All valid. For views at the same priority level, the most recently configured view takes precedence.
Card Groups
Added [Card Group] feature. All cards are placed in [Ungrouped] by default.
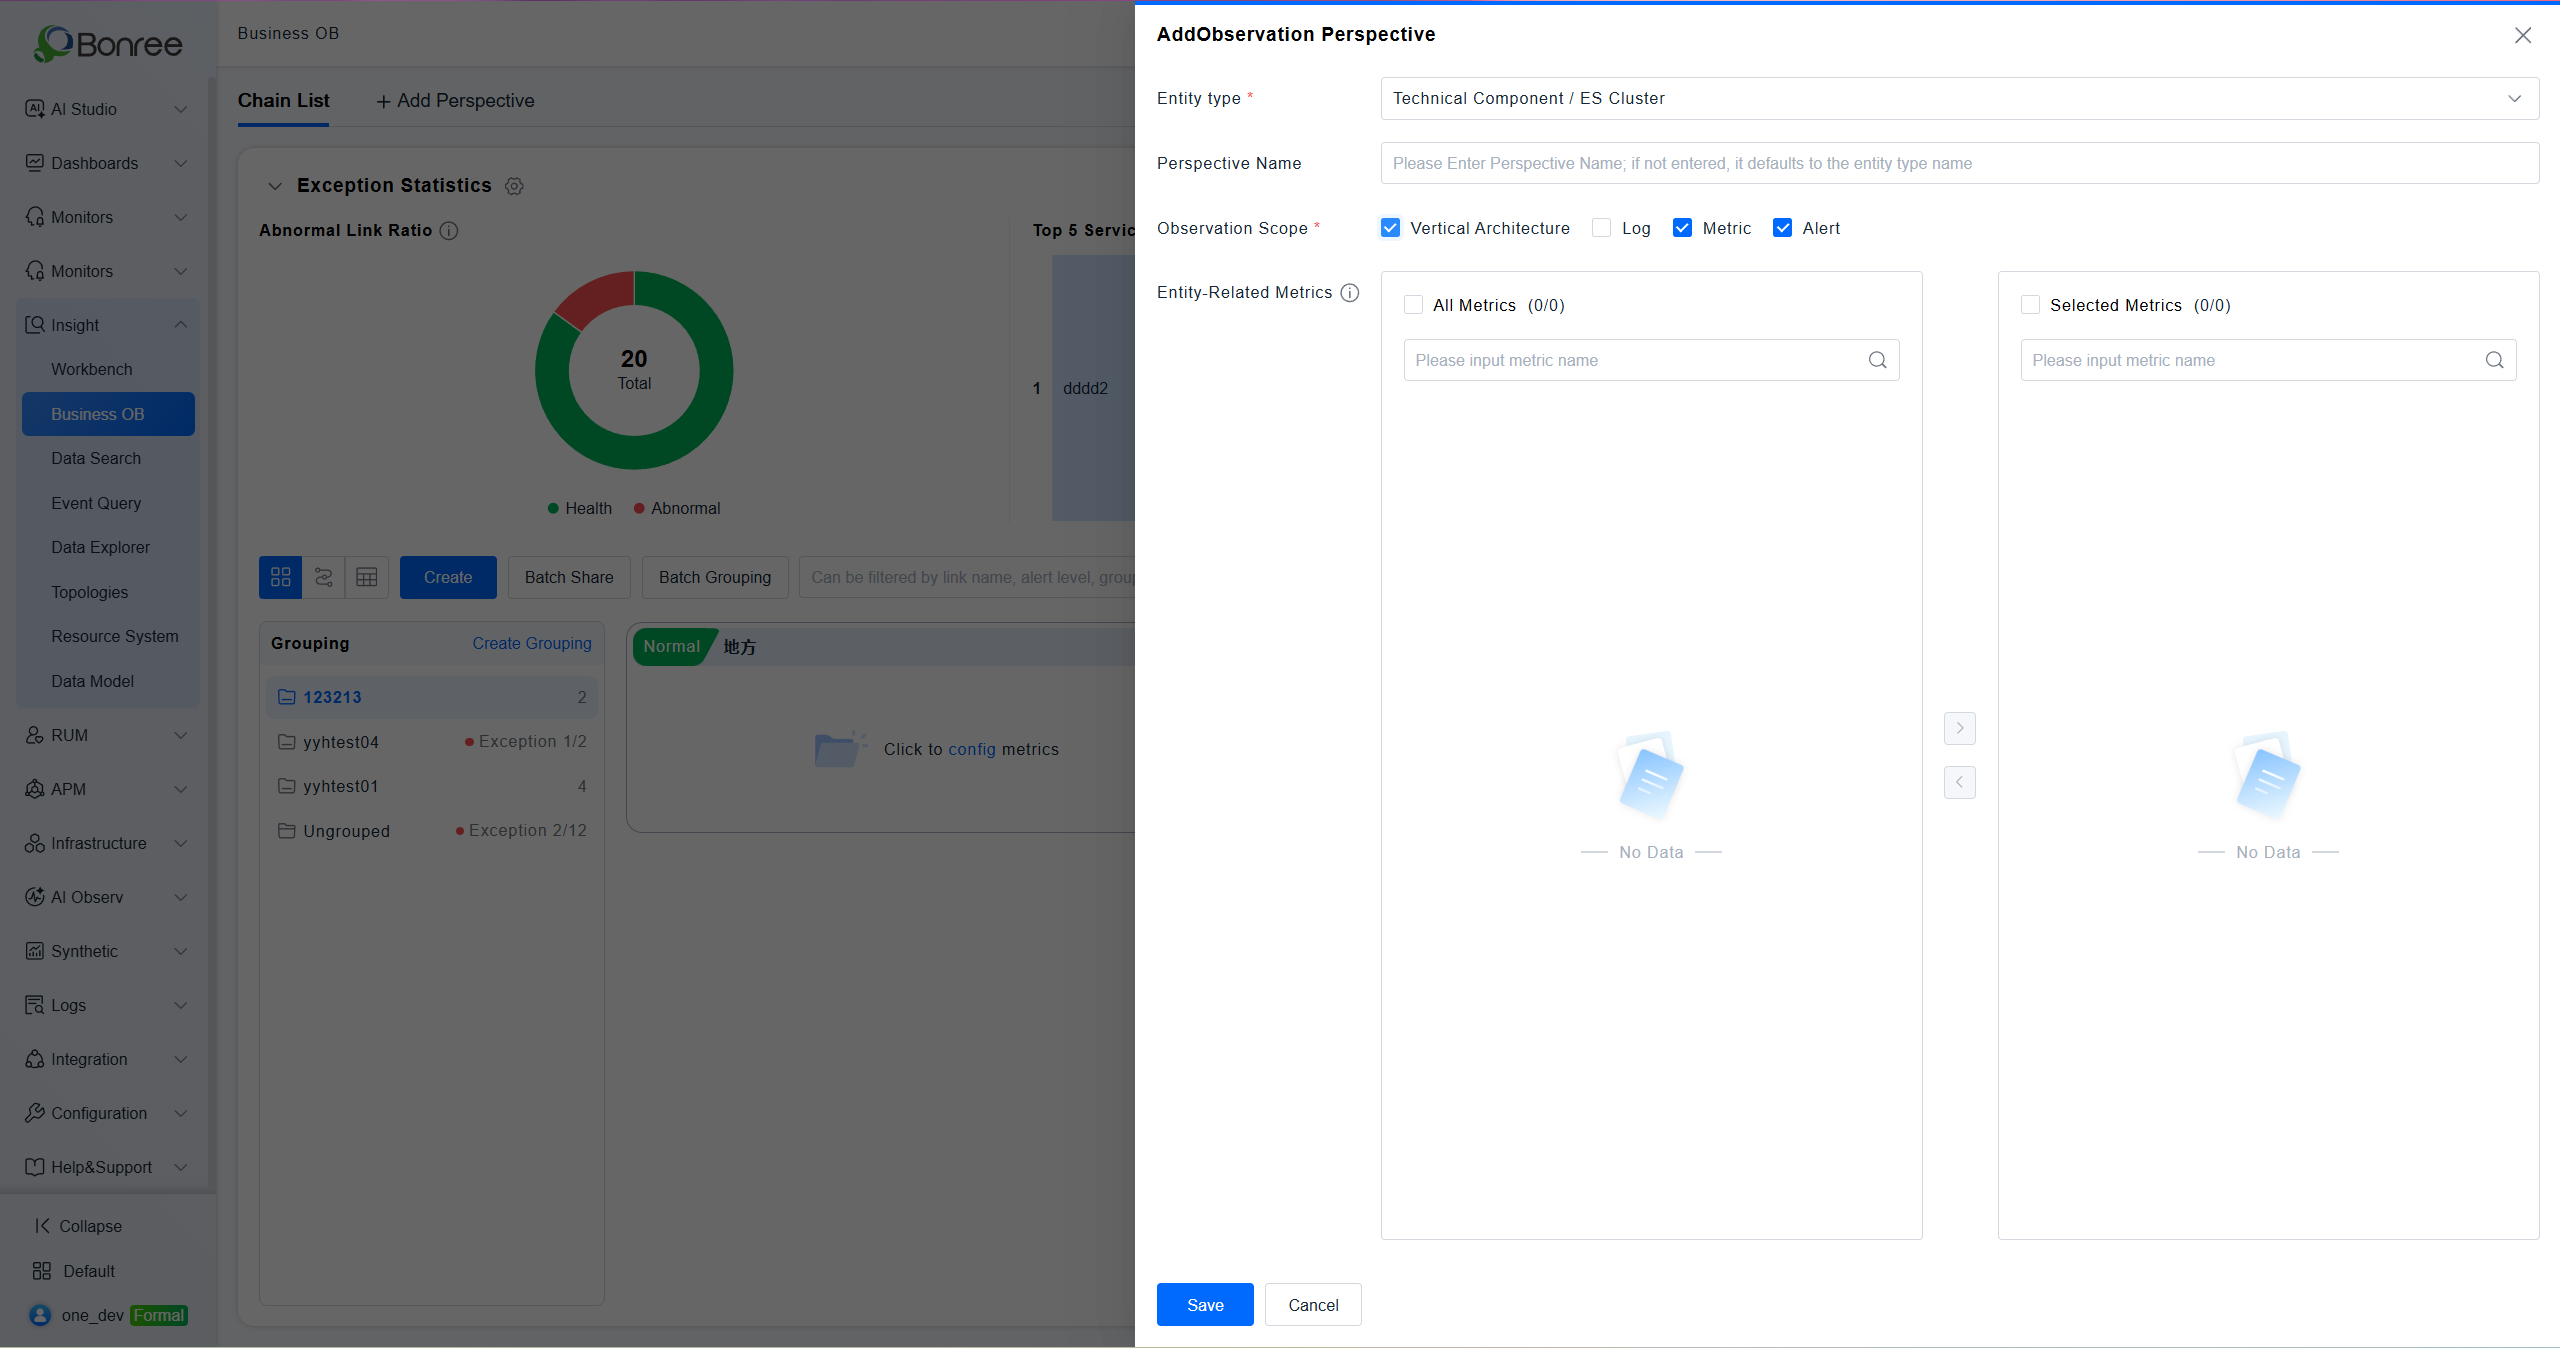
Custom Vertical Architecture Observability
Business Observability supports adding an [Observation Perspective] module, allowing users to customize entity observation angles. Supported entity types include:
-
Technical Component
-
Third-party Entity