host
The ONE platform collects infrastructure data (including hosts, containers, process groups, and technical components) through SmartAgent and SmartGate. This helps you quickly understand the resource consumption of infrastructure, identify performance bottlenecks of basic components, and proactively evaluate and plan the quantity and configuration of basic components.
Preconditions
To use the platform’s host monitoring capabilities, you first need to install the platform probes: SmartAgent and SmartGate. For specific installation methods, please refer to Probe Installation.
Usage Scenarios
- Server Cluster Management: In enterprise data centers or large-scale server cluster environments, numerous hosts undertake different business tasks (such as Web services, database services, and computing tasks). Host monitoring allows you to grasp the real-time running status of each host.
- Business System Stability Assurance: Continuously monitor the running status of critical services (e.g., database services, middleware services) on the host to ensure the services are always available. If a service process stops unexpectedly, the monitoring system can automatically trigger an alert and attempt to restart the service.
Get Started
-
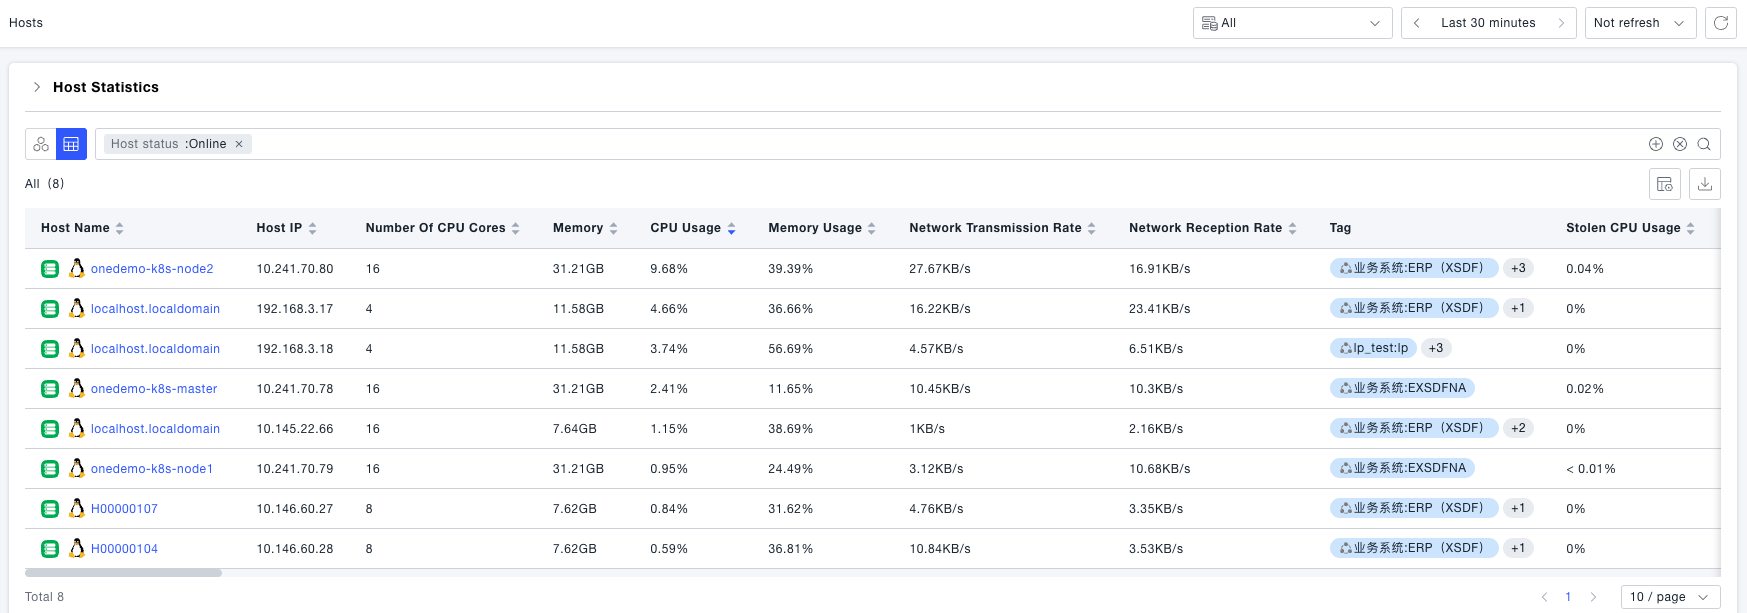
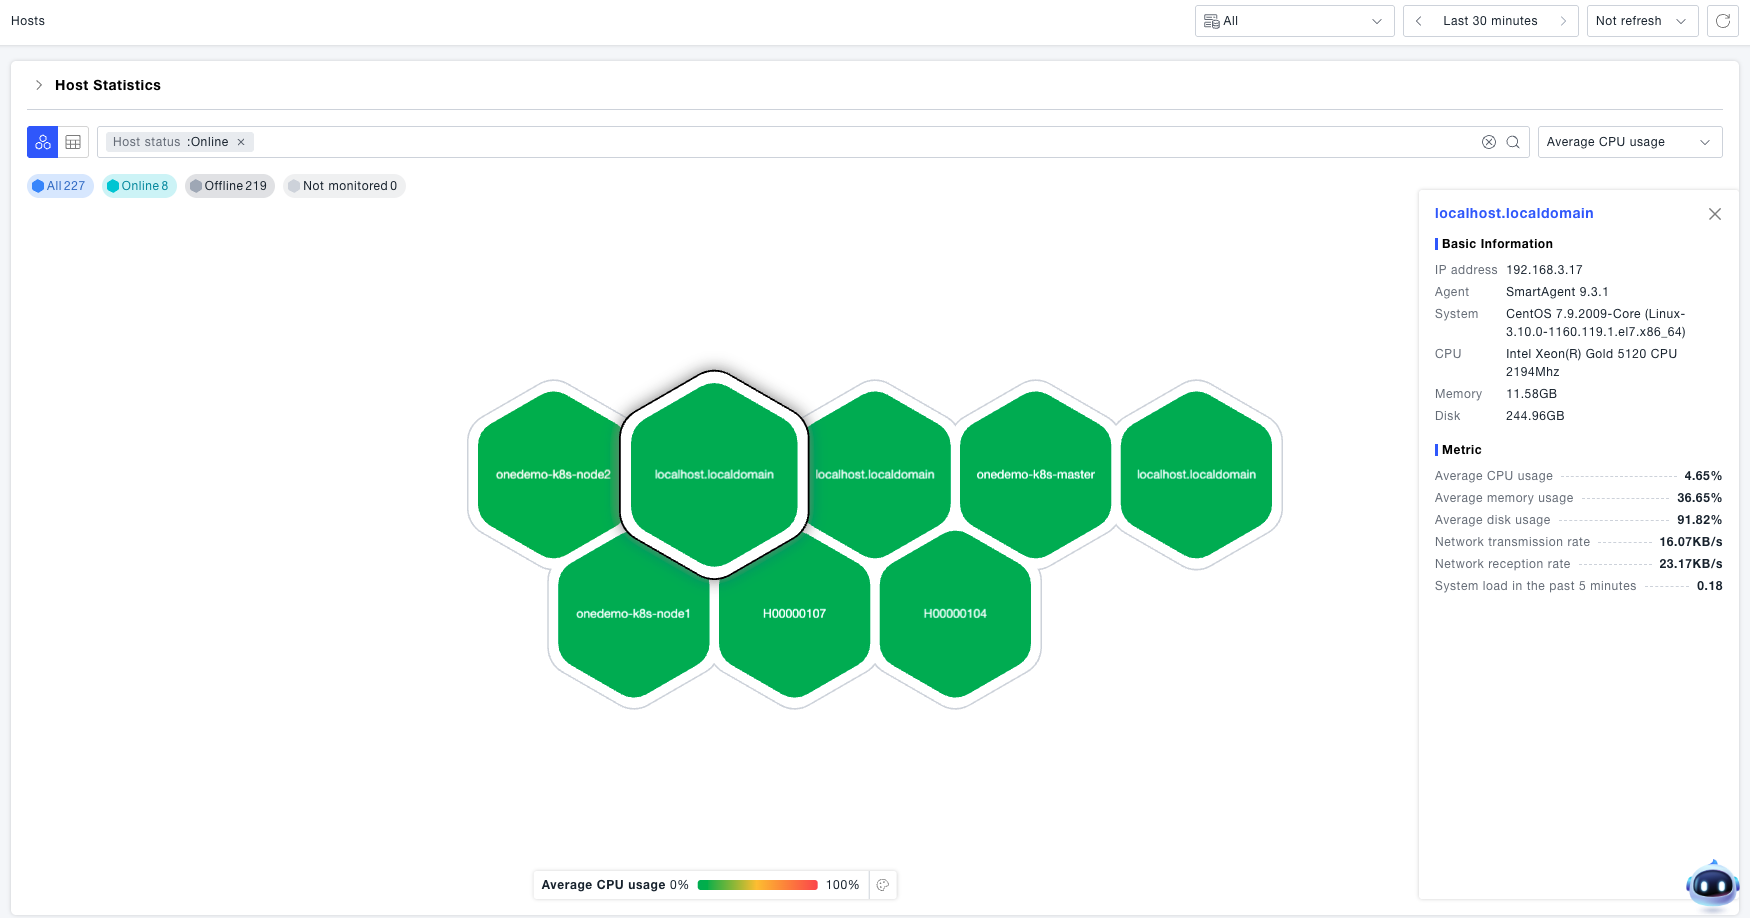
Navigate to the Infrastructure -> Hosts page. Here, you can view the list of hosts whose data is collected by the probe. Hosts can be displayed in two modes: List View and Honeycomb View.
-
In the List View, basic host information and host metric data are displayed. You can use the "Custom Table Header" feature to show the information you care about most.
-
The Honeycomb View displays all online hosts in the platform by default. Honeycombs are colored based on the selected metric; you can change the coloring metric via the settings in the upper right corner. Clicking a specific honeycomb will display the detailed attribute information of the corresponding host.
-
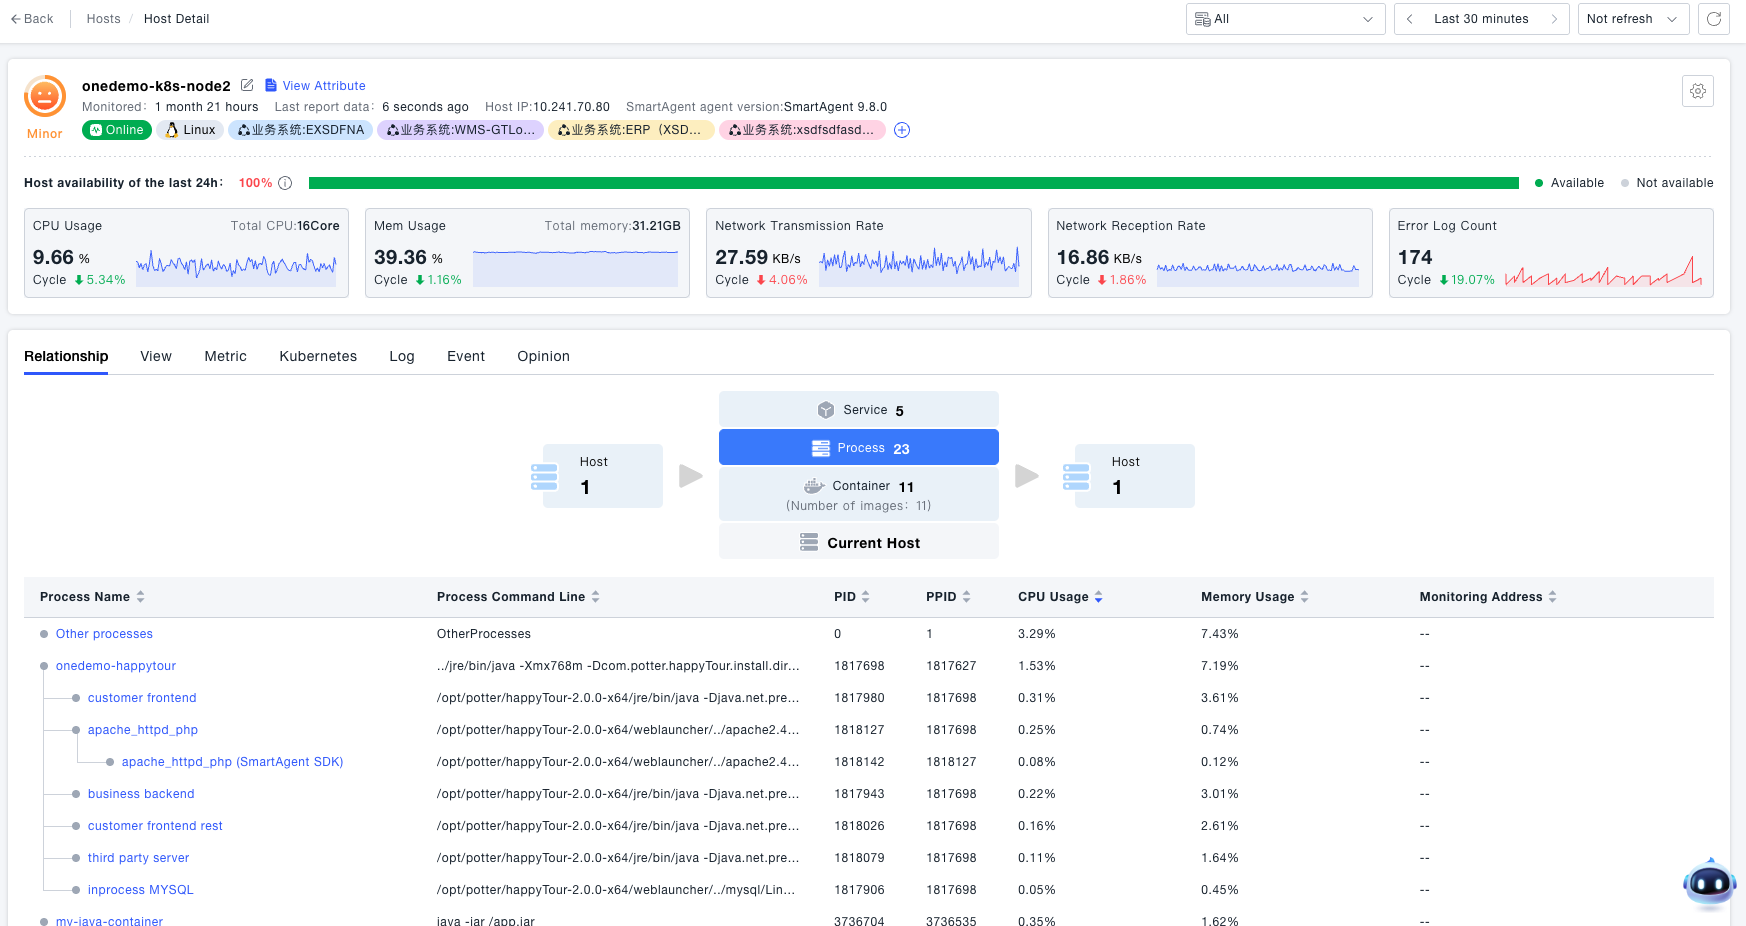
For more detailed information about a single host, the platform provides functions to view its Availability Status, Relationships, Dashboard, Metrics, Events, Insights, and Analysis:
- Relationship View (default for the details page): You can view the dependency relationships of all entities (including containers, processes, and services) on the host (from bottom to top) and horizontal call relationships (e.g., service instances on some hosts calling service instances on this host). This view also shows the ownership of processes, containers, and services running on the current host.
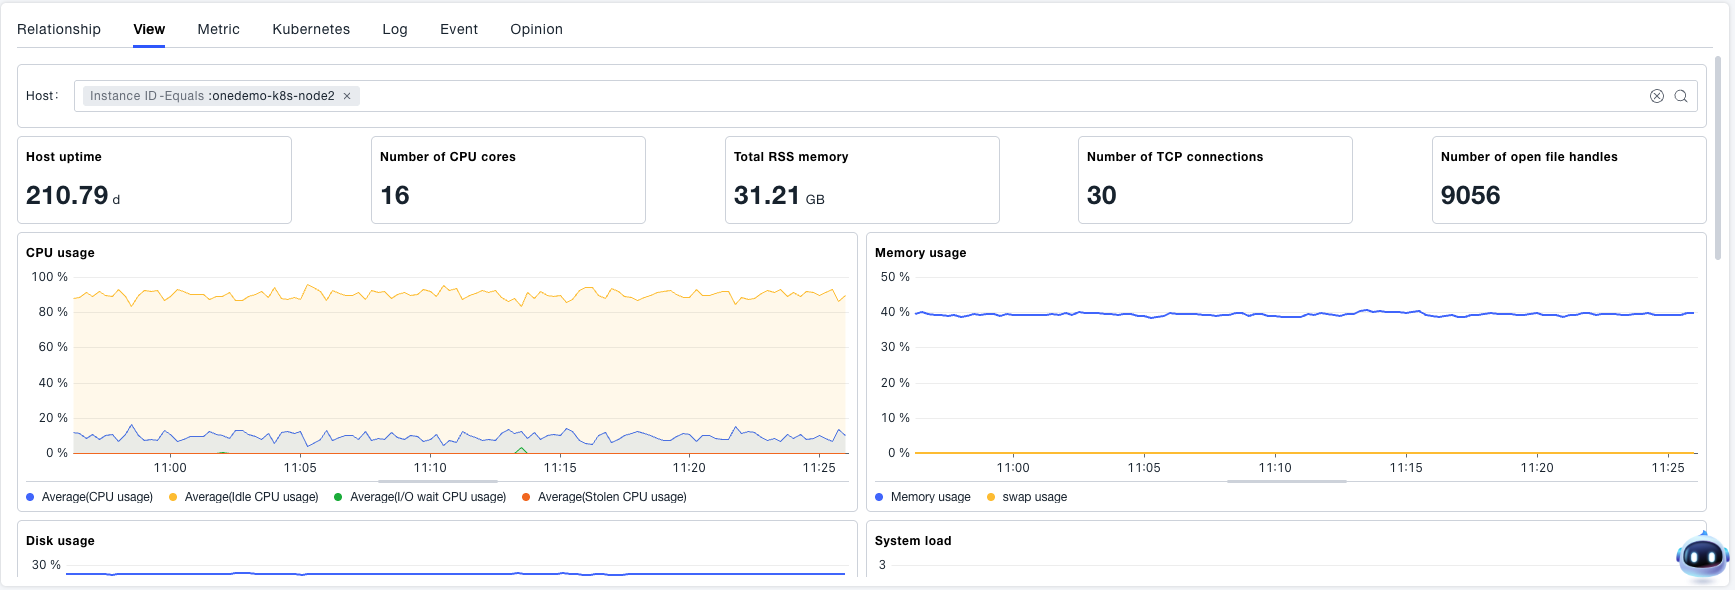
- Built-in Dashboard: Supports multi-dimensional observation of host resource usage, including CPU, memory, disk, network, and processes on the host. Memory usage supports two calculation methods to meet the needs of various O&M scenarios.
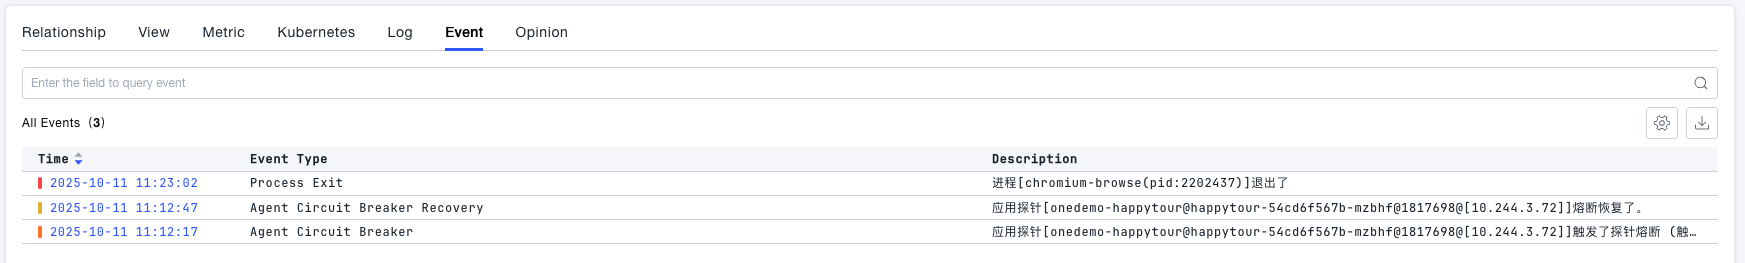
- Events: Displays recent key O&M events of the host, including probe fusing, process startup/exit/crash, and host restart.
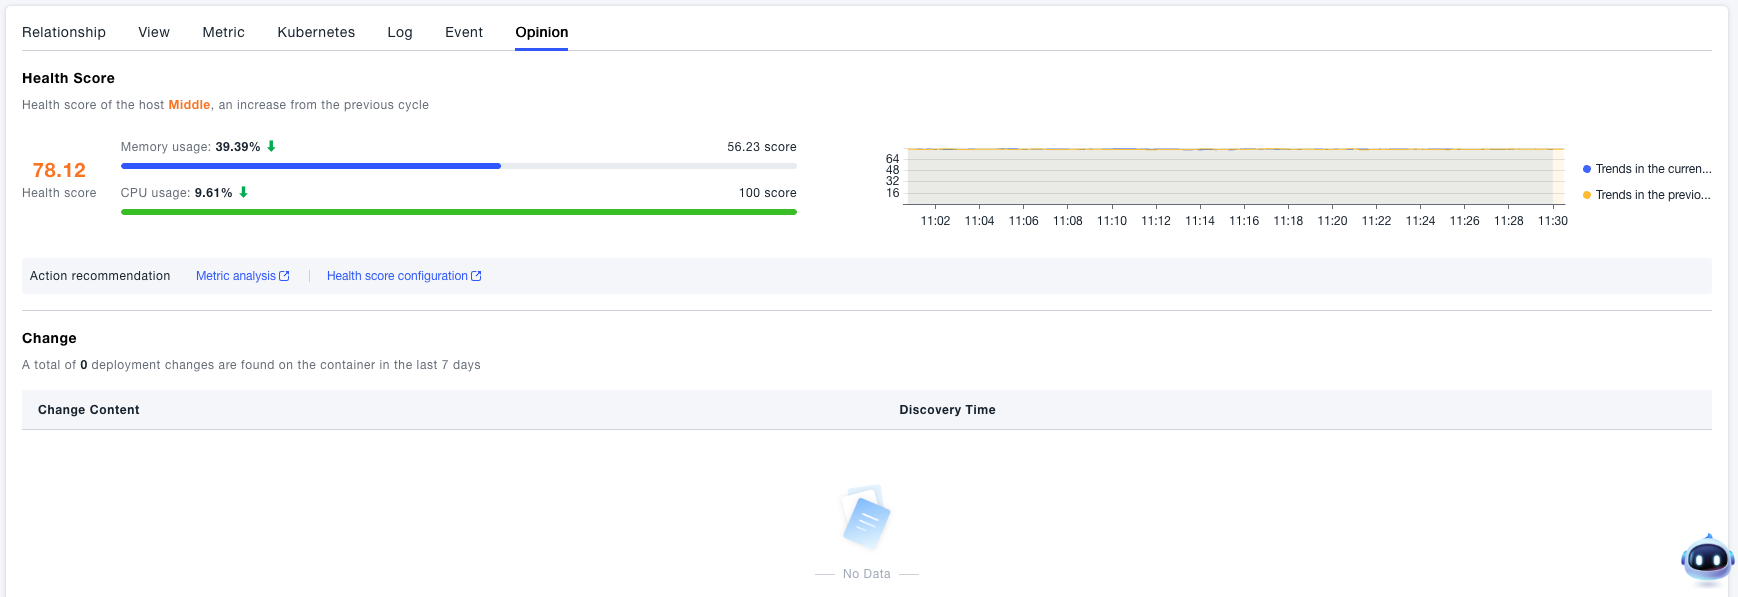
- Insights: Provides personalized insights for the host, including the host’s health score in the past week and the trend of the health score, deployment changes that occurred on the host, and the ranking of key metrics (e.g., containers, processes, disks) on the host in the past 7 days. This helps you analyze the entities with the highest resource consumption.
- Relationship View (default for the details page): You can view the dependency relationships of all entities (including containers, processes, and services) on the host (from bottom to top) and horizontal call relationships (e.g., service instances on some hosts calling service instances on this host). This view also shows the ownership of processes, containers, and services running on the current host.