container
Container technologies (such as Docker and Kubernetes) are widely used in microservices, DevOps, and other scenarios due to their dynamic and lightweight features. However, they also bring monitoring challenges such as "dense deployment, short lifecycle, and resource sharing". The core goal of container monitoring is to "grasp the real-time running status, resource consumption, and business health of containers and clusters".
Preconditions
To use the platform’s container monitoring capabilities, you first need to install the platform probes: SmartAgent and SmartGate. For specific installation methods, please refer to Probe Installation.
Usage Scenarios
- Container Resource Consumption Monitoring and Optimization: The "resource isolation" of containers relies on technologies like Cgroups. However, when containers are densely deployed on a single node, "resource contention" (such as CPU preemption, memory overflow, and disk I/O bottlenecks) is likely to occur. Monitoring is required to realize dynamic resource allocation and optimization.
- Container Lifecycle and Fault Troubleshooting: Containers have a short lifecycle (creation, operation, and destruction may take only a few minutes), and faults are characterized by "fast spread and strong concealment". Monitoring is needed to track container status and locate the root cause of faults.
- Containerized Business and Application Performance Assurance: Containers are the carriers of business applications. It is necessary to associate "container resources" with "business indicators" through monitoring to ensure the stable operation of applications in the container environment.
Get Started
-
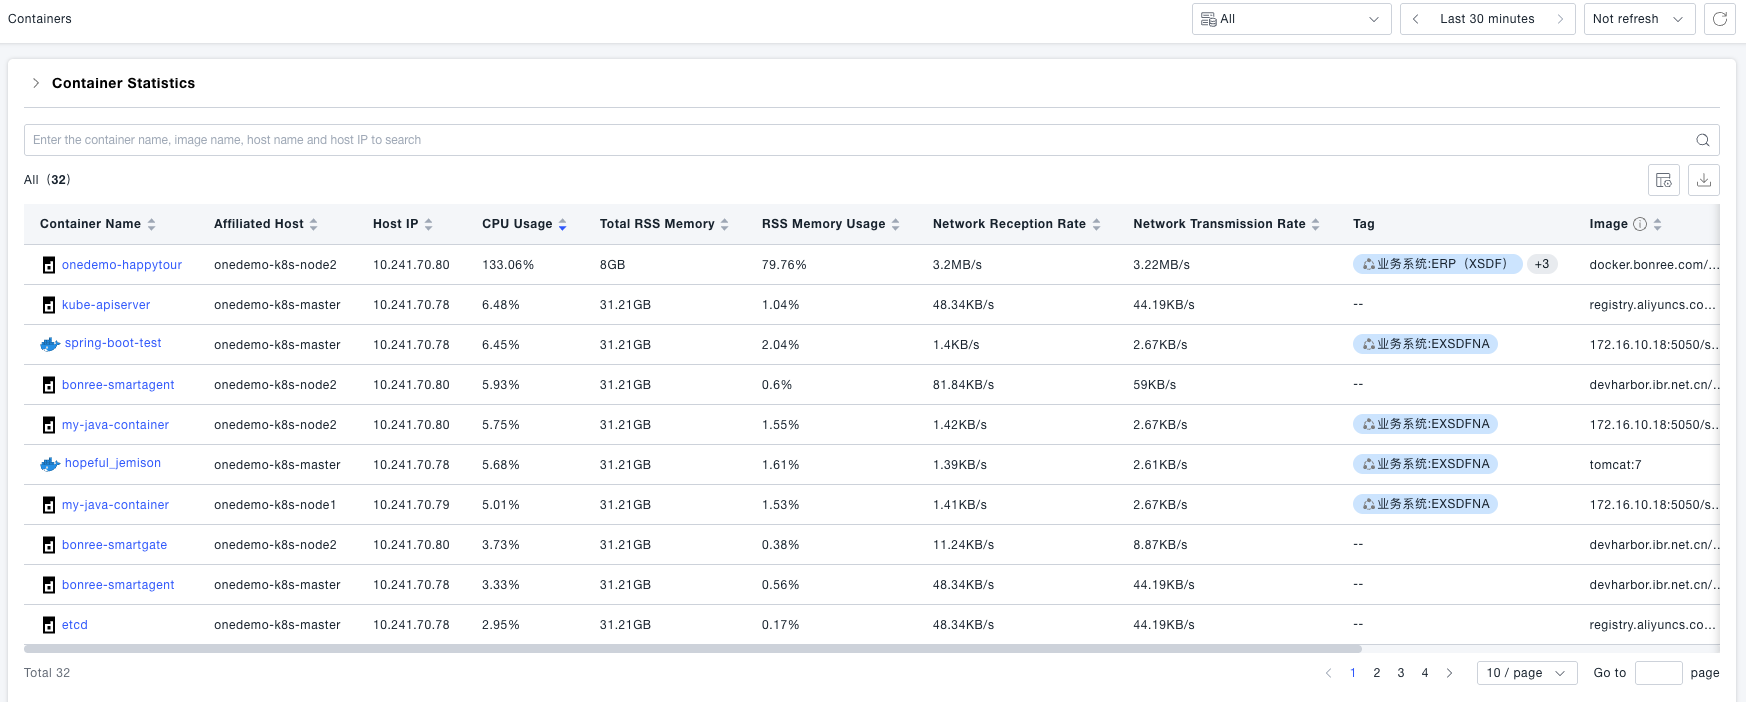
Navigate to the Infrastructure -> Containers page. Here, you can view the list of containers whose data is collected by the probe, including basic container information and metric data.
-
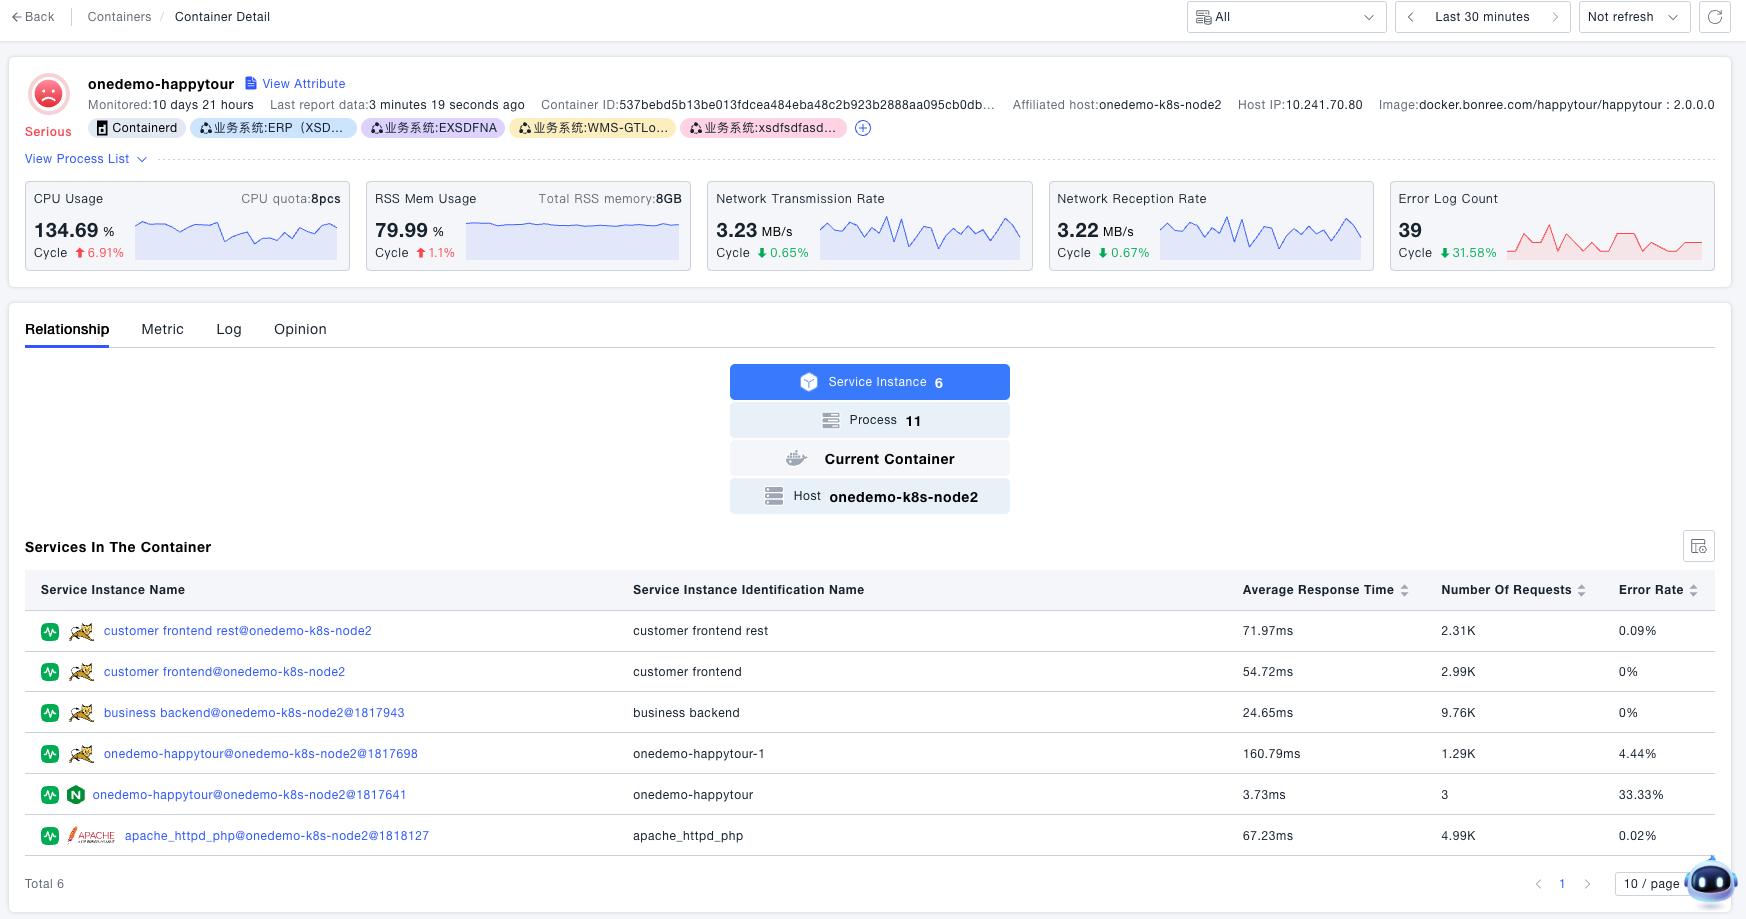
The container details page displays information about key processes in the container, including PID (Process ID), PPID (Parent Process ID), and key process metrics such as CPU utilization and RSS (Resident Set Size) memory usage. Additionally, it shows the upstream and downstream dependency relationships of the container, allowing you to know the host where the container runs, as well as the process group instances and service instances within the container. This helps you quickly understand the upstream and downstream dependent entities of the current container.
-
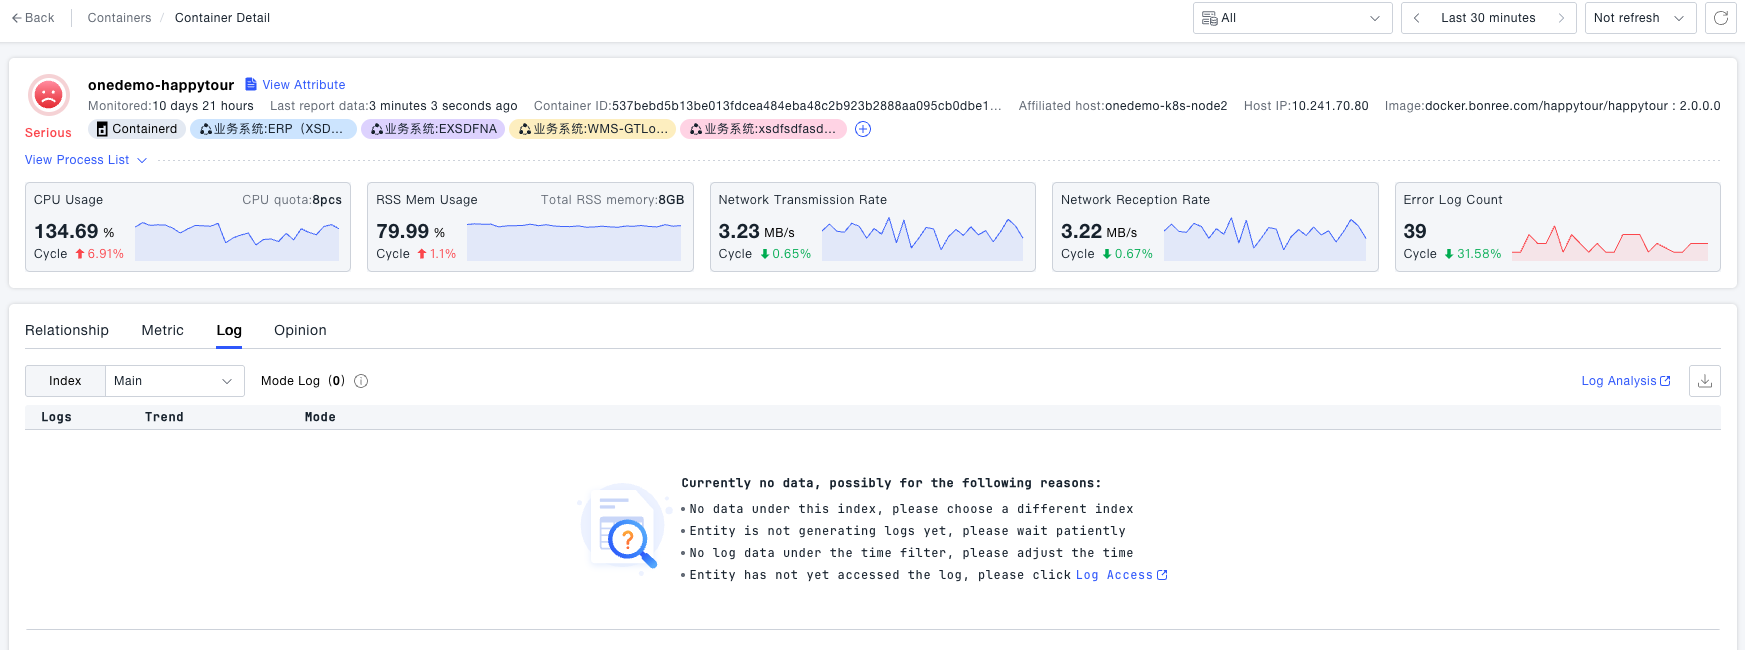
The Log Module displays the log data collected from within the container.
-
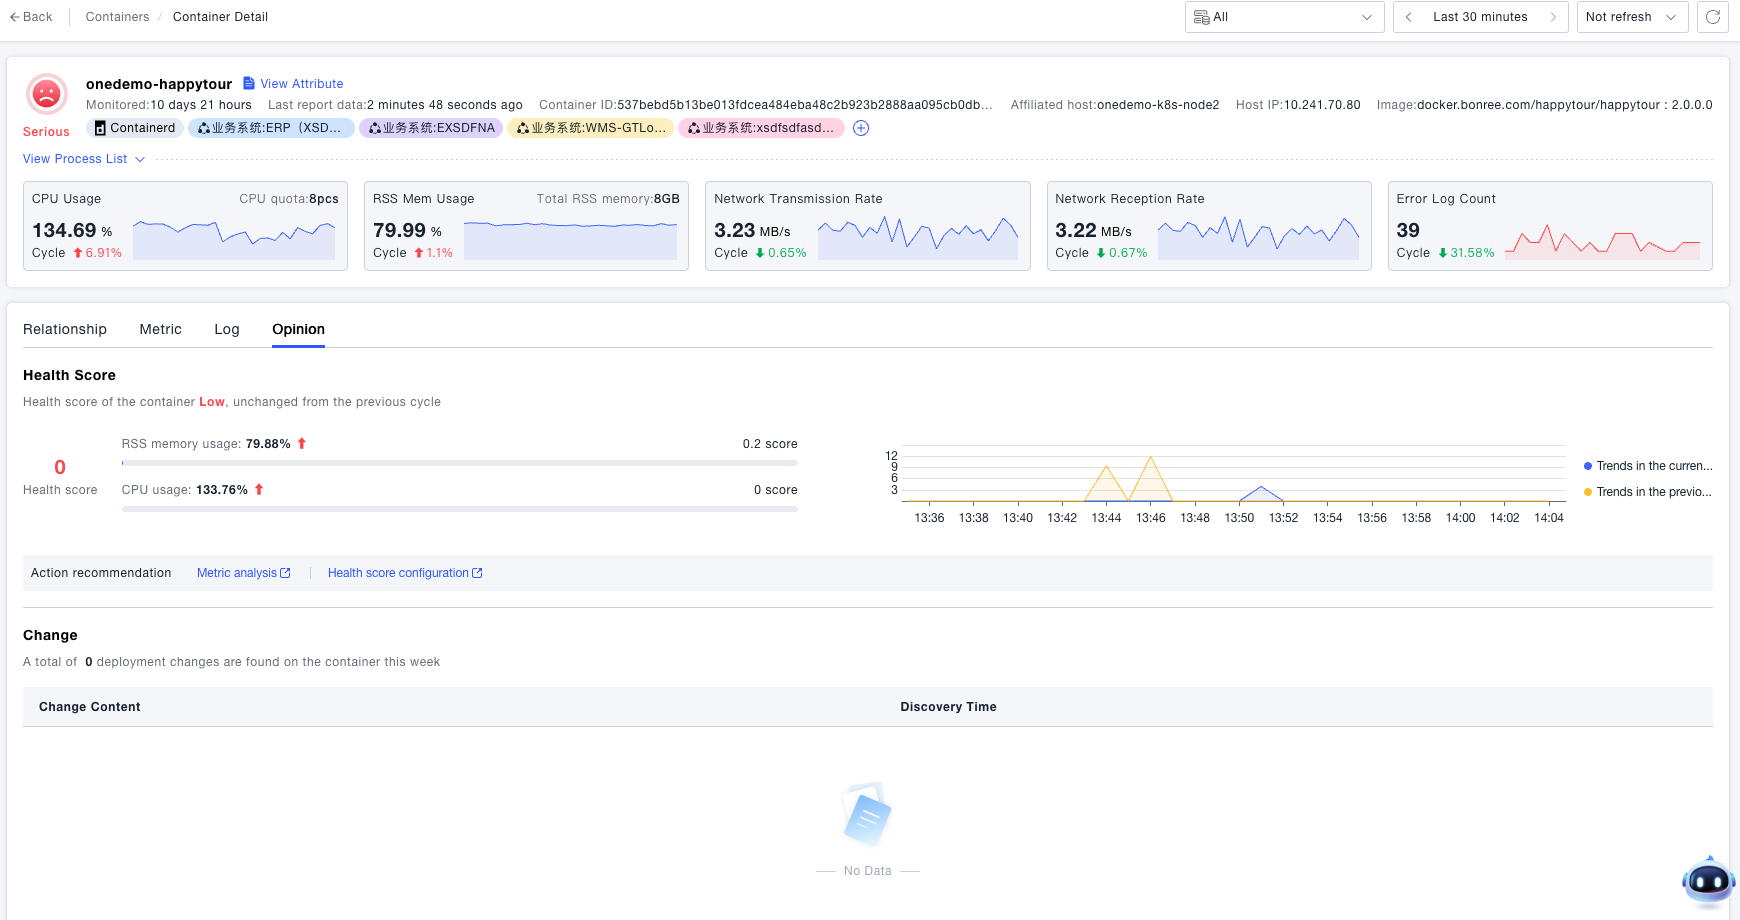
The Container Insights function provides the health score of the container in the past 7 days and its trend changes. It also allows you to view deployment changes in the past 7 days, such as information about newly deployed process groups.