Network Performance Analysis
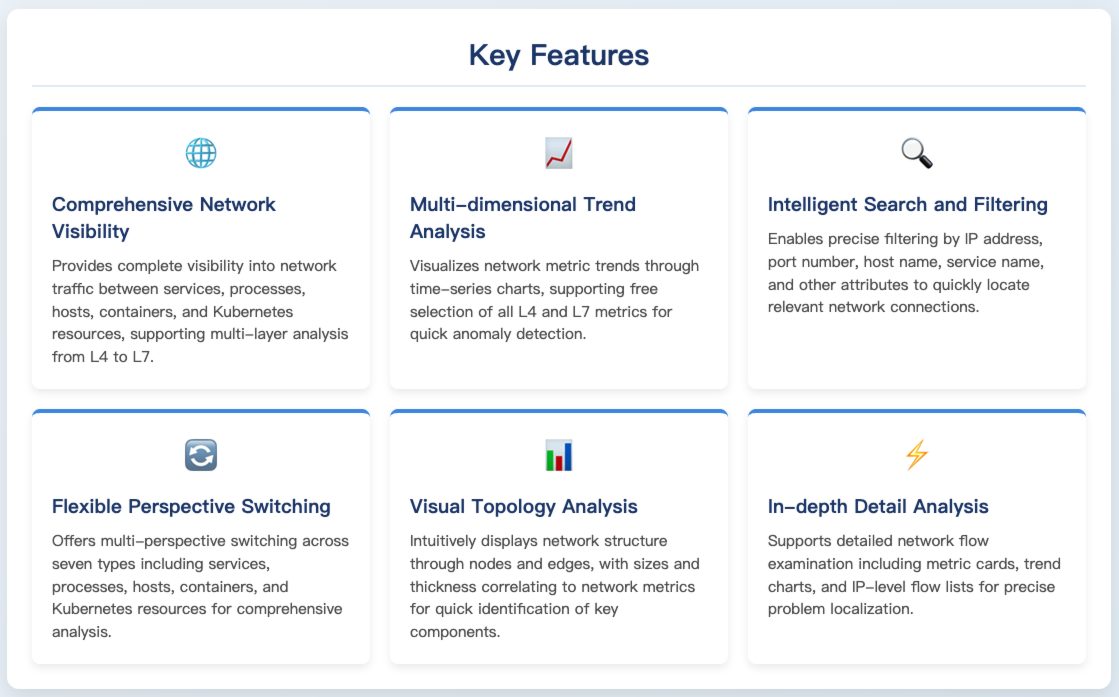
The Network Performance Analysis feature provides comprehensive visibility into network traffic between services, processes, hosts, containers, Kubernetes Pods, Kubernetes Workloads, and Kubernetes Services.
By aggregating connection data at the IP, port, and PID levels, and leveraging the Network Analysis and Network Topology pages, it clearly visualizes dependencies between clients and servers. This capability helps users identify network bottlenecks and performance issues, optimize network topology and configuration, accelerate fault isolation and problem diagnosis, and effectively monitor the network connection status between key services, significantly enhancing network performance and reliability.
Prerequisites
There are no specific prerequisites. However, ensure that relevant network nodes (such as hosts, containers, etc.) are monitored by the system and that network data collection is functioning correctly to accurately obtain and display network performance data.
Use Cases
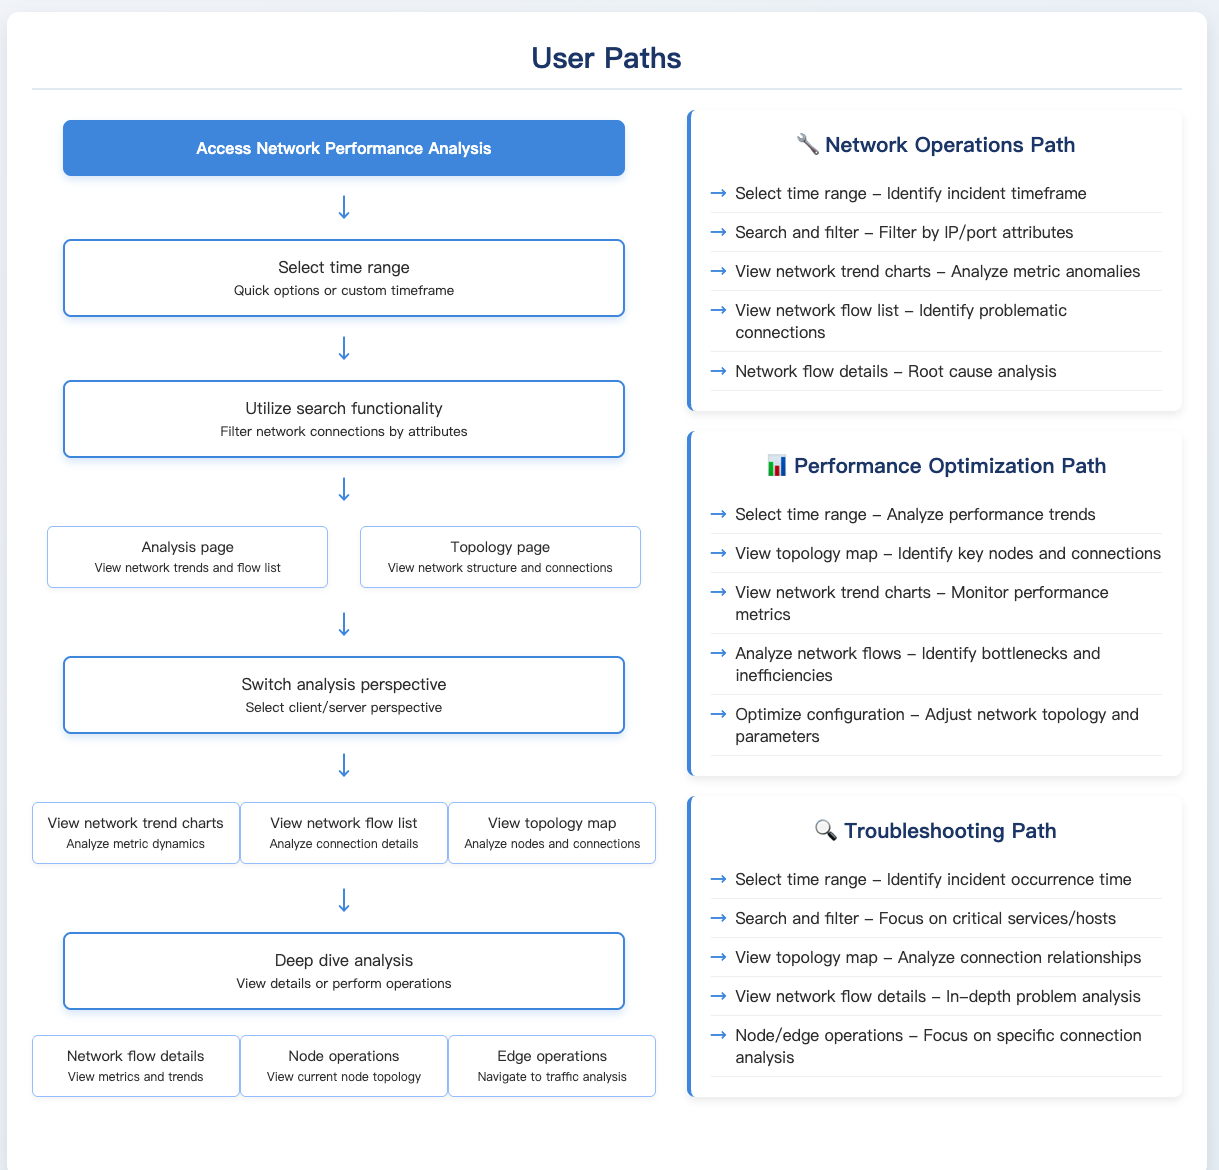
In topology operation and maintenance scenarios, users can leverage Network Performance Analysis for various operations:
Network Troubleshooting: When network abnormalities occur, such as slow service response or connection interruptions, users can quickly pinpoint problematic client-server connections using various metrics (e.g., TCP retransmissions, TCP round-trip time) and the network flow list, facilitating fault isolation and remediation.
Network Performance Optimization: To optimize network performance, metrics like send throughput and receive throughput can be used to identify segments with high network traffic or low transmission efficiency, allowing for adjustments to network configuration or topology to achieve optimization.
Key Service Monitoring: For critical services, Network Performance Analysis enables continuous monitoring of metrics such as bytes sent, bytes received, and QPS, helping users stay informed about the network connection status of key services and ensure their stable operation.
Getting Started
Navigate to Infrastructure -> Network Performance to access the Network Performance Analysis page, which by default displays the analysis page from the host perspective.
In some scenarios, node perspective information might display as "N/A" for the following reasons:
- The peer does not have an agent installed, preventing the retrieval of host, Pod, workload, etc., information.
- The endpoint cannot have an agent installed because it is outside the LAN or restricted by a firewall.
- Current eBPF-based collection gathers network-layer data containing only IP and port information; if a Pod contains multiple containers, the specific owning container cannot be identified.
Metric Definitions
| Metric Category | Metric Name | Metric Meaning |
|---|---|---|
| L4 | Bytes Sent | Total bytes sent |
| L4 | Send Throughput | Rate of bytes sent (bytes per second) |
| L4 | Bytes Received | Total bytes received |
| L4 | Receive Throughput | Rate of bytes received (bytes per second) |
| L4 | TCP Retransmissions | Number of TCP retransmissions |
| L4 | TCP Round-Trip Time | TCP Round-Trip Time (RTT) |
| L4 | TCP Latency | TCP Smoothed Round-Trip Time (SRTT) |
| L4 | TCP Jitter | TCP Smoothed Round-Trip Time Variance (Jitter) |
| L4 | Est. Connections | Number of TCP connections in the ESTABLISHED state |
| L4 | Est. Connections/s | Number of TCP connections entering the ESTABLISHED state per second |
| L4 | Closed Connections | Number of TCP connections in the CLOSED state |
| L4 | Closed Connections/s | Number of TCP connections entering the CLOSED state per second |
| L4 | TCP Connections Initiated/s | Number of TCP connection requests initiated per second |
| L4 | TCP Connections Accepted/s | Number of TCP connections accepted per second |
| L4 | Avg. TCP Connection Time | Average time taken to establish a TCP connection |
| L7 | Request Count | Total number of requests |
| L7 | QPS | Queries Per Second |
| L7 | HTTP Latency | HTTP request response time |
| L7 | Error Request Count | Number of erroneous requests |
| L7 | Request Error Rate | Proportion of erroneous requests |
Analysis
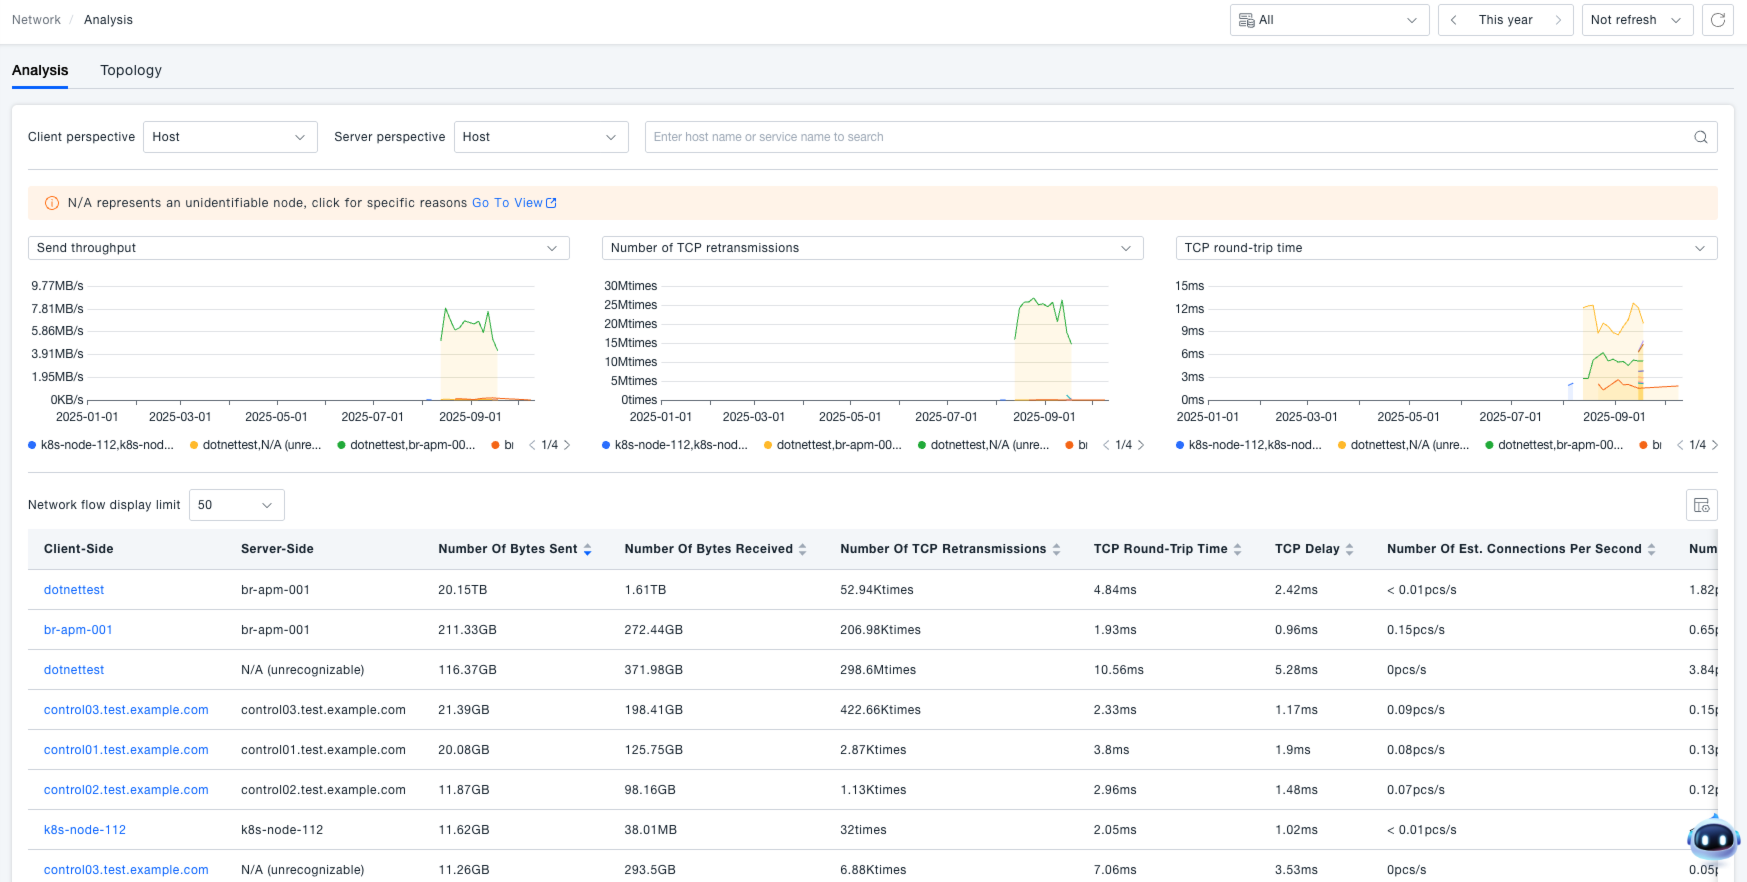
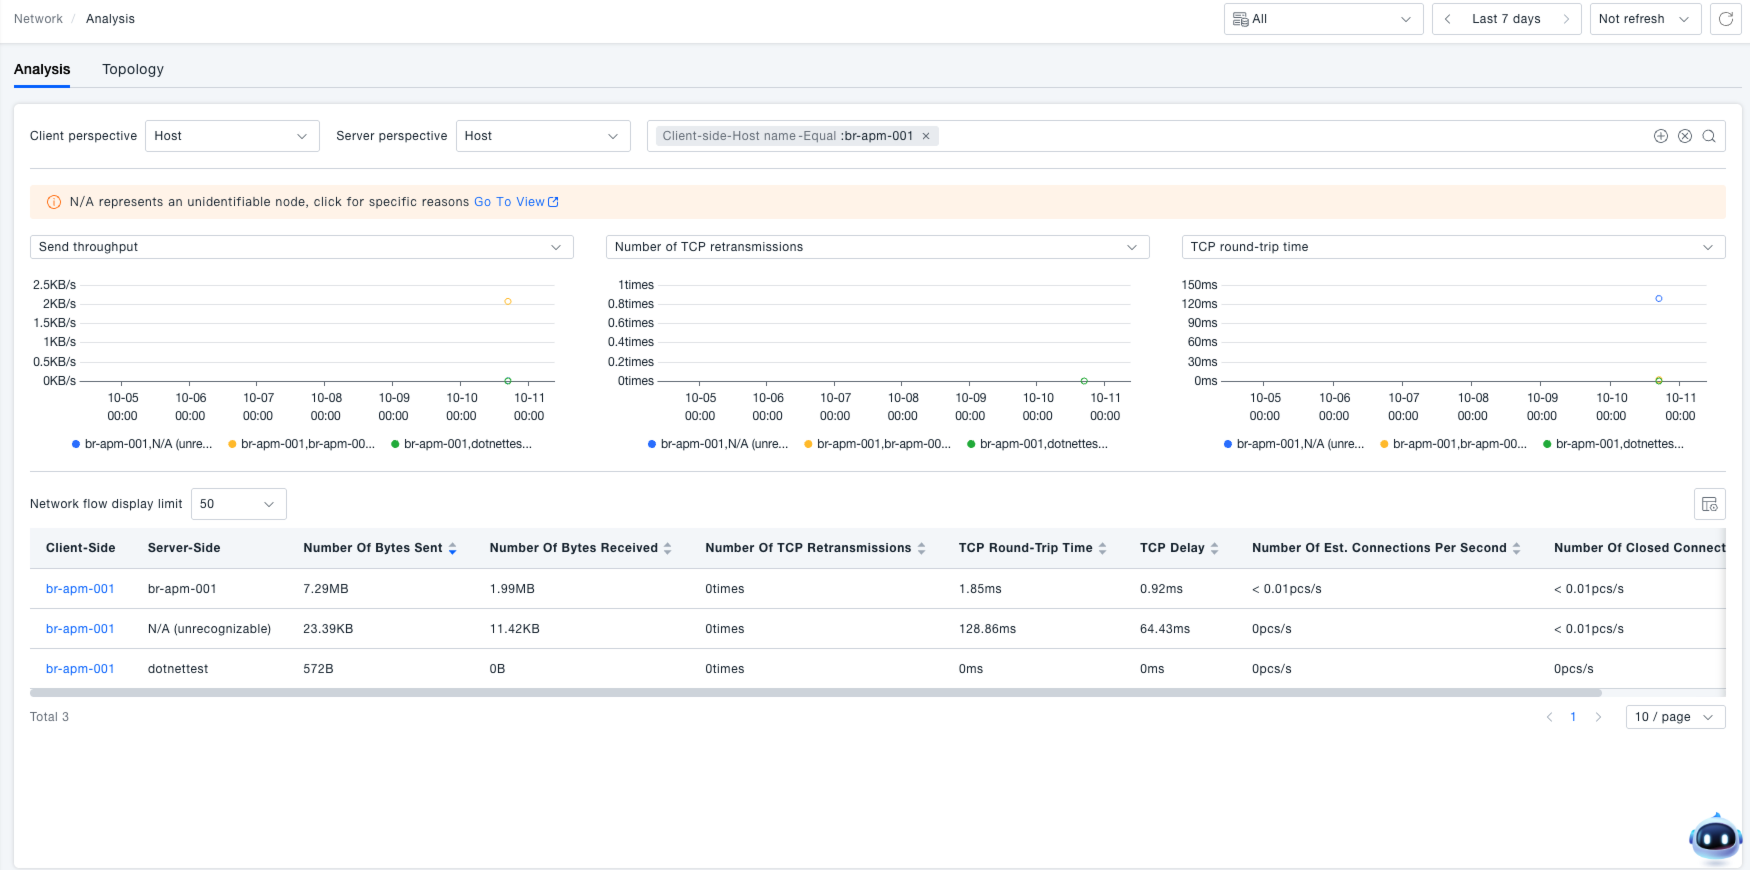
Navigate to Infrastructure -> Network Performance -> Analysis to access the Network Performance Analysis page. By default, it displays the analysis page from the host perspective. This page integrates multi-dimensional network data viewing and analysis tools, helping users comprehensively understand network status.
Time Range Selection
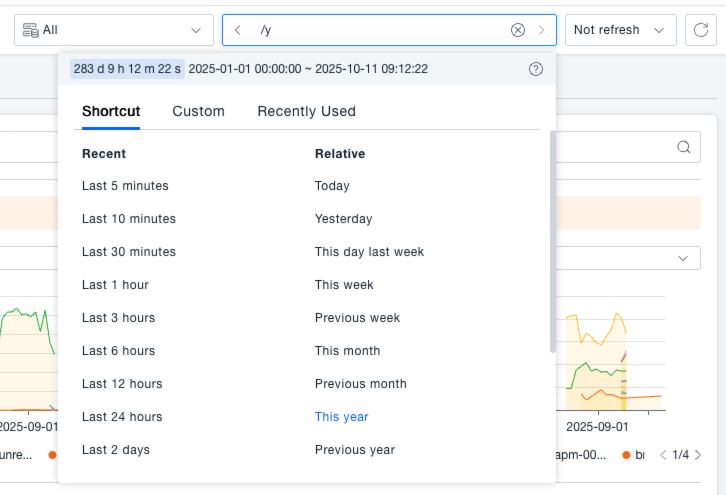
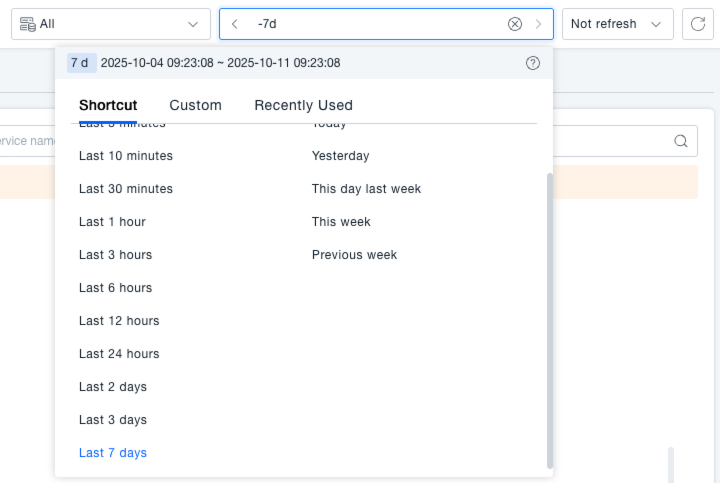
In the time selection area at the top of the page, you can quickly select a time range using preset options (e.g., Last 5 minutes, Last 10 minutes, Last 30 minutes, Last 1 hour) or define a custom time range in the input field to view network performance data for different periods.
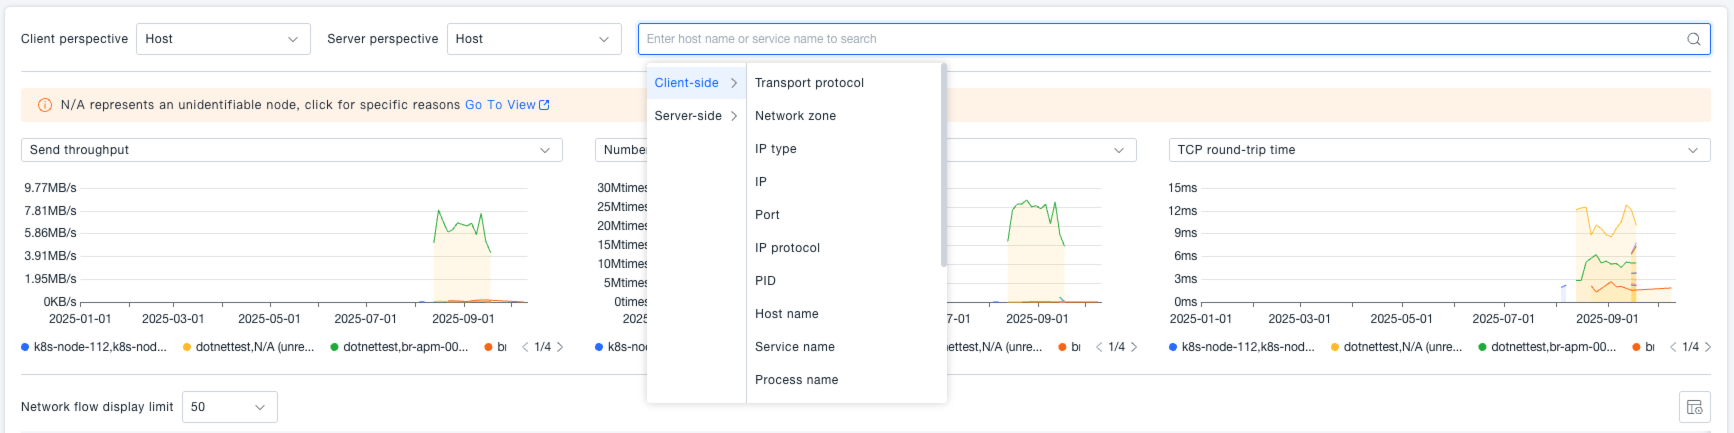
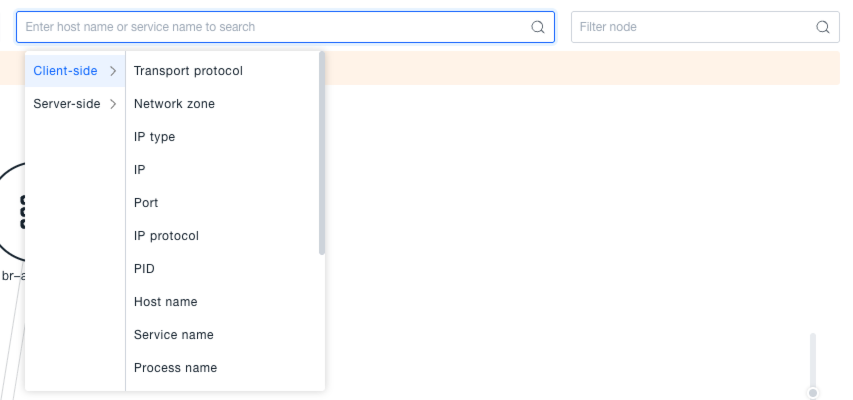
Search Functionality
Supports precise filtering by selecting various client and server attributes, including but not limited to IP address, port number, hostname, service name, container ID, Kubernetes resource labels, etc. Users can combine filter conditions based on actual needs to quickly locate network connections of interest, filter out irrelevant data, and focus on core network analysis scenarios.
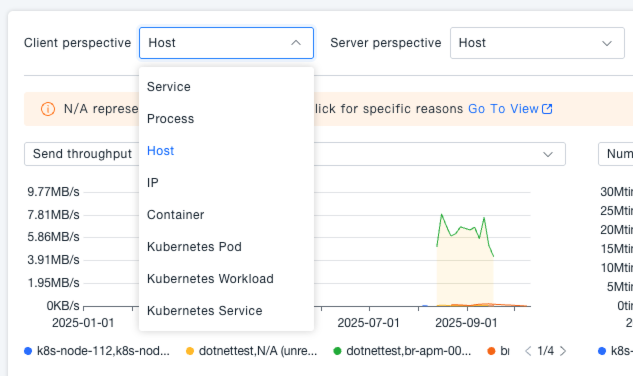
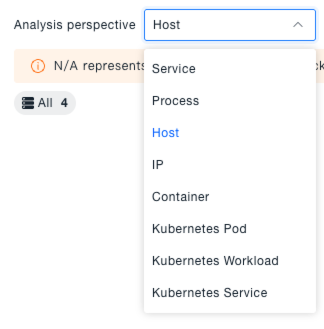
Analysis Perspective Switching
Provides flexible multi-perspective switching. Both client and server perspectives can be selected independently from seven types: Service, Process, Host, Container, Kubernetes Pod, Kubernetes Workload, and Kubernetes Service. By switching perspectives, users can observe network interactions from different layers (e.g., infrastructure layers like Host and Container, application deployment layers like Kubernetes resources, business layers like Service and Process), meeting full-dimensional analysis needs from macro architecture to micro instances.
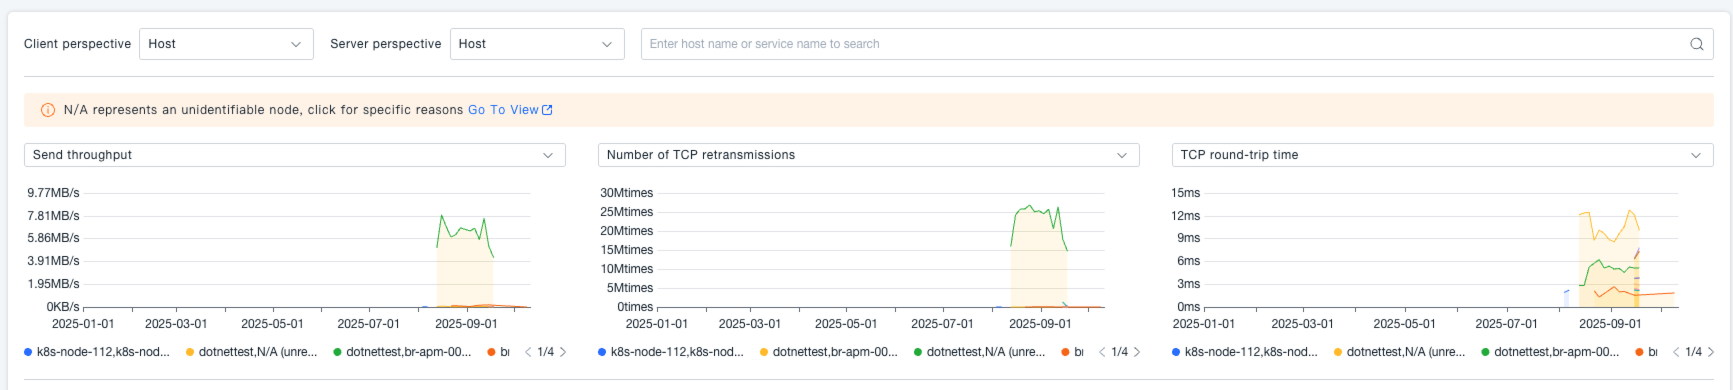
Viewing Network Trend Charts
Intuitively displays the dynamic trends of network metrics in time-series line charts. Supports free selection of metrics from the full set of L4 and L7 indicators (default shows Send Throughput, TCP Retransmissions, TCP Round-Trip Time). Users can quickly identify abnormal metric fluctuations (e.g., sudden spikes in retransmissions, latency peaks) via trend charts, analyze performance change patterns over time, and trace the occurrence time and duration of issues. For example, selecting the "Send Throughput" metric shows the curve of bytes sent per second over time; selecting "TCP Retransmissions" reveals fluctuations in TCP retransmission situations.
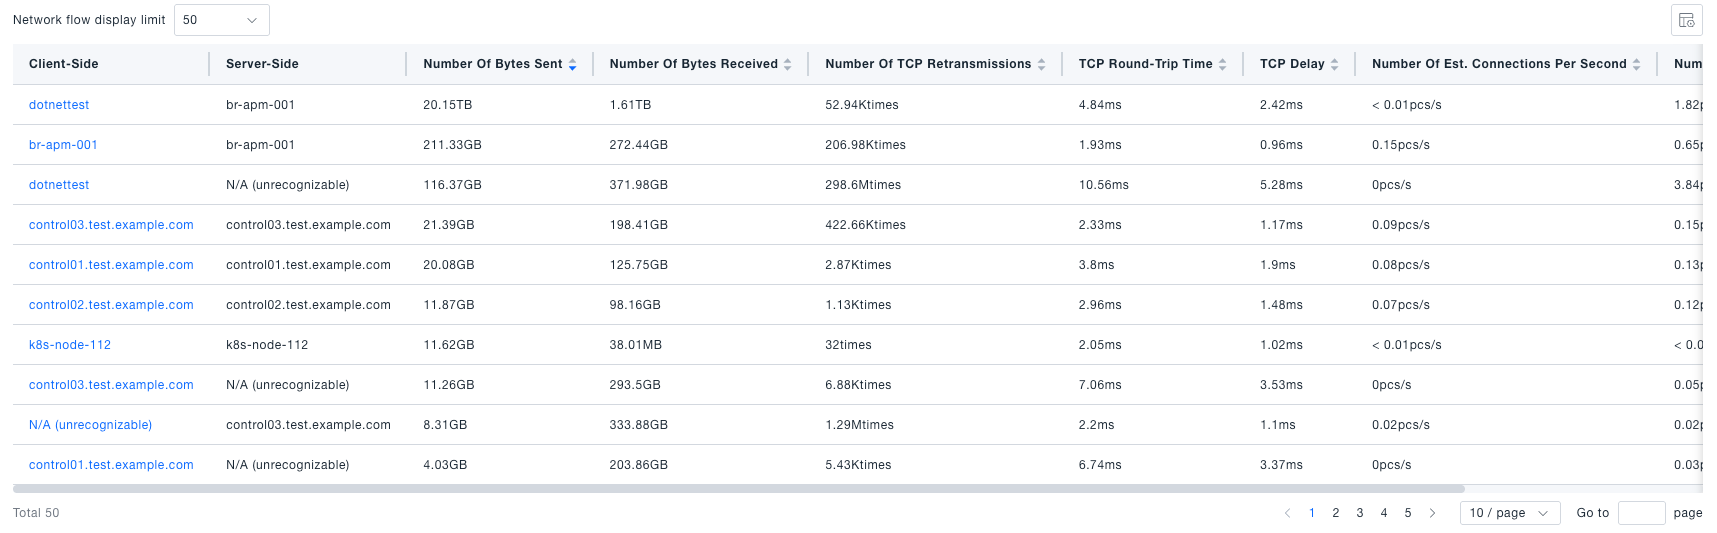
Viewing Network Flow List
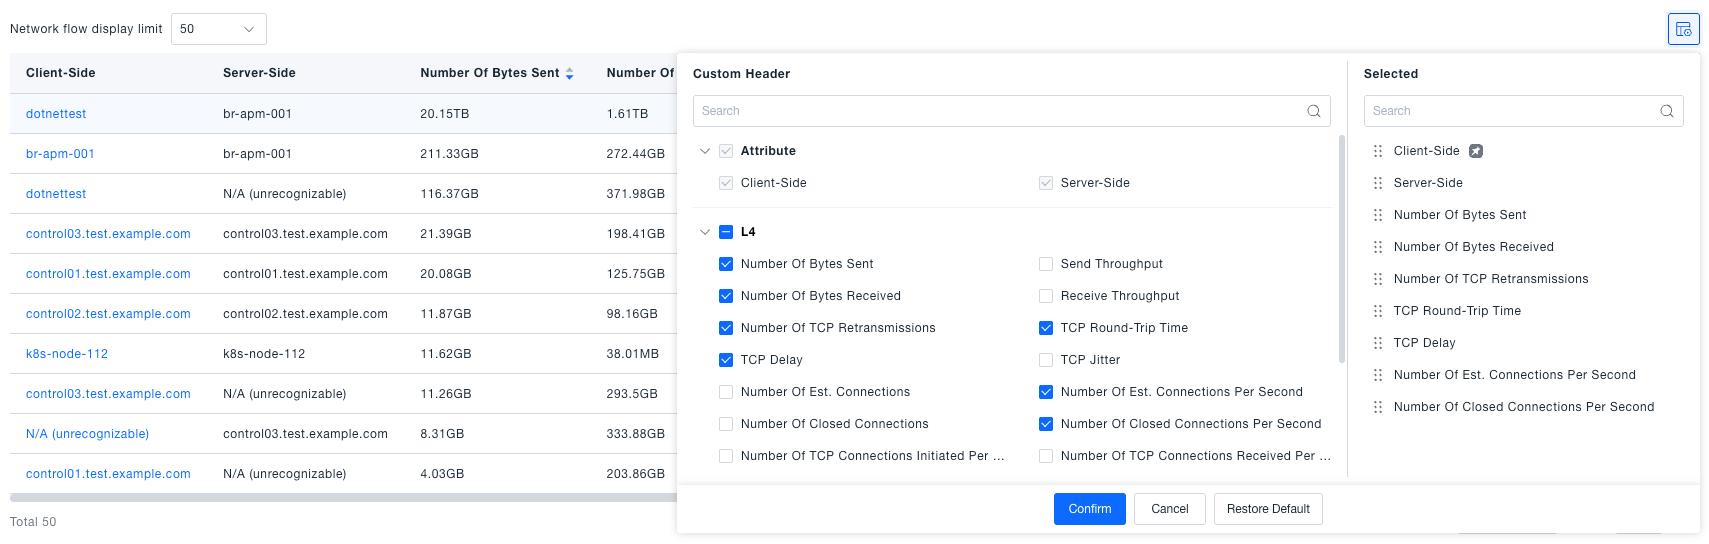
Presents detailed network connections between all clients and servers under the current perspective in a tabular format, where each row represents an independent network flow. The table includes complete entity identification information (client and server names, IPs, ports, etc.) and integrates core L4 (bytes sent/received, connection status, TCP metrics, etc.) and L7 (request count, QPS, latency, error rate, etc.) metric data. Supports sorting, pagination, and custom column display for easy comparison and analysis of performance differences across network flows.
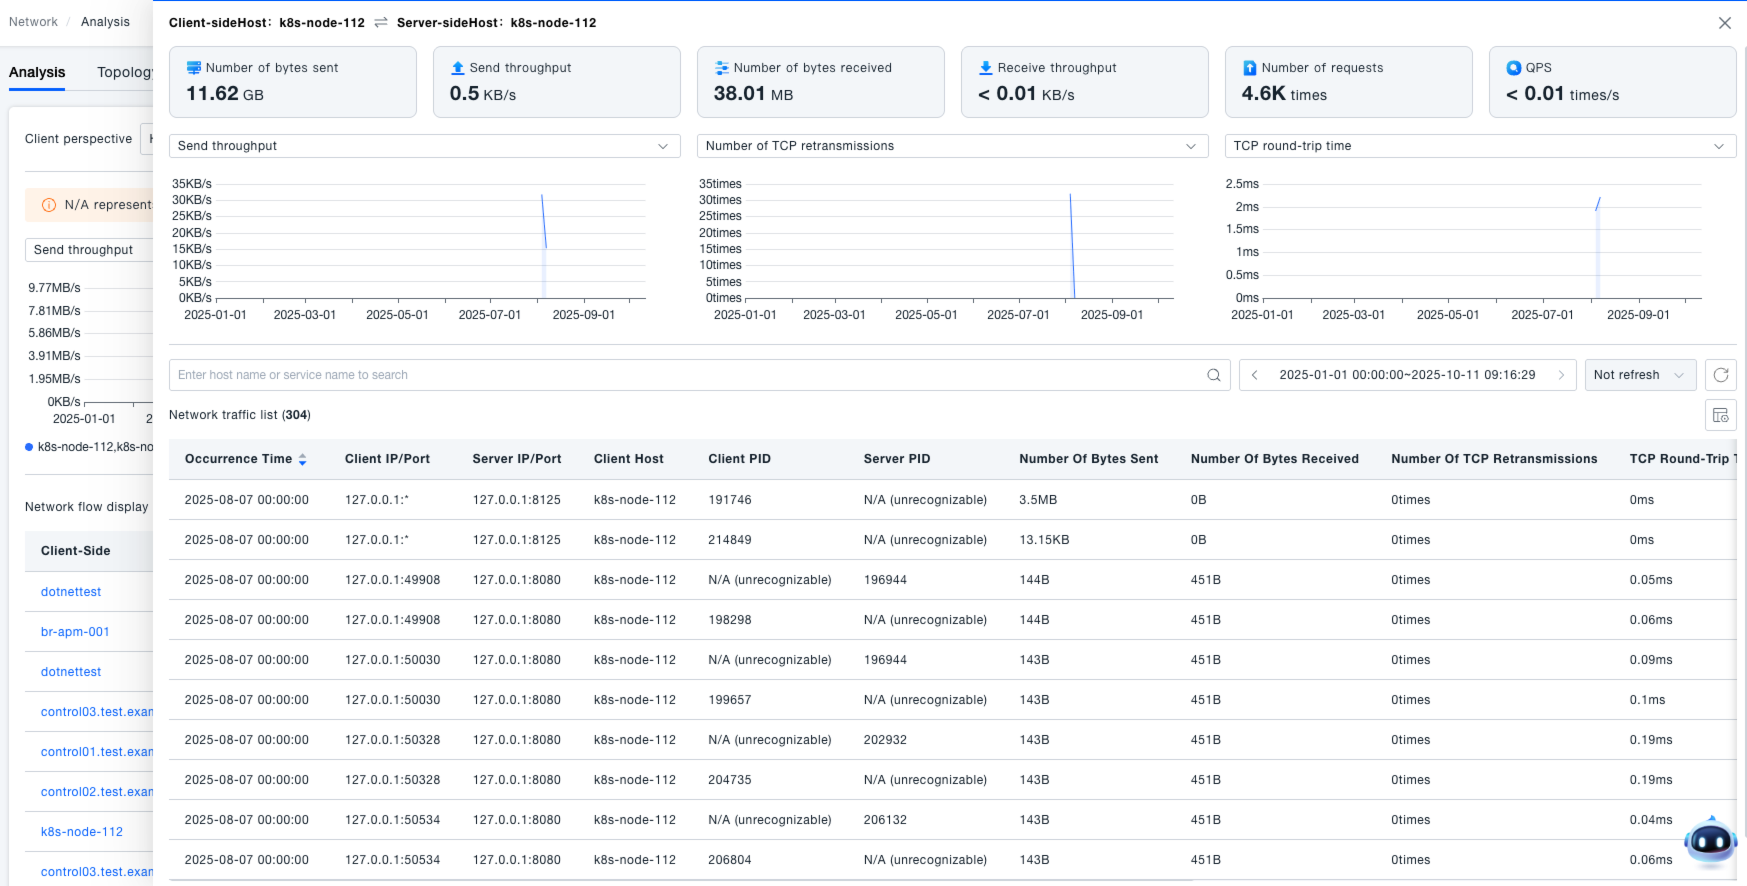
Viewing Network Flow Details
Clicking any row in the network flow list navigates to the detail page for that specific flow. The detail page contains three core sections:
- Metric Cards: Displays key metrics' real-time and statistical values (e.g., average latency, total requests) using intuitive numerical cards.
- Metric Trend Charts: Provides more granular time-series curves for core metrics, supporting zooming into specific time periods to view detailed fluctuations.
- IP-level Network Flow List: Shows subdivided connection data at the underlying IP level for this flow, including source/destination IPs, port mappings, and corresponding performance metrics, aiding in deep troubleshooting of issues across subnets or multiple instances.
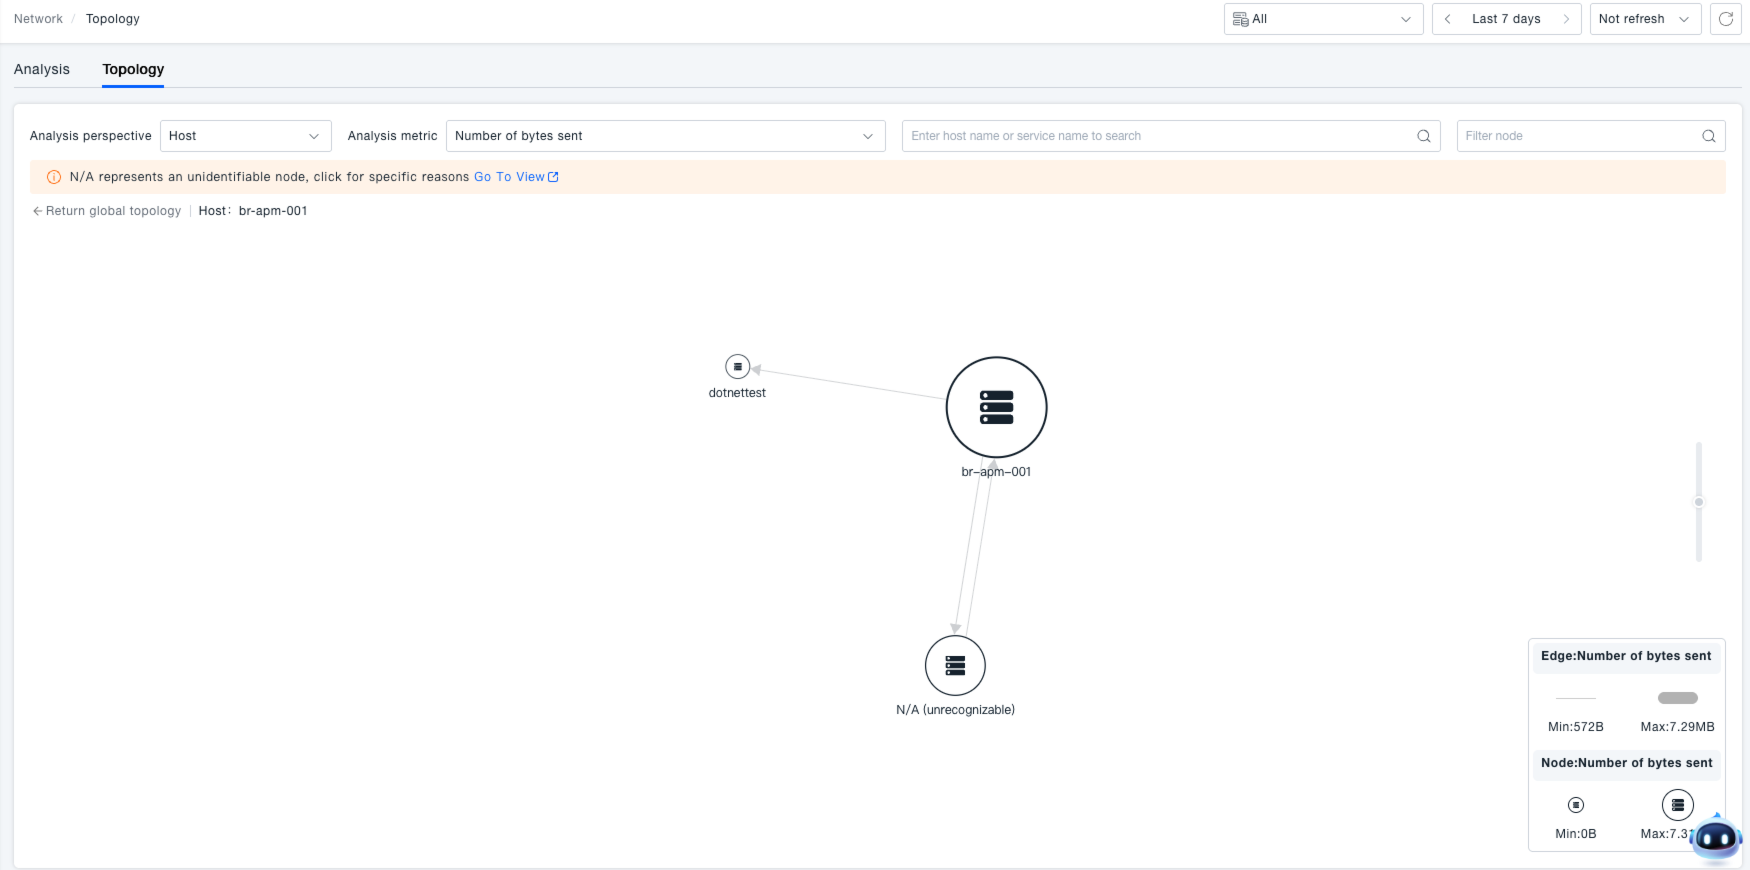
Topology
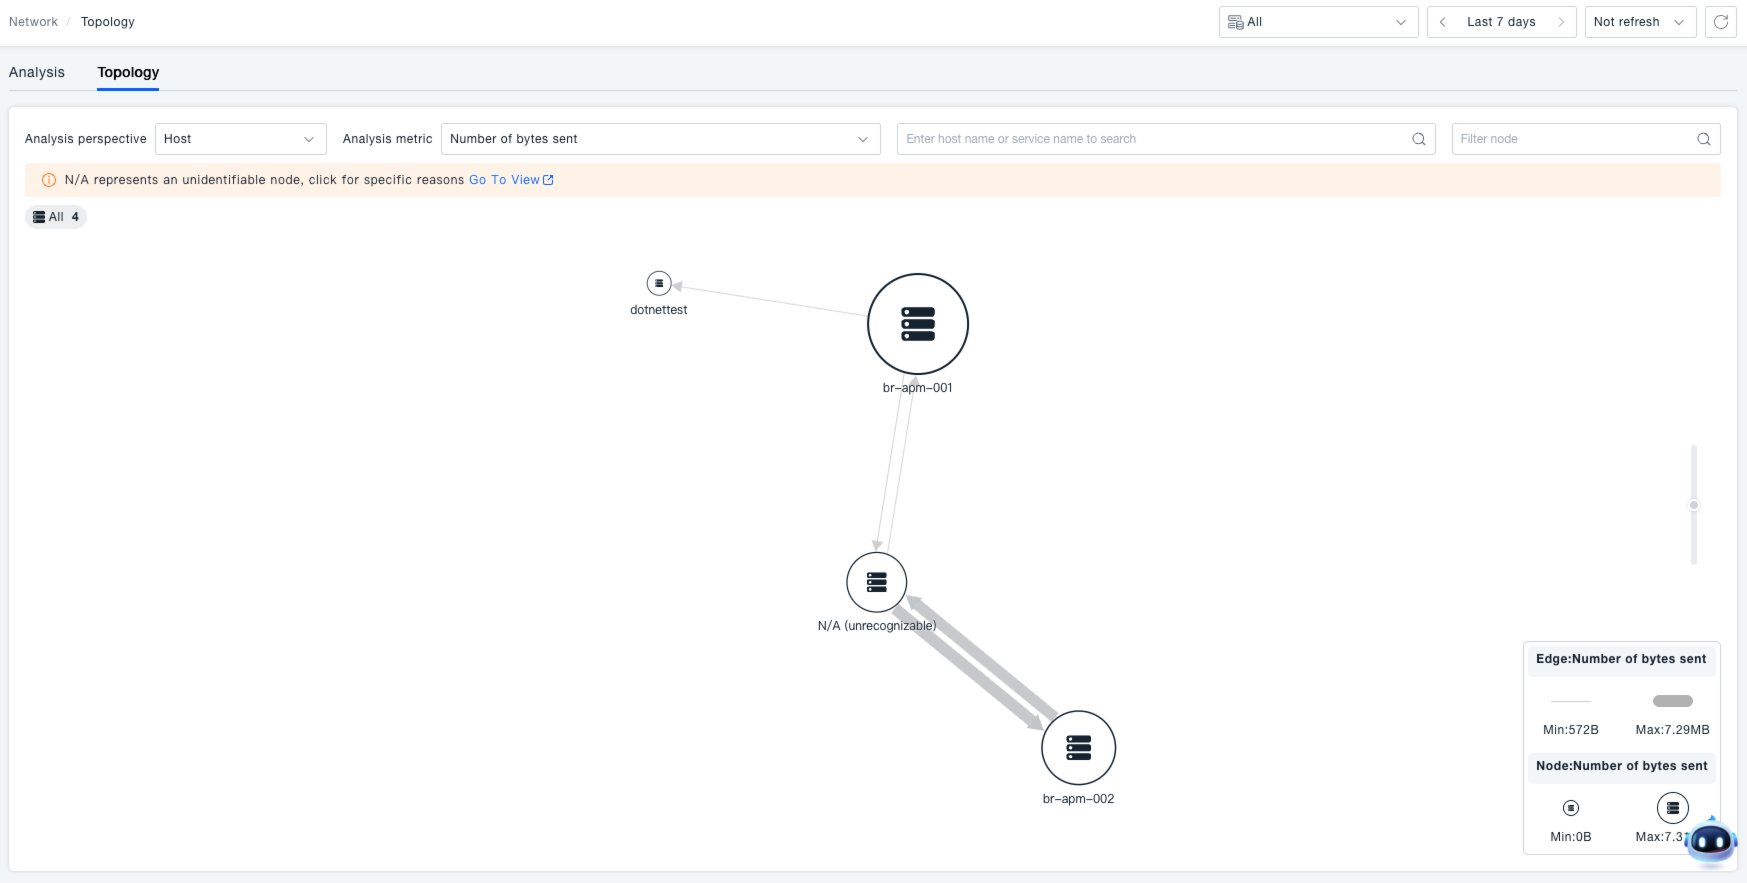
Navigate to Infrastructure -> Network Performance -> Topology to access the Network Performance Topology page. Here, you can view network topologies from different perspectives, intuitively presenting network nodes and connection relationships to aid in network structure and traffic analysis.
The topology map displays the network structure using nodes and edges.
- The size of nodes and the thickness of edges are proportional to the corresponding network metric values, enabling quick and intuitive identification of key nodes and traffic scale.
- Supports entering a node name in the top-right corner to filter the topology map, focusing analysis on specific nodes.
Time Range Selection
The time control supports viewing network topology analysis for the last 7 days, meeting the needs for network state review and analysis across different time spans.
Search Functionality
Allows selection of different client and server attributes to filter network connections, enabling precise viewing of the relevant network topology map, filtering out irrelevant connections, and focusing on core analysis objects.
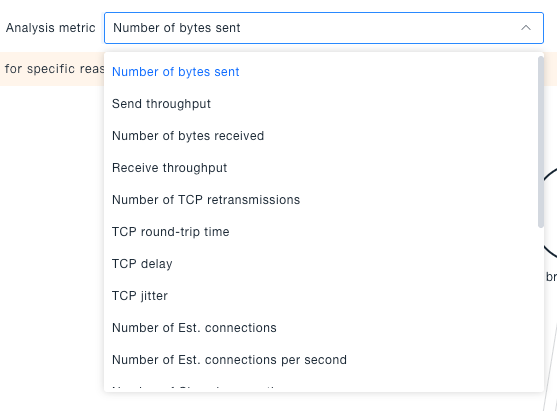
Analysis Perspective and Metric Selection
Analysis Perspective: Choose different analysis perspectives to view the topology. The selected perspective determines the meaning of the nodes in the topology map, covering perspectives such as Service, Process, Host, Container, Kubernetes Pod, Kubernetes Workload, and Kubernetes Service.
Analysis Metric: Select different analysis metrics to view the topology. The selected metric determines the indicators displayed on the topology nodes and edges, such as Bytes Sent, Send Throughput, TCP Retransmissions, etc.
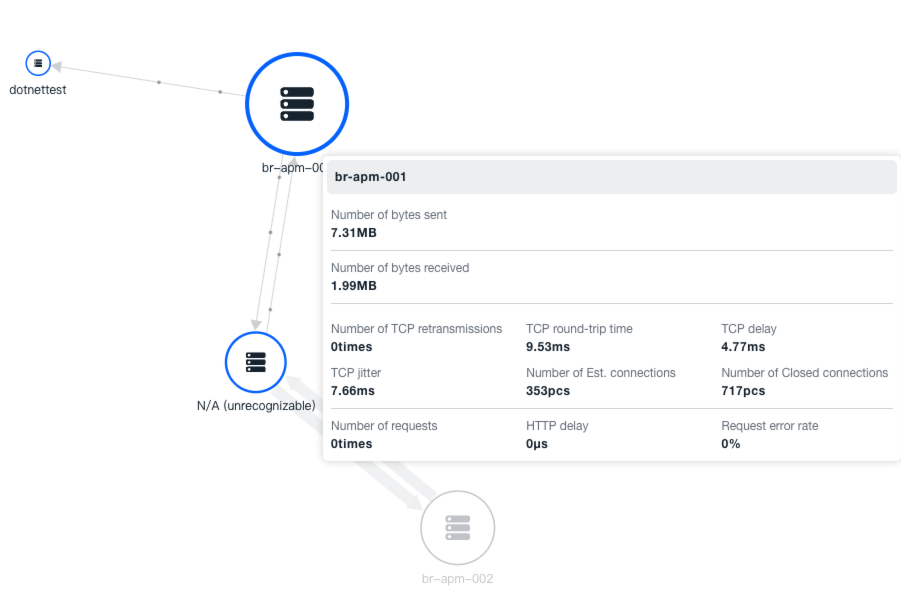
Viewing Node Details
Hover the mouse over a node in the topology map to view its details, including key traffic metrics (e.g., Bytes Sent, Bytes Received, TCP-related metrics, request metrics, etc.), allowing for quick understanding of the node's traffic characteristics.
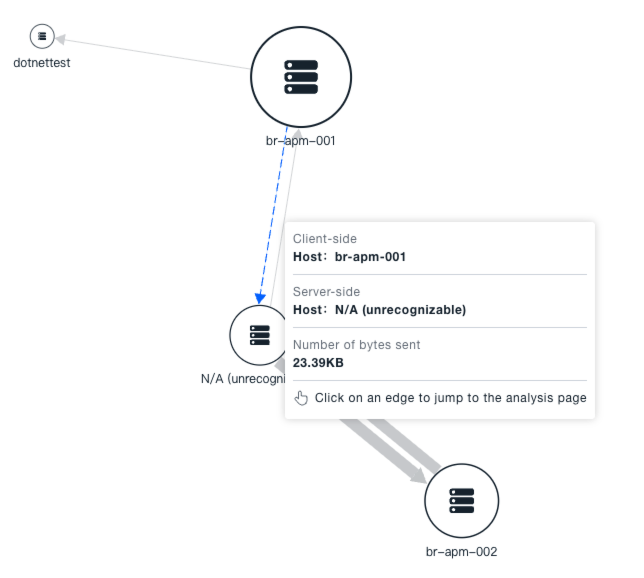
Viewing Edge Details
Hover the mouse over an edge in the topology map to view its details, including the flow status and key traffic metrics for that edge, providing a clear understanding of the traffic situation between the connected nodes.
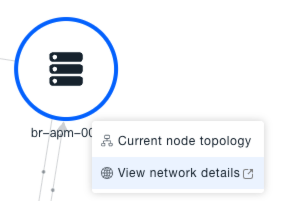
Node Operations
Clicking a node in the topology map displays operation options, including "Current Node Topology" and "View Network Details":
Click "Current Node Topology" to view the topology map related to this node's traffic, focusing on its network connection relationships.
Click "View Network Details" to jump to the traffic analysis page, displaying network flow analysis with the current perspective as the client search condition, enabling in-depth analysis of the network traffic involving this node.
Edge Operations
Left-click an edge in the topology map to jump to the traffic analysis page, viewing the network flow analysis corresponding to that specific edge, precisely locating the traffic details of the network connection between the nodes.
