Kubernetes
Kubernetes, the core technology in container orchestration, provides powerful support for managing large-scale containerized applications. Within the ONE platform, the Kubernetes functionality enables comprehensive monitoring of various objects such as clusters, workloads, and pods, including their information, status, and resource utilization, assisting users in efficiently managing and optimizing Kubernetes clusters. It tracks dynamic changes in object resources and correlates them with monitoring data like logs and metrics, providing strong support for troubleshooting and diagnostics.
Use cases
Cluster Management Scenario: When users need unified management of multiple Kubernetes clusters, they can use the Kubernetes functionality in the ONE platform to view node counts, namespace counts, resource usage, etc., for each cluster, facilitating cluster resource planning and scheduling.
Application Monitoring Scenario: For various applications running in Kubernetes clusters (such as those deployed via Deployments, StatefulSets, and other workloads), users can leverage this functionality to monitor resource usage, runtime status of associated Pods, as well as events and logs generated by the applications, enabling timely detection of application anomalies.
Troubleshooting Scenario: When cluster or application failures occur, users can quickly identify the root cause—such as Pod startup failures or resource shortages—by viewing Kubernetes object events and logs, combined with resource utilization metrics.
Getting started
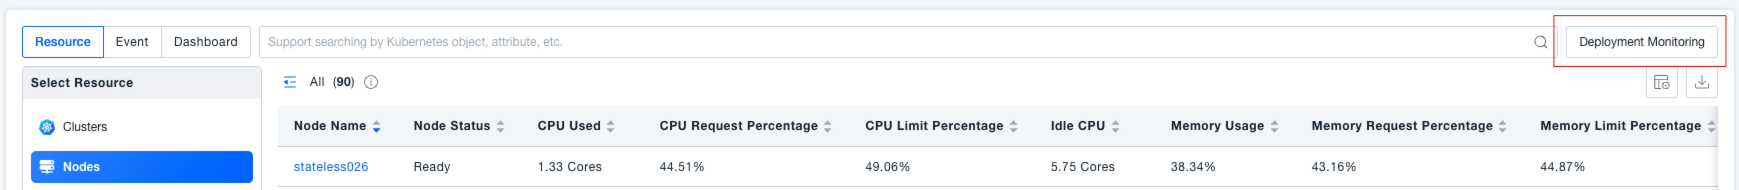
Navigate to the Infrastructure -> Kubernetes page to view all Kubernetes objects.
Installation and Deployment
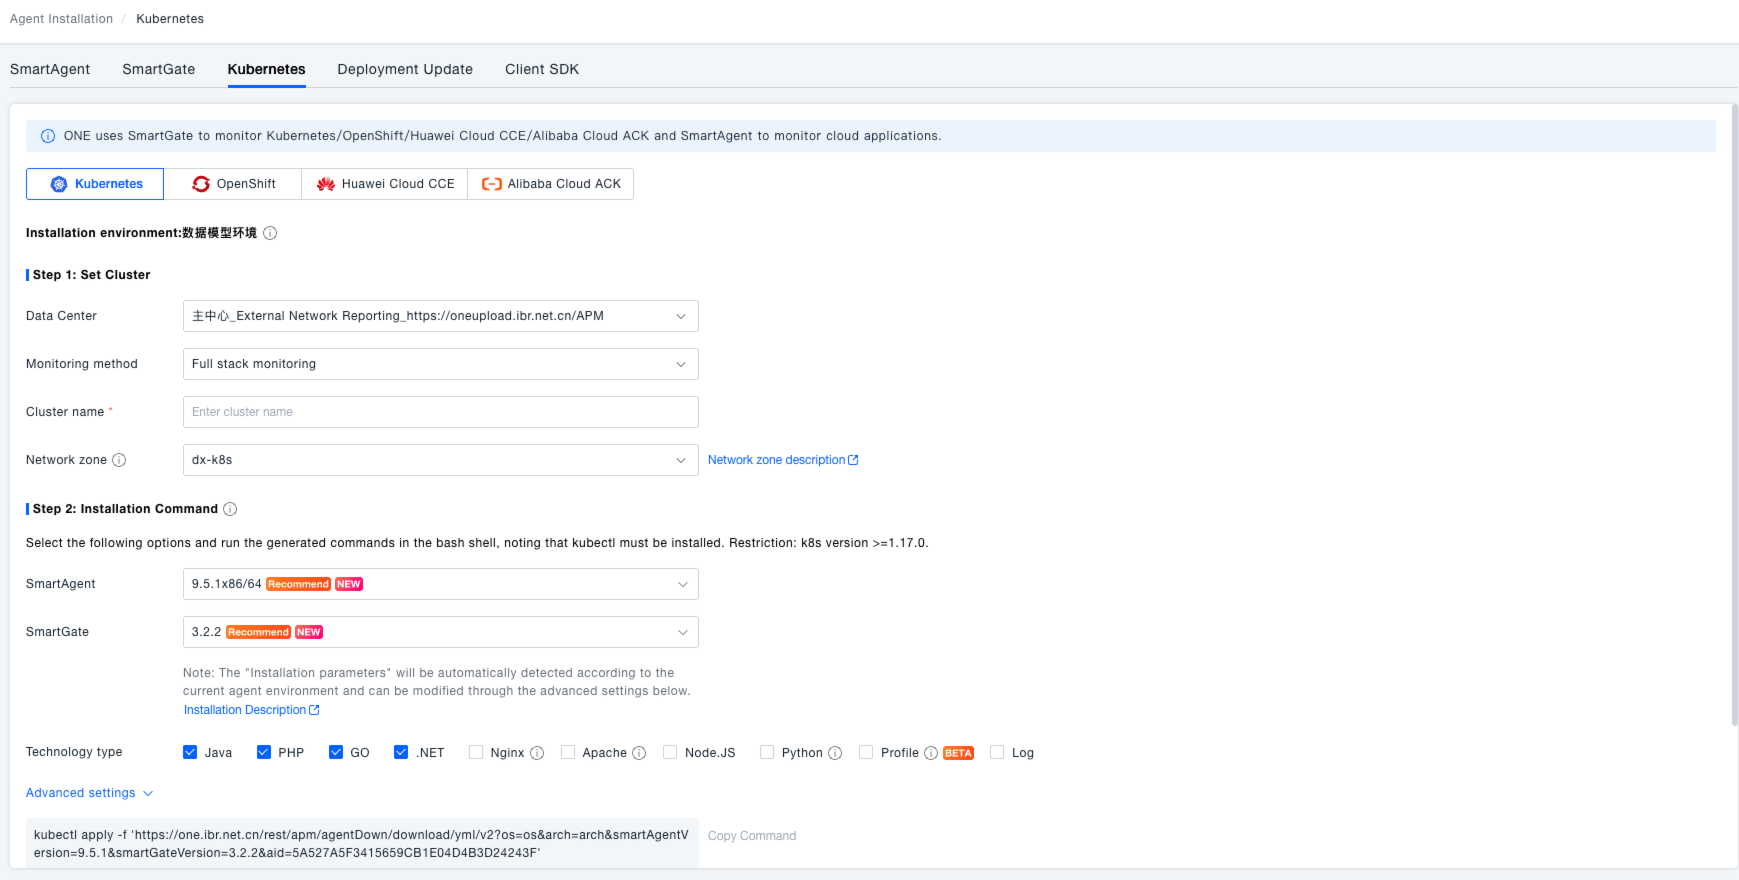
Click the [Deploy Monitoring] button in the platform to access the installation and deployment page.
You can select different container platforms (such as Kubernetes, OpenShift, Huawei Cloud CCE, Alibaba Cloud ACK), configure cluster-related information including monitoring mode (e.g., Full-Stack Monitoring), cluster name, network region, etc., and also select technology types (Java, .NET, Nginx, Logs, etc.).
Subsequently, run the generated installation command in a bash shell (ensure kubectl is installed and Kubernetes version is ≥1.9) to add the Kubernetes cluster requiring monitoring, easily completing the monitoring configuration.
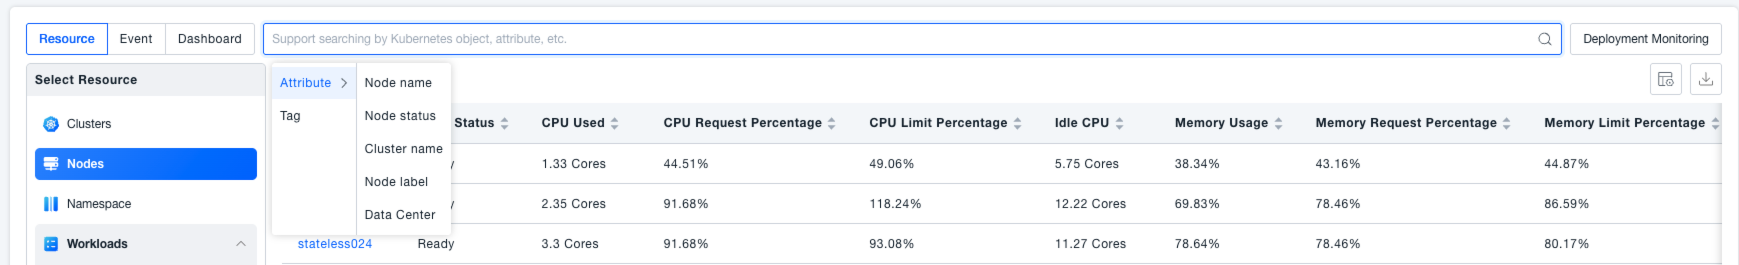
Search functionality
You can filter Kubernetes objects by selecting different Kubernetes attributes (such as cluster name, namespace, Pod labels, etc.) to quickly view the Kubernetes objects of interest.
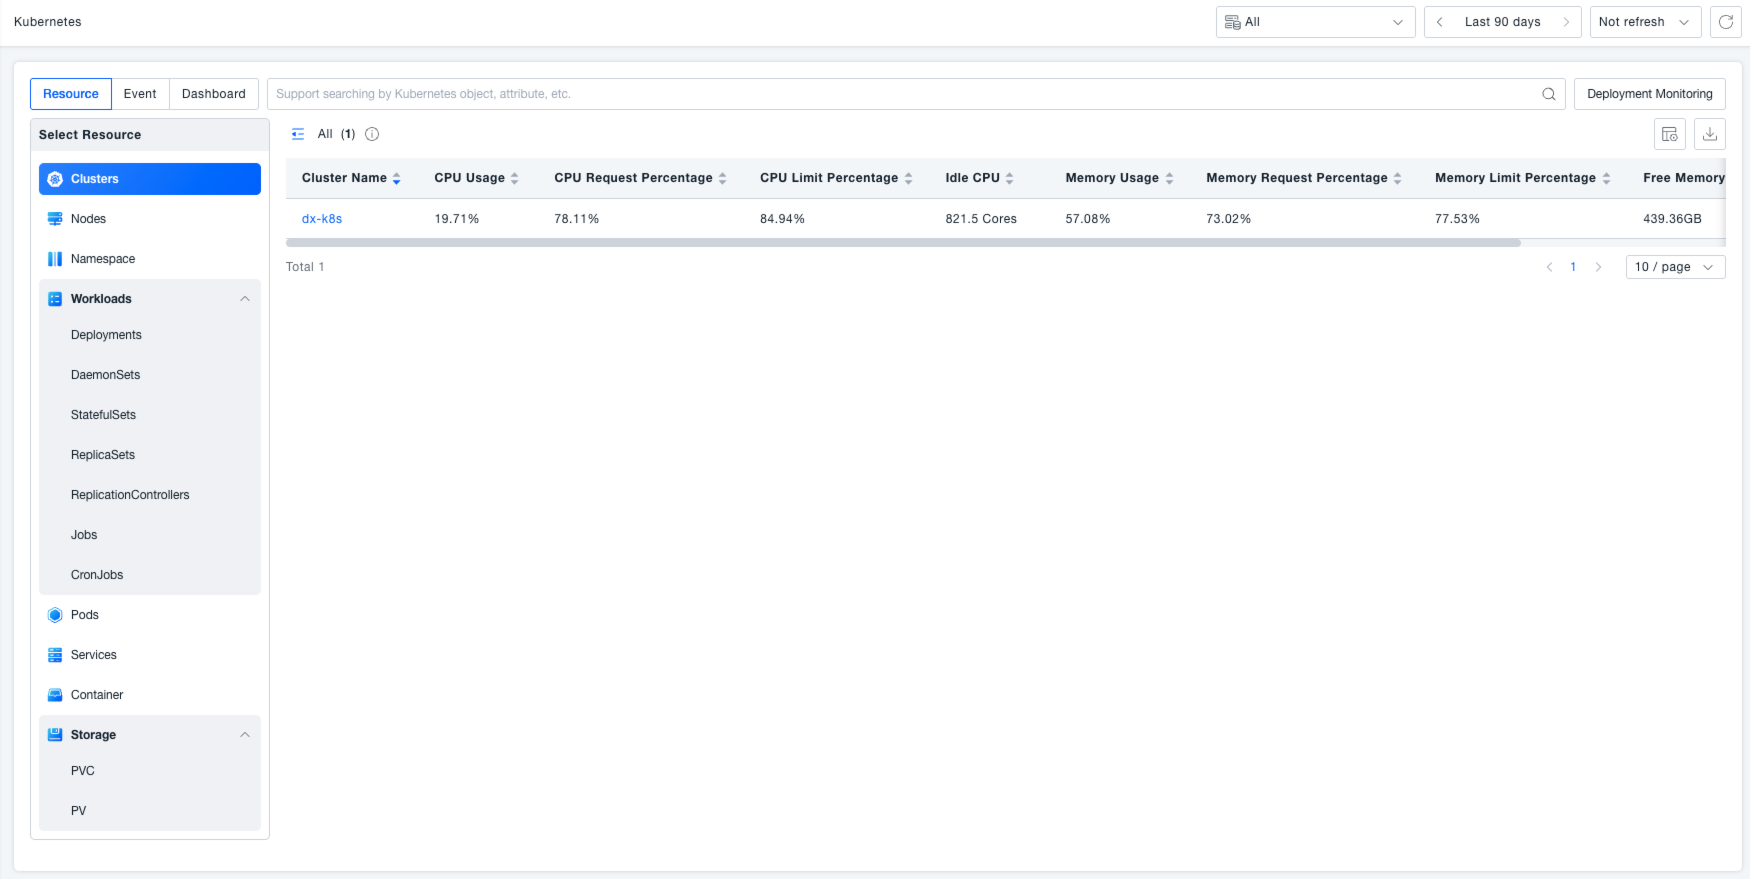
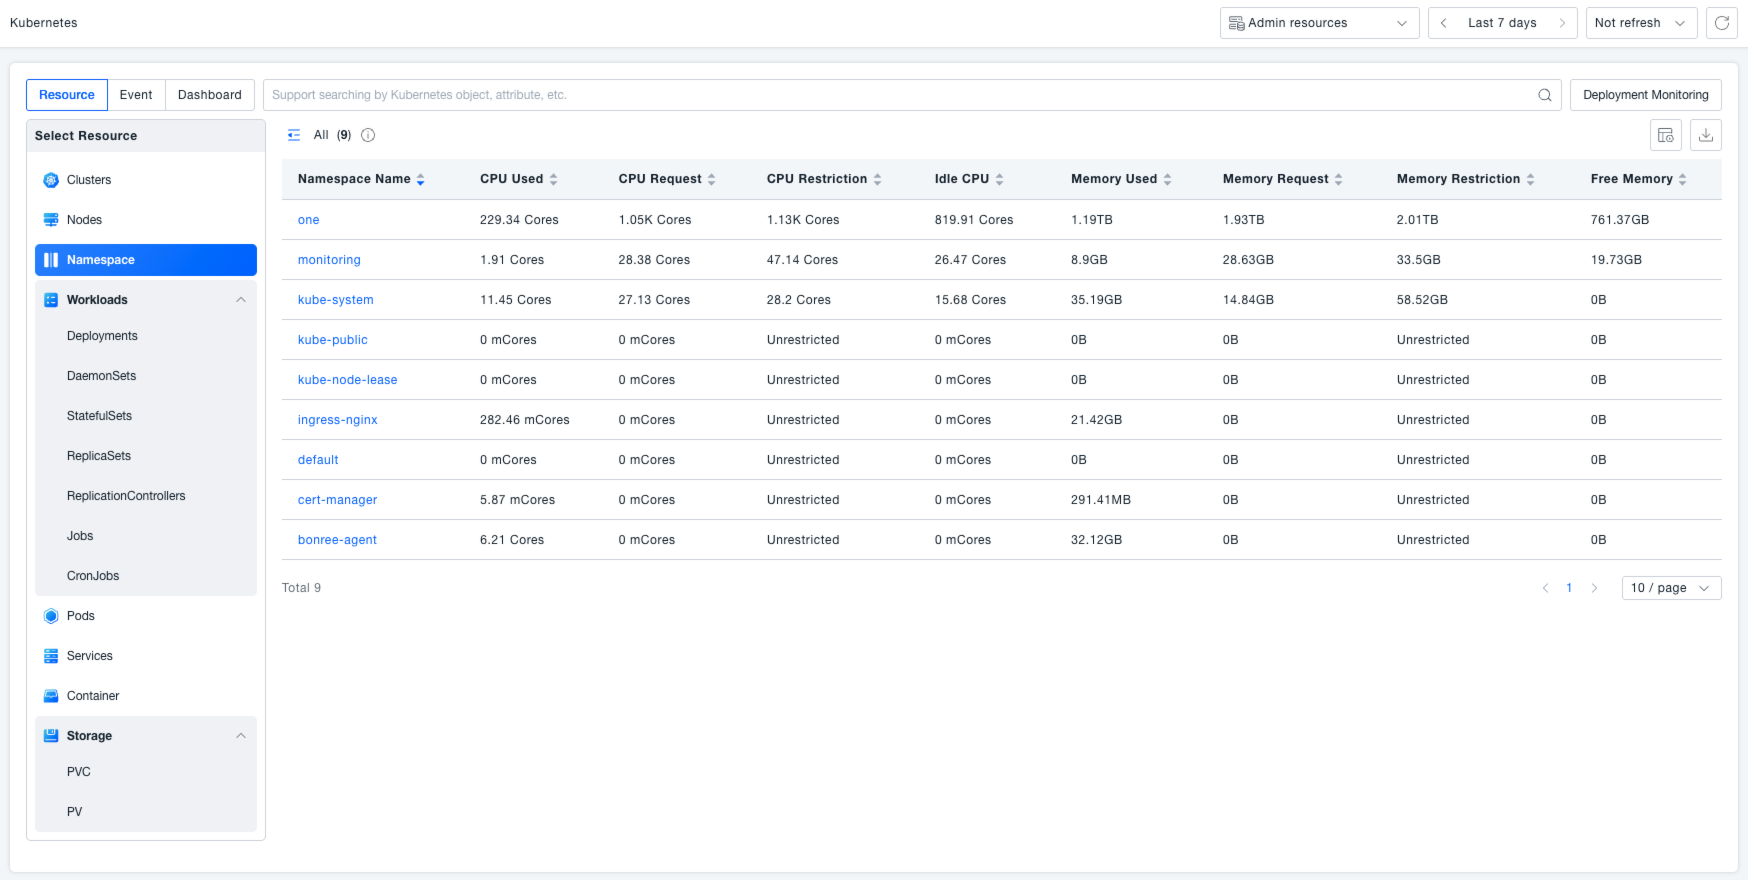
Kubernetes Object List
Object Type Display: The left side of the page lists the monitored Kubernetes object types and their counts, covering Kubernetes clusters, Nodes, namespaces, workloads (including Deployments, DaemonSets, StatefulSets, ReplicaSets, ReplicationControllers, Jobs, CronJobs, etc.), pods, services, Containers, Storage (including PVCs, PVs), and more.
Viewing Object Lists:
After selecting a Kubernetes object of interest on the left, the page's right side displays the list of selected objects. For example:
- Selecting Clusters displays the cluster name, Node count, Namespace count, Workload count, Pod count, Service count, and various CPU-related metrics (usage, usage %, request, request %, limit, limit %).
- Selecting Namespace displays the namespace name, CPU request, CPU limit, memory usage, memory request, memory limit, labels, CPU usage, Pod count, and other metrics. You can also select the object attributes and metrics to focus on via the customizable headers.
Kubernetes Object Details
Click on a row in the object list to navigate to the details page for that Kubernetes object:
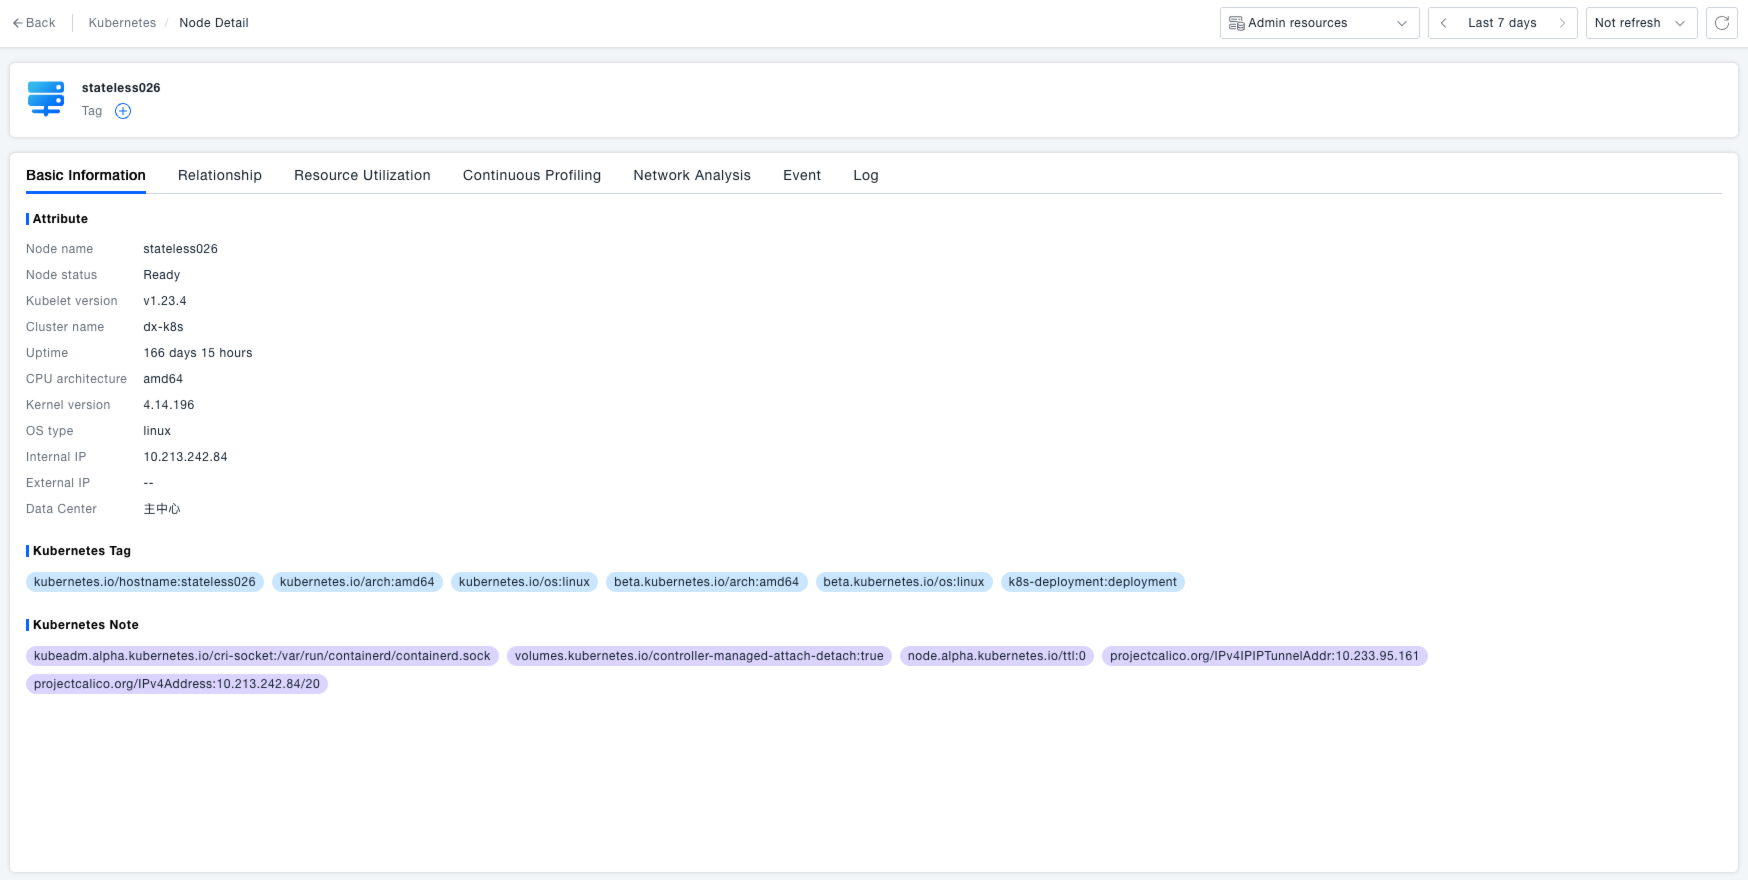
Basic Information: View detailed information about the object, encompassing the object's status, such as runtime status (Running, Bound, etc.); Kubernetes labels, which can be used to identify and categorize objects for easier resource management and filtering; and Kubernetes annotations, which add additional metadata to objects, aiding in a more detailed understanding and management of Kubernetes objects.
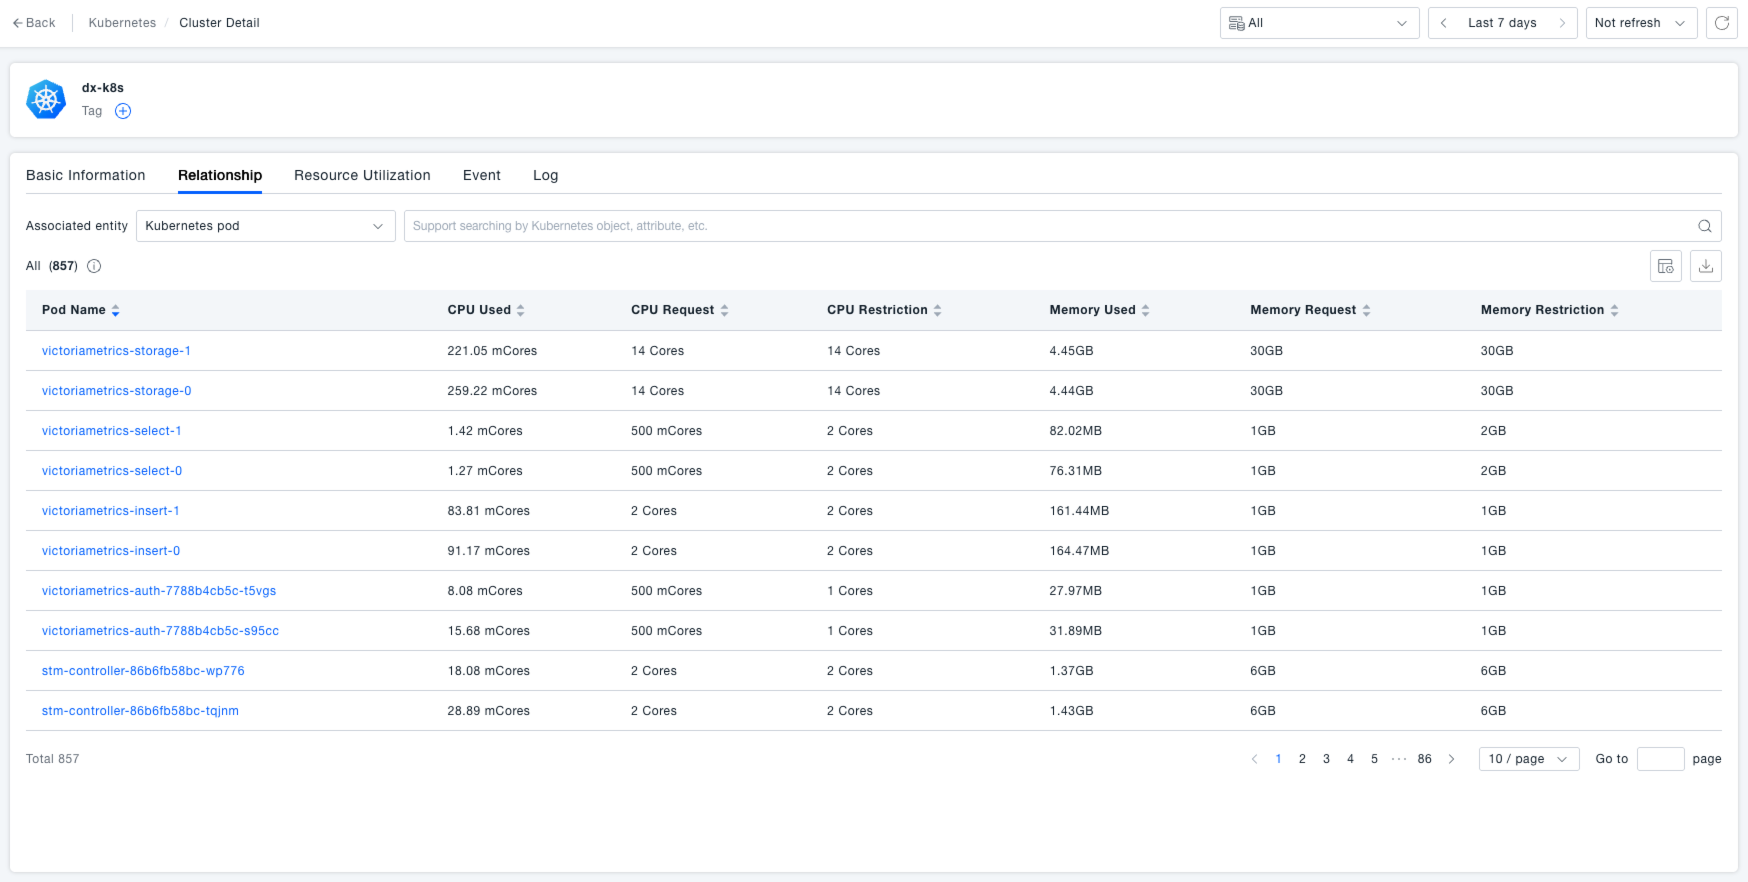
Relations: Supports viewing lists related to the Kubernetes object. For instance, view the related Pod list containing Pod name, CPU usage, CPU request, CPU limit, memory usage, memory request, memory limit, container count, Workload name, Namespace name, Cluster name, Pod status, and other information, providing a clear understanding of object relationships.
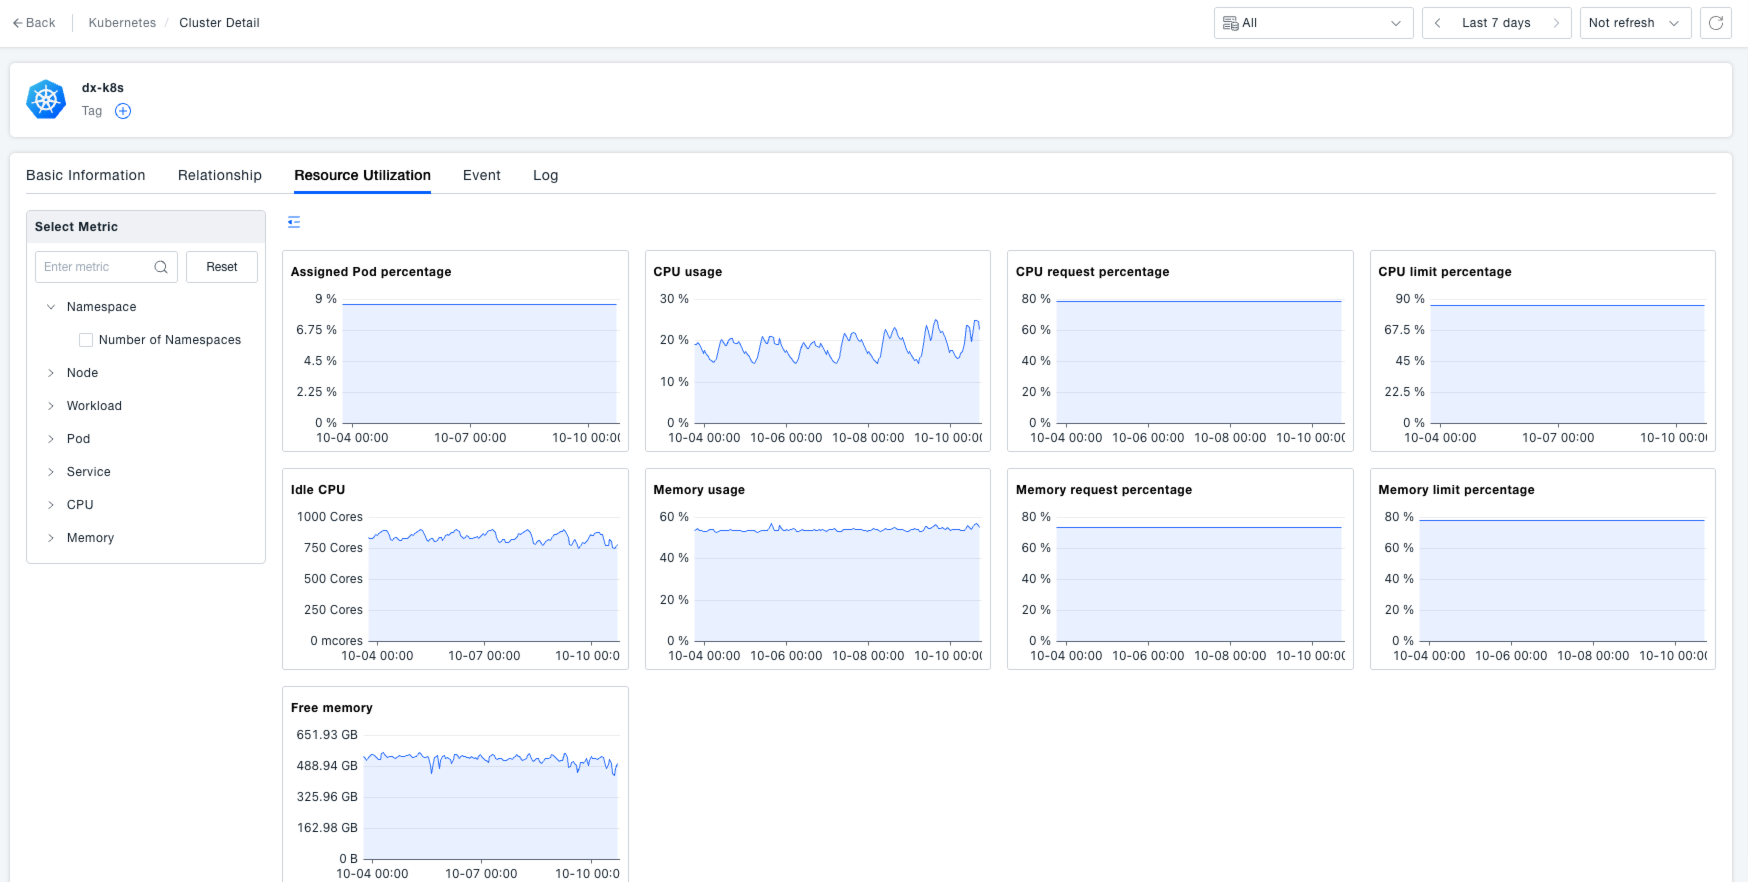
Resource Utilization: View key metrics for the Kubernetes object to grasp the dynamic changes in its resources. Taking CPU-related metrics as an example, you can view trends over time for CPU allocatable total, CPU limit percentage, CPU limit, CPU request percentage, CPU request, CPU idle, CPU usage, CPU usage percentage, while also monitoring changes in metrics like Namespace count, Node count, Pod allocatable total, Pod count, Service count, Workload count, memory allocatable total, etc.
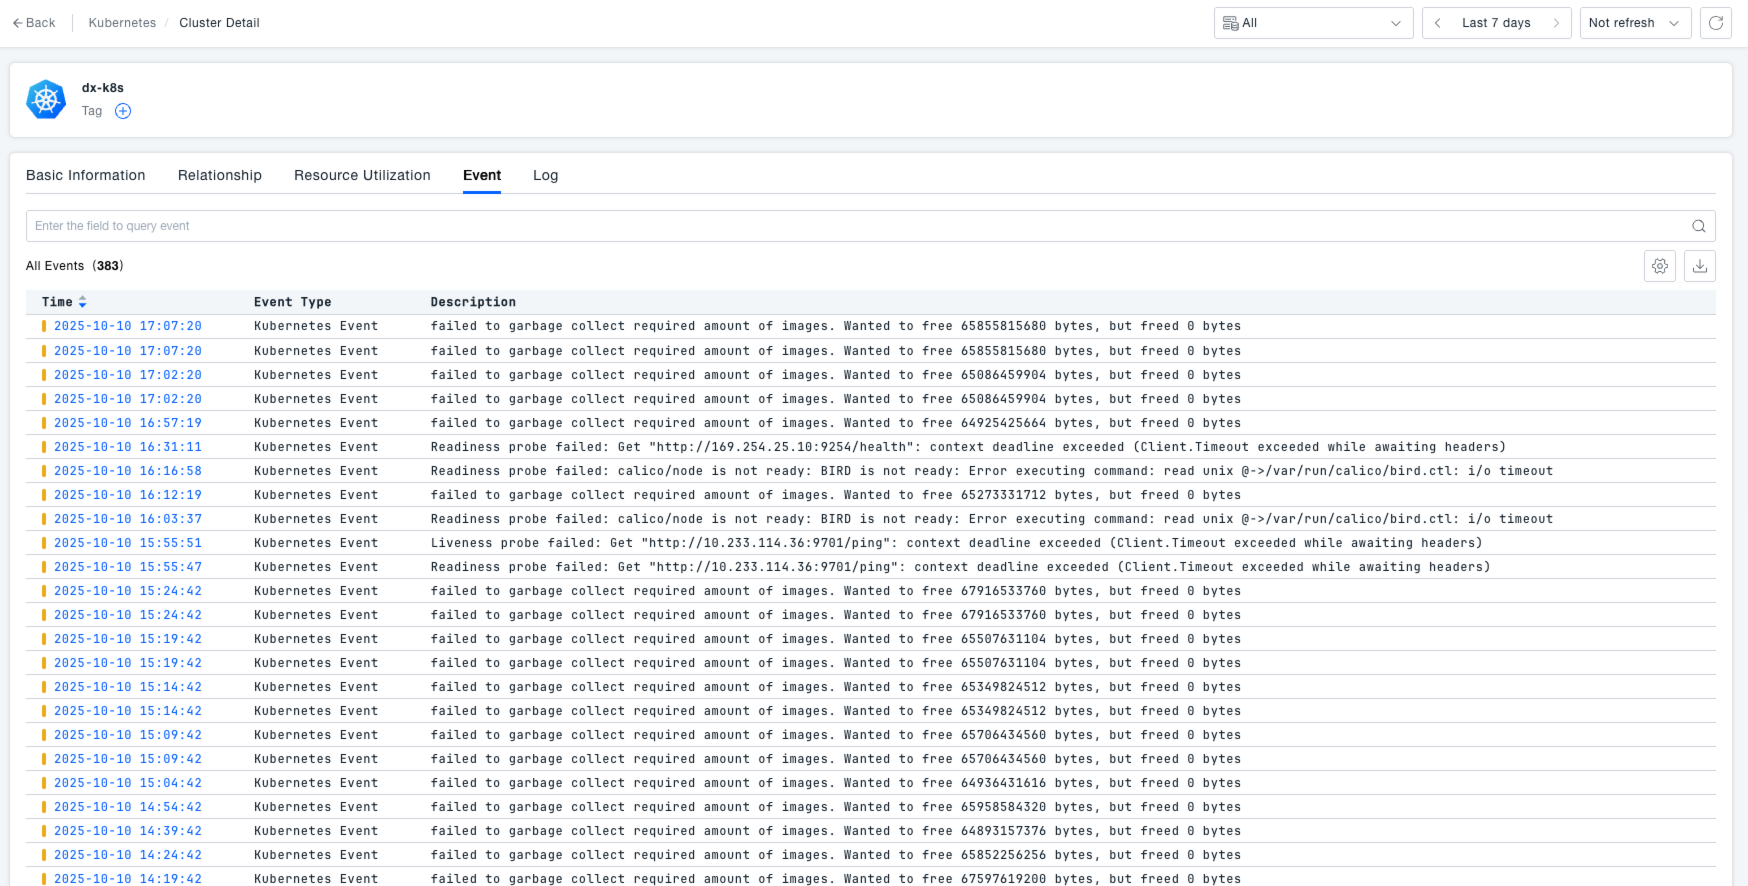
Events: View Kubernetes events that have occurred for the object, aiding in the diagnosis, tracking, and pinpointing of issues. The event list displays the event's time, type, and description, for example, "Created job superfa - cronjob - 1731304800", "0/1 nodes are available: 1 Too many pods.", facilitating an understanding of event occurrences within the cluster.
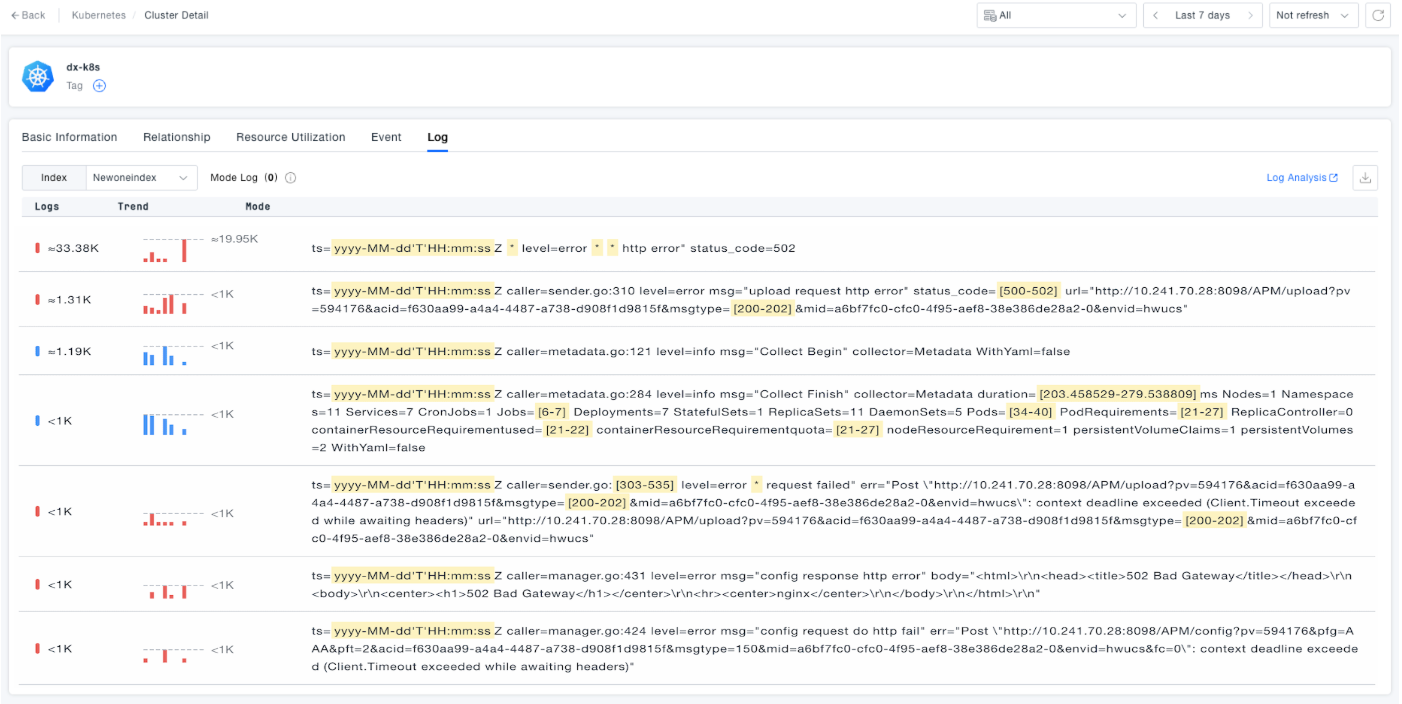
Logs: View logs generated by the Kubernetes object, assisting in the diagnosis, tracking, and pinpointing of issues. Log content includes timestamps, log levels, error messages, request URLs, etc., such as "upload request http error", "config response http error", allowing analysis of application runtime status and error information from the logs.
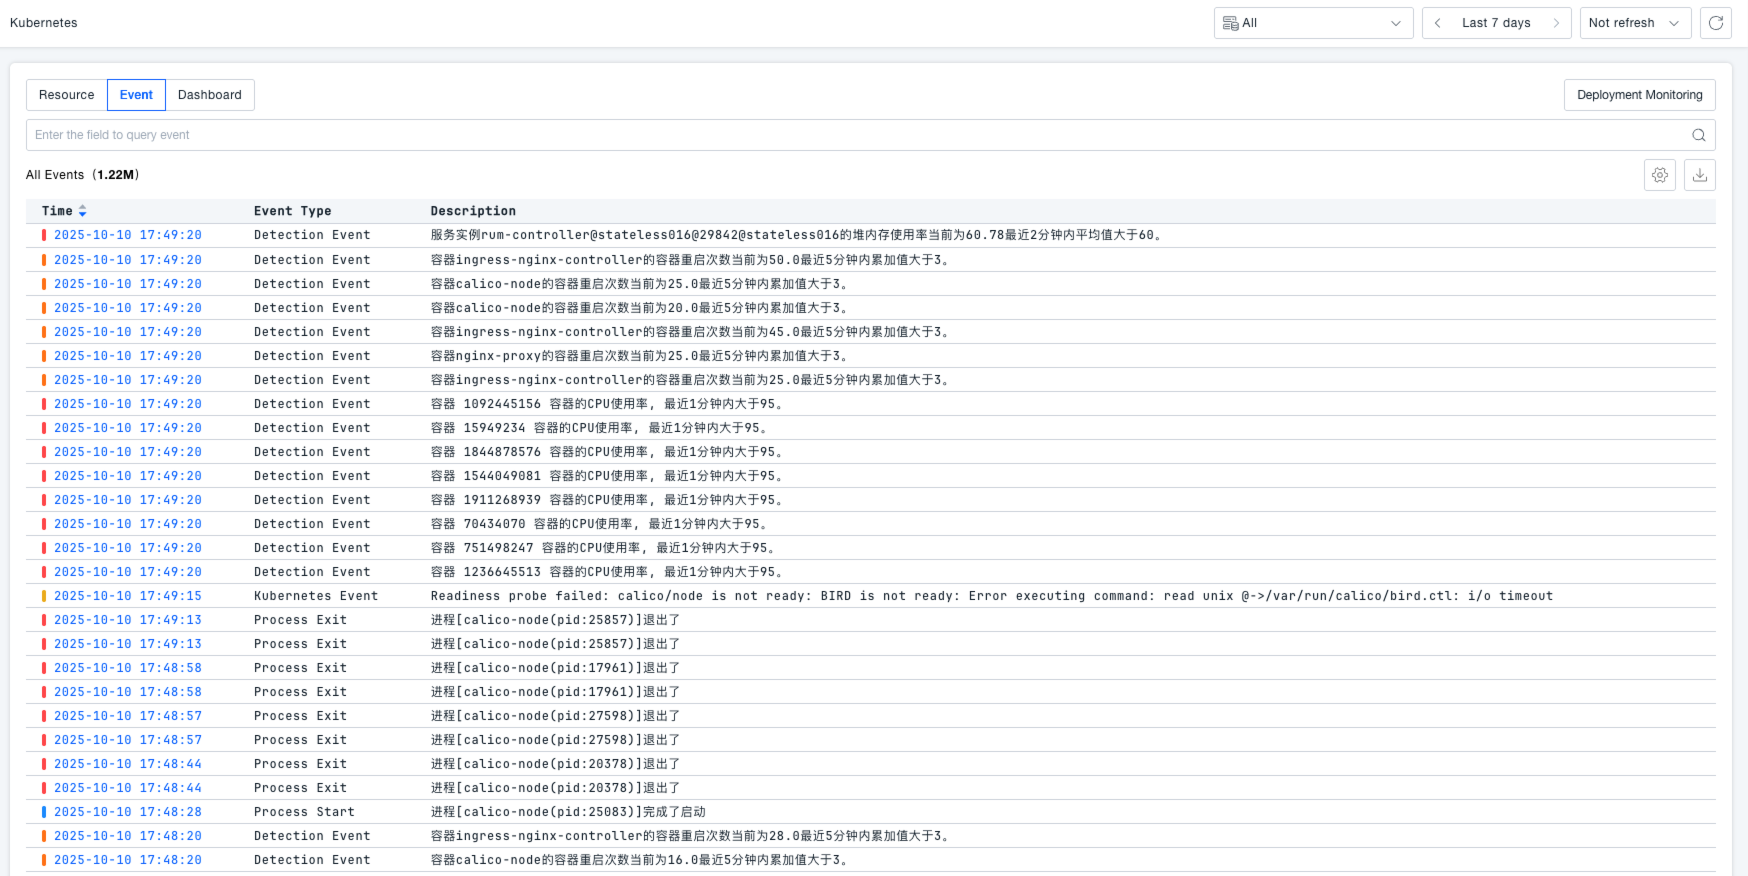
Kubernetes Events
On the Events tab page, you can view Kubernetes events, gaining a comprehensive overview of the occurrence time, type, and description of various events within the cluster. The event list is clearly displayed, facilitating user operations like troubleshooting.
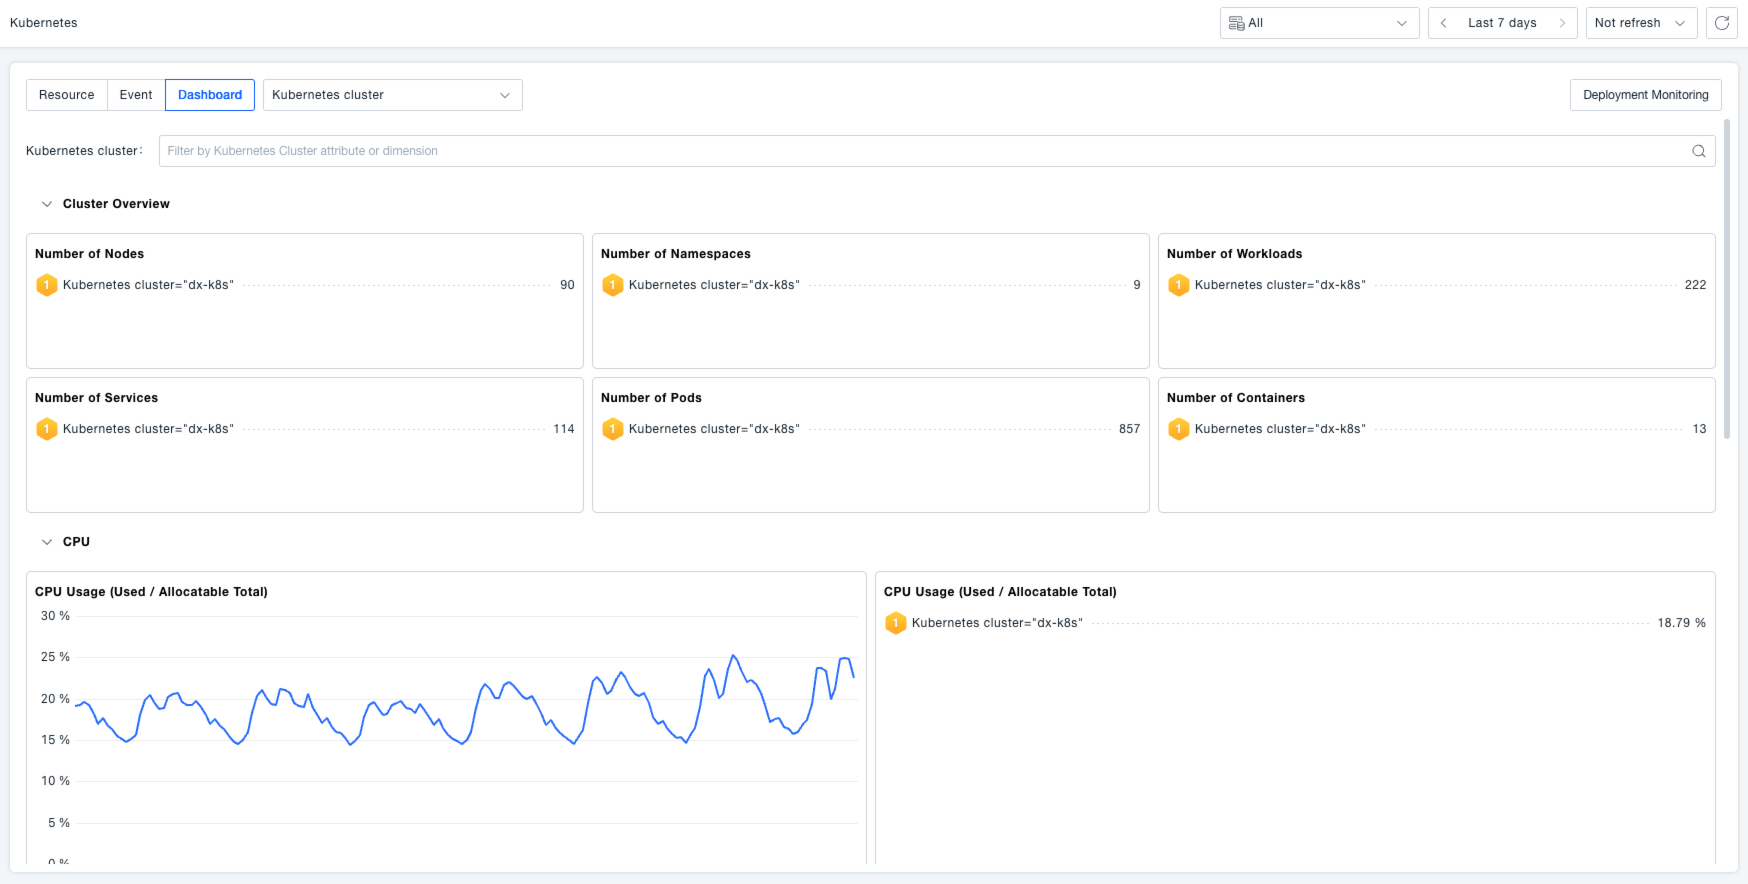
Kubernetes Dashboards
Supports viewing out-of-the-box Kubernetes dashboards that intuitively display resource usage such as Node counts per Kubernetes cluster, Pod counts per Node or cluster, container counts, CPU usage / CPU allocatable, Top 10 CPU usage / CPU allocatable, etc., making it easy for users to get an overview of the cluster's overall status.