Grafana Deployment
For users accustomed to using Grafana, the ONE platform also supports deploying an external Grafana instance, allowing users to migrate their commonly used historical dashboards to the ONE platform.
Configuration Modifications
Adding New Configuration in Nacos
Add the following configuration under the <global><private> tags. Replace the URL addresses marked in xxx in the configuration according to the actual situation.
Explanation:
① <property name="url" value="http://xxx"/> The value field is the access address for Grafana.
② <property name="one.datasource.path" value="http://xxx"/> The value field is the access address for the BONREE-ONE datasource.
<private>
   <framework>
     <iam>
       <grafana>
         <property name="enable" value="true" />
         <property name="version" value="v11.4.0" />
         <property name="theme" value="light" />
         <property name="url" value="http://xxx" />
         <property name="api.context.path" value="/gf" />
         <property name="api.user" value="admin" />
         <property name="api.password" value="5080C35C2A831D63C903B0F808A4A090" />
         <property name="default.user.password" value="5080C35C2A831D63C903B0F808A4A090" />
         <property name="auth.header.name" value="BONREE-WEBAUTH-USER" />
         <property name="one.datasource.type" value="bonree-one-datasource" />
         <property name="one.datasource.name" value="BONREE-ONE" />
         <property name="one.datasource.path" value="http://xxx" />
       </grafana>
     </iam>
   </framework>
 </private>
Configuration Explanation:
- enable: Grafana toggle. Default is off.
- version: Grafana version number. Currently supports Grafana API versions 9.1 and above. Considering synchronization performance, it is recommended to use Grafana version 11.3 or higher, provided it is supported by the browser.
- theme: Grafana theme. Can be configured as "dark", "light", or "system". Default is light.
- grafana.url: Grafana service address. If ONE has a context path, it must be appended; if not, it is not required.
- api.context.path: The context path for Grafana requests. Must match the path in the
root_urlconfiguration item on the Grafana side. Default is/gf. - api.user: Grafana super administrator username.
- api.password: Grafana super administrator password. Must be encrypted.
- default.user.password: Default user password automatically synchronized to the Grafana instance.
- auth.header.name: Grafana authentication header parameter name. Must match the
header_nameconfiguration item on the Grafana side. Default isBONREE-WEBAUTH-USER. - one.datasource.enable: Whether to automatically create the ONE datasource. Default is
false. - one.datasource.type: ONE datasource type. Default is
bonree-one-datasource. - one.datasource.name: ONE datasource name. Default is
BONREE-ONE. - one.datasource.path: ONE datasource request address. This is the external access address for ONE.
- prometheus.datasource.type: Prometheus datasource type. Default is
prometheus. - prometheus.datasource.name: Prometheus datasource name. Default is
prometheus. - prometheus.datasource.path: Prometheus datasource request address. This is the external access address for ONE +
/promds.
Grafana Configuration Modifications
Modify the default configuration in the Grafana directory: xxxx/grafana/conf/defaults.ini (refer to your own installation path). Search for the keys in the configuration file and replace them with the corresponding values.
[auth.proxy]
# Enable auth.proxy login method
enabled = true
# The authentication key name recognized by Grafana in the request header, e.g., BONREE-WEBAUTH-USER=bonree_test
header_name = BONREE-WEBAUTH-USER
# Request header authentication property, can be "username" or "email"
header_property = username
# Disable automatic sign-up
auto_sign_up = false
# Enable 'header encoded' for quoted-printable encoding, resolving 401 errors for usernames with non-ASCII characters.
headers_encoded = true
# Modify the access context path by adding /gf for ONE platform filtering and identification. The /gf below must match the configuration in the ONE server configuration file.
root_url = %(protocol)s://%(domain)s:%(http_port)s/gf
# Enable access to Grafana via sub-path
serve_from_sub_path = true
# Disable WebSocket connections for Grafana Live
max_connections = 0
# Toggle for embedding Grafana in an iframe
allow_embedding = true
Note: After modifying the configuration, restart the Grafana service for the changes to take effect.
Nginx Configuration Modifications
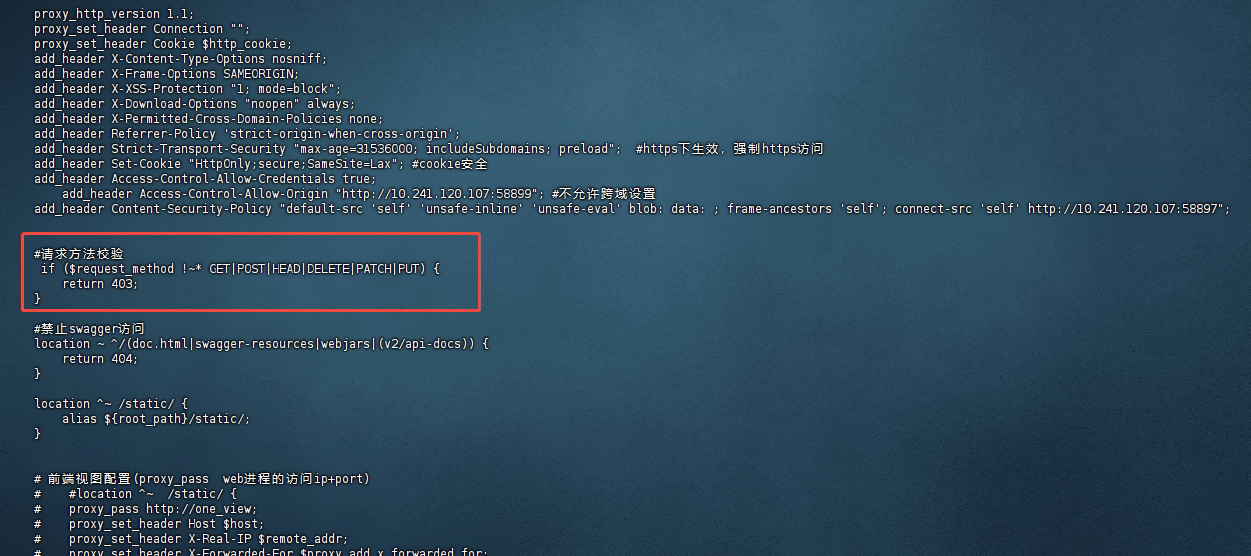
Edit the Nginx configuration file to add the "Request Method Validation" configuration. If it already exists, ensure it matches the example.
# Request Method Validation
if ($request_method !~* GET|POST|HEAD|DELETE|PATCH|PUT) {
    return 403;
}
location ~ ^/(gf|promds) {
    proxy_pass http://one_analysis;
    proxy_set_header Host $host;
    proxy_set_header X-Real-IP $remote_addr;
    proxy_set_header X-Forwarded-For $proxy_add_x_forwarded_for;
    proxy_set_header X-Forwarded-Host $http_host;
    proxy_set_header X-Forwarded-Port $server_port;
    proxy_set_header X-Forwarded-Proto $scheme;
}
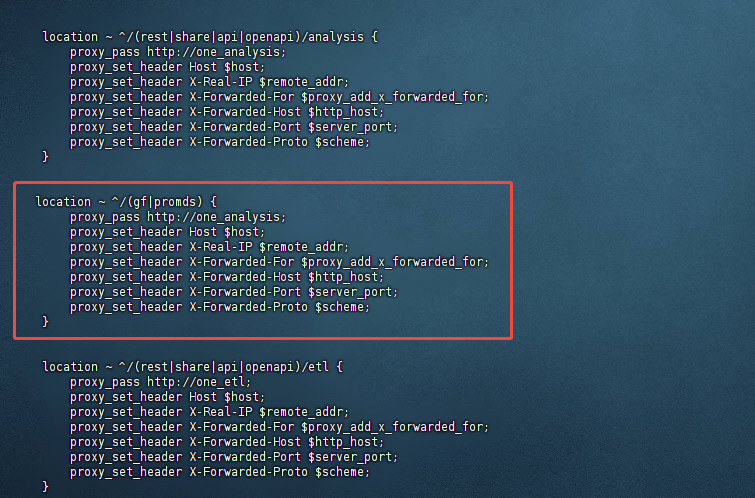
Note: After modifying the Nginx configuration, run nginx -s reload for the changes to take effect.
Prometheus Datasource Configuration
After completing the above configuration modifications, users will be able to see the external dashboards in the UI. Subsequently, configure the Prometheus datasource.
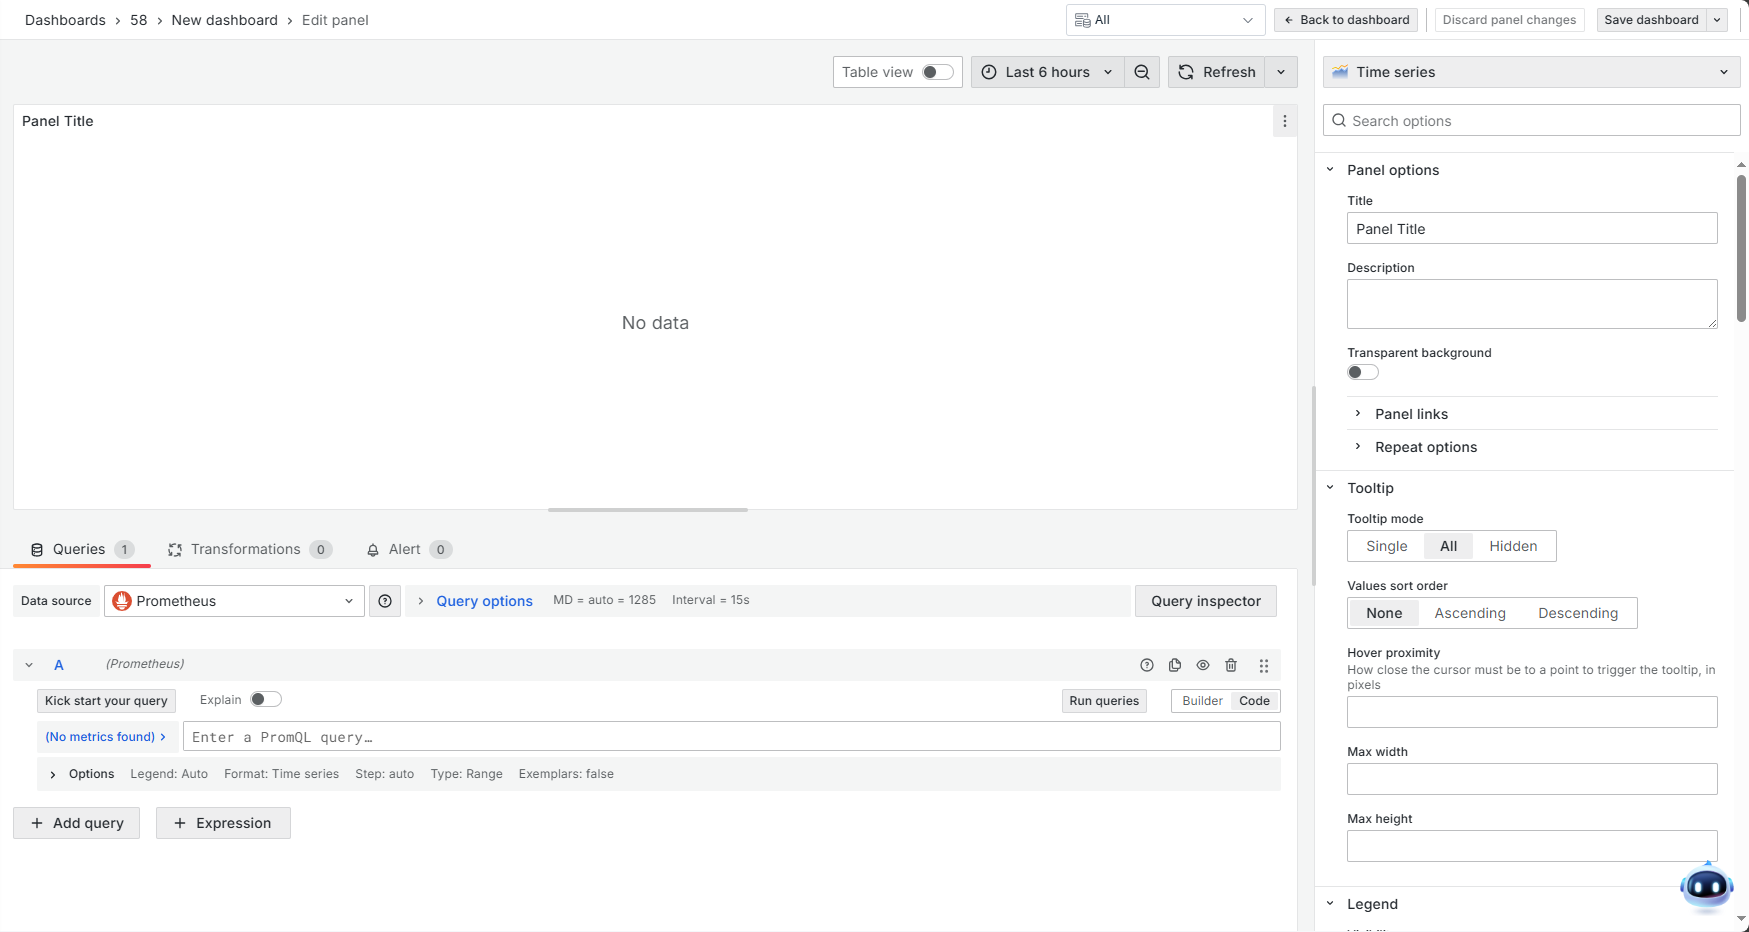
Step 1: Click on the "External Dashboards" menu, create a dashboard, and add a card. Then, click the button shown in the page image to open the advanced datasource selector.
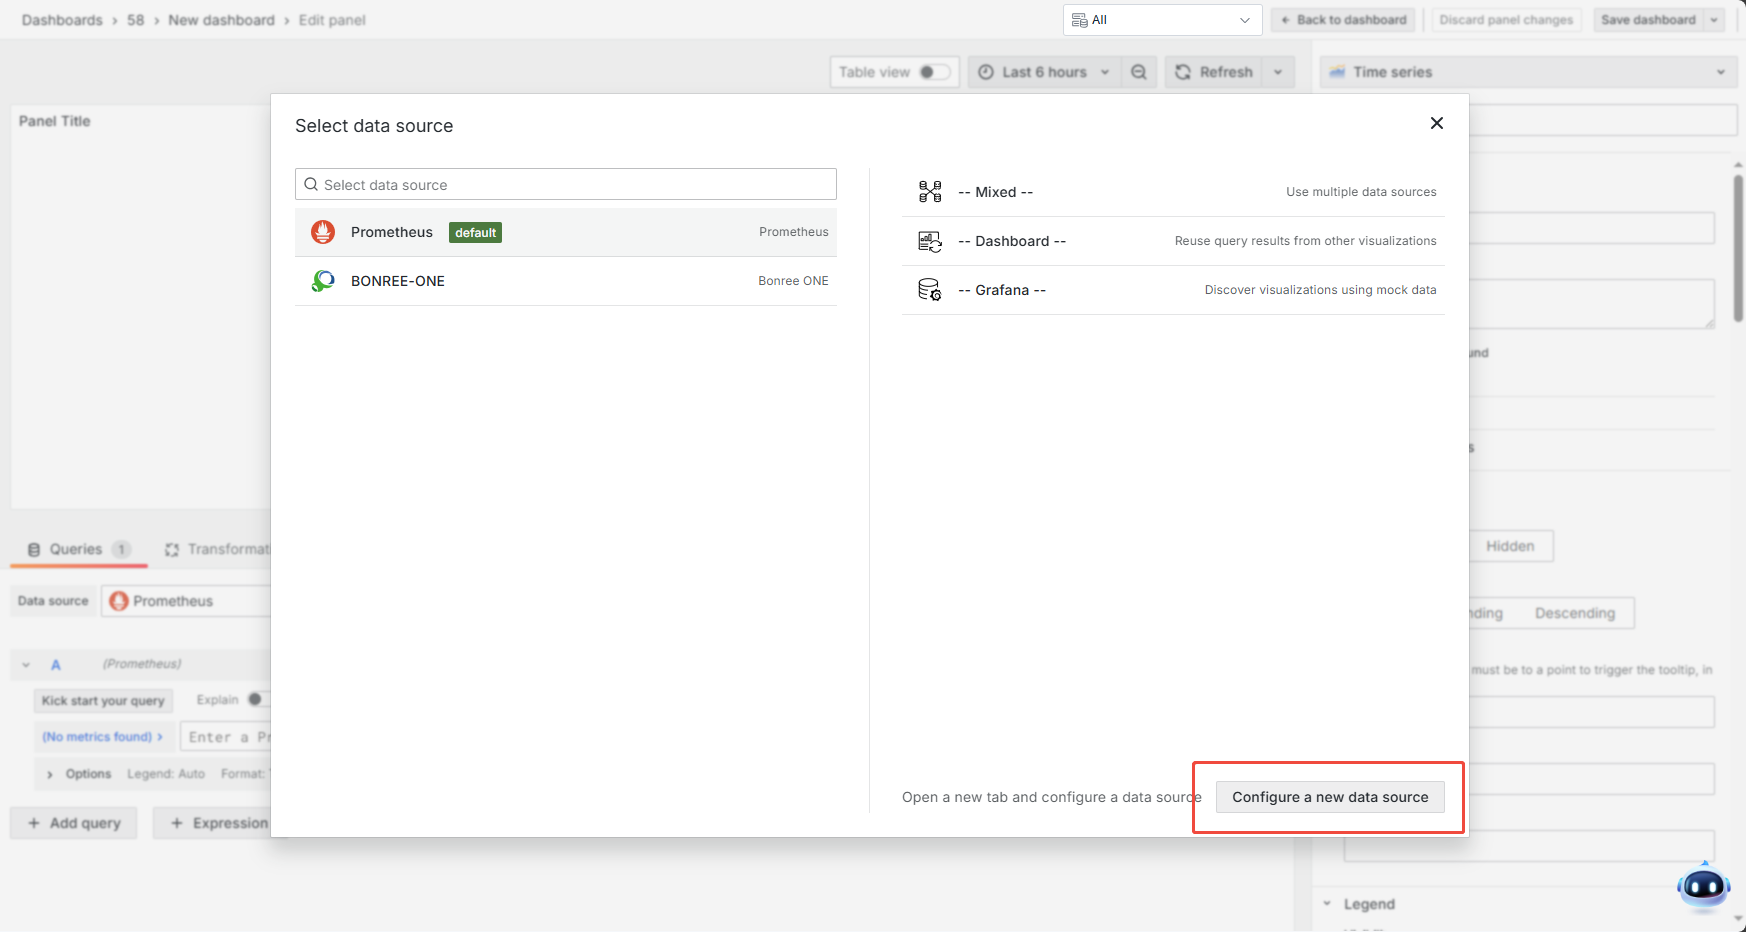
Step 2: Click "Configure a new data source", then select "Prometheus".
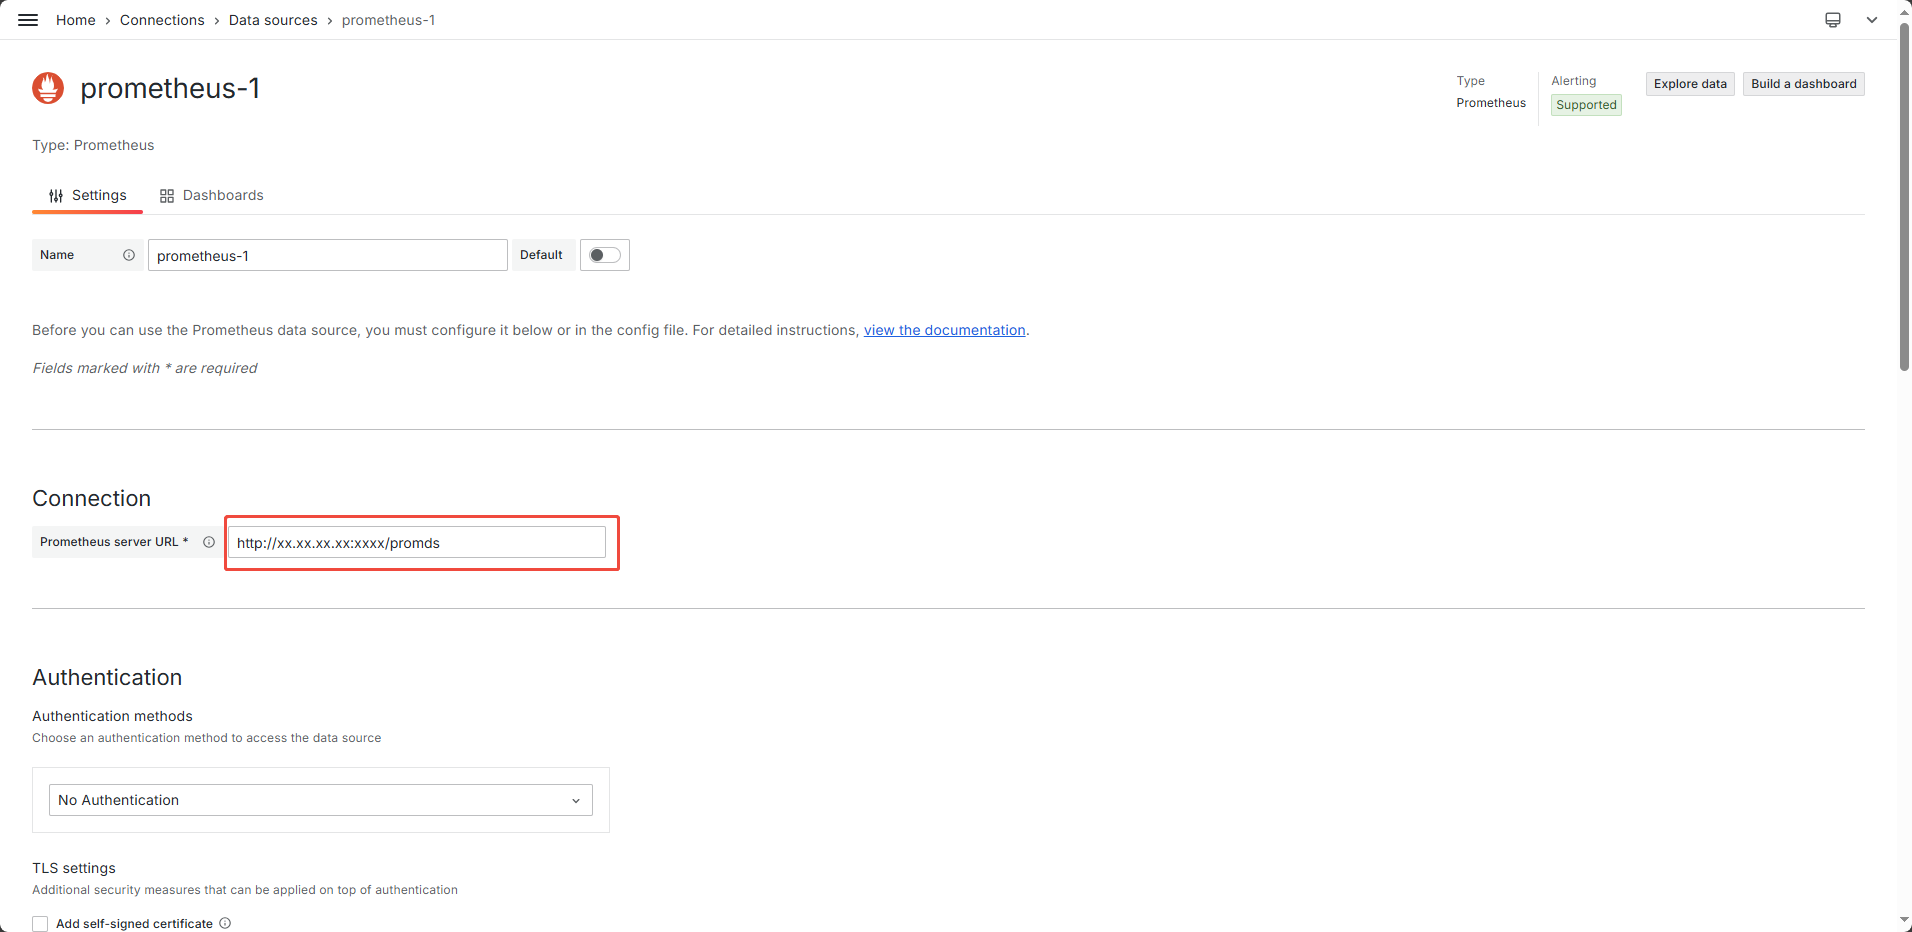
Step 3: Set the URL address. Replace the XX part marked in red in the image with the ONE web access address + /promds.
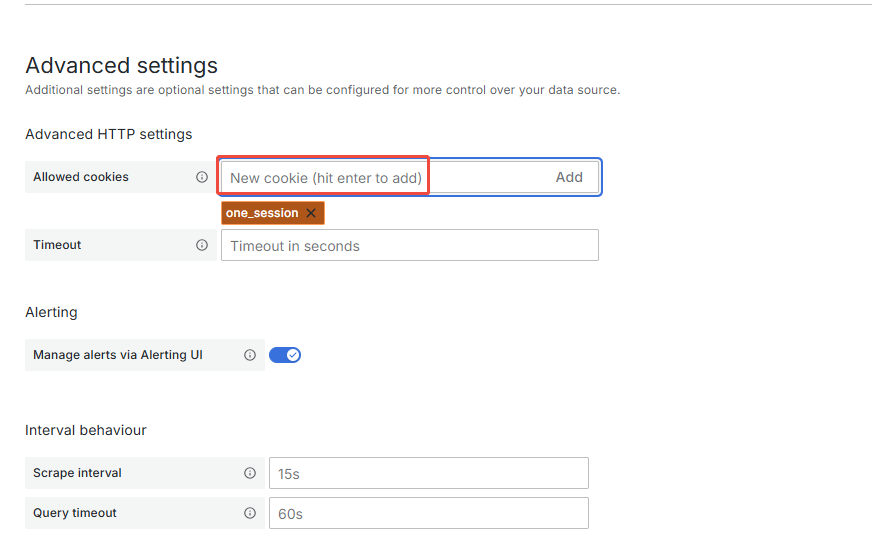
Step 4: In the field marked in red in the image, enter one_session and then click "Add".
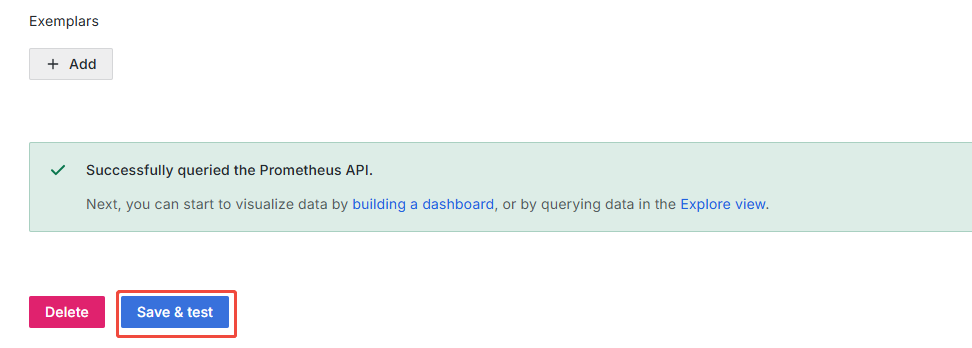
Step 5: Click the button shown in the image, and a "success" prompt should appear.
Note: The location for adding a datasource may vary depending on the Grafana version.
Version Information
Version Differences
- Currently supports Grafana API versions 9.1 and above.
- Version v11.3 and above includes the batch update team members API (
/api/teams/1/members), which is not available in versions v9.1 to v11.3 (exclusive). - For version v11.3 and above, login usernames are case-insensitive and are converted to lowercase for storage. For versions v9.1 to v11.3 (exclusive), they are case-sensitive.
- Version 9.1.0 custom ONE datasource does not support expressions.
- Version 9.1.0 does not support language switching.