Manual Editing
Once Grafana is embedded into the ONE platform, it is ready to use and supports manually adding dashboards. This document describes how to use the External Dashboards module to build dashboards. For detailed feature descriptions, please refer to Dashboards | Grafana documentation.
Create a New Dashboard
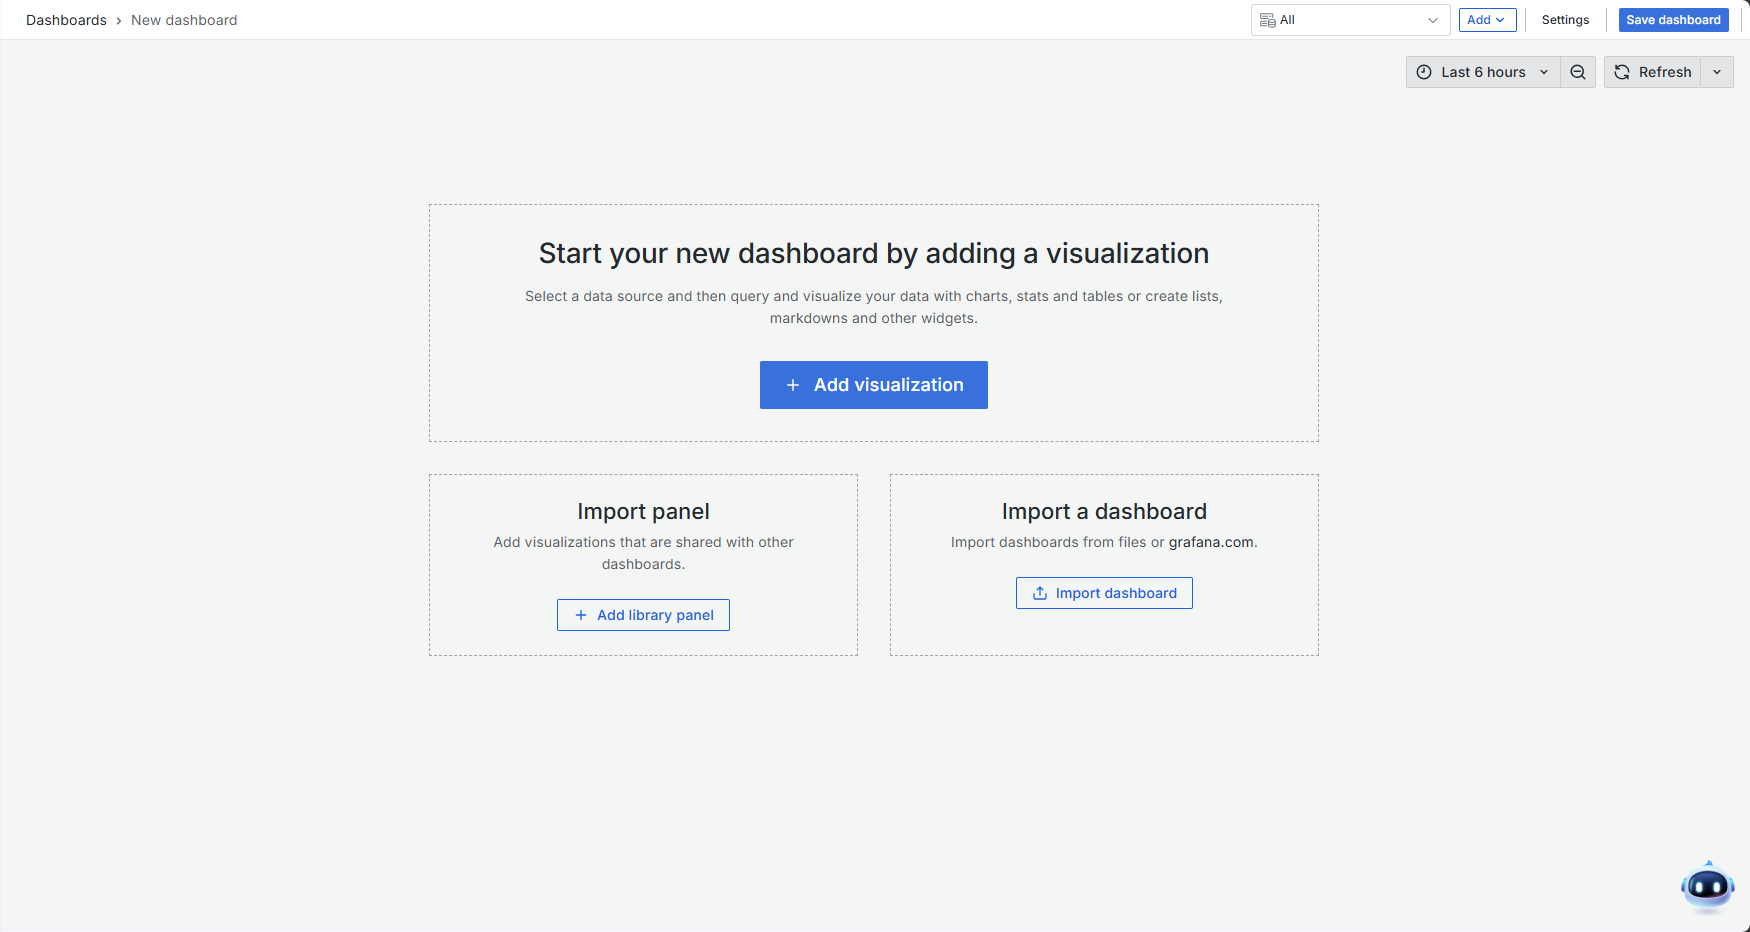
Upon entering the External Dashboards module, the dashboard list is displayed by default. Click the New button to add a folder or a dashboard. After creating a new dashboard, you will enter the configuration page.
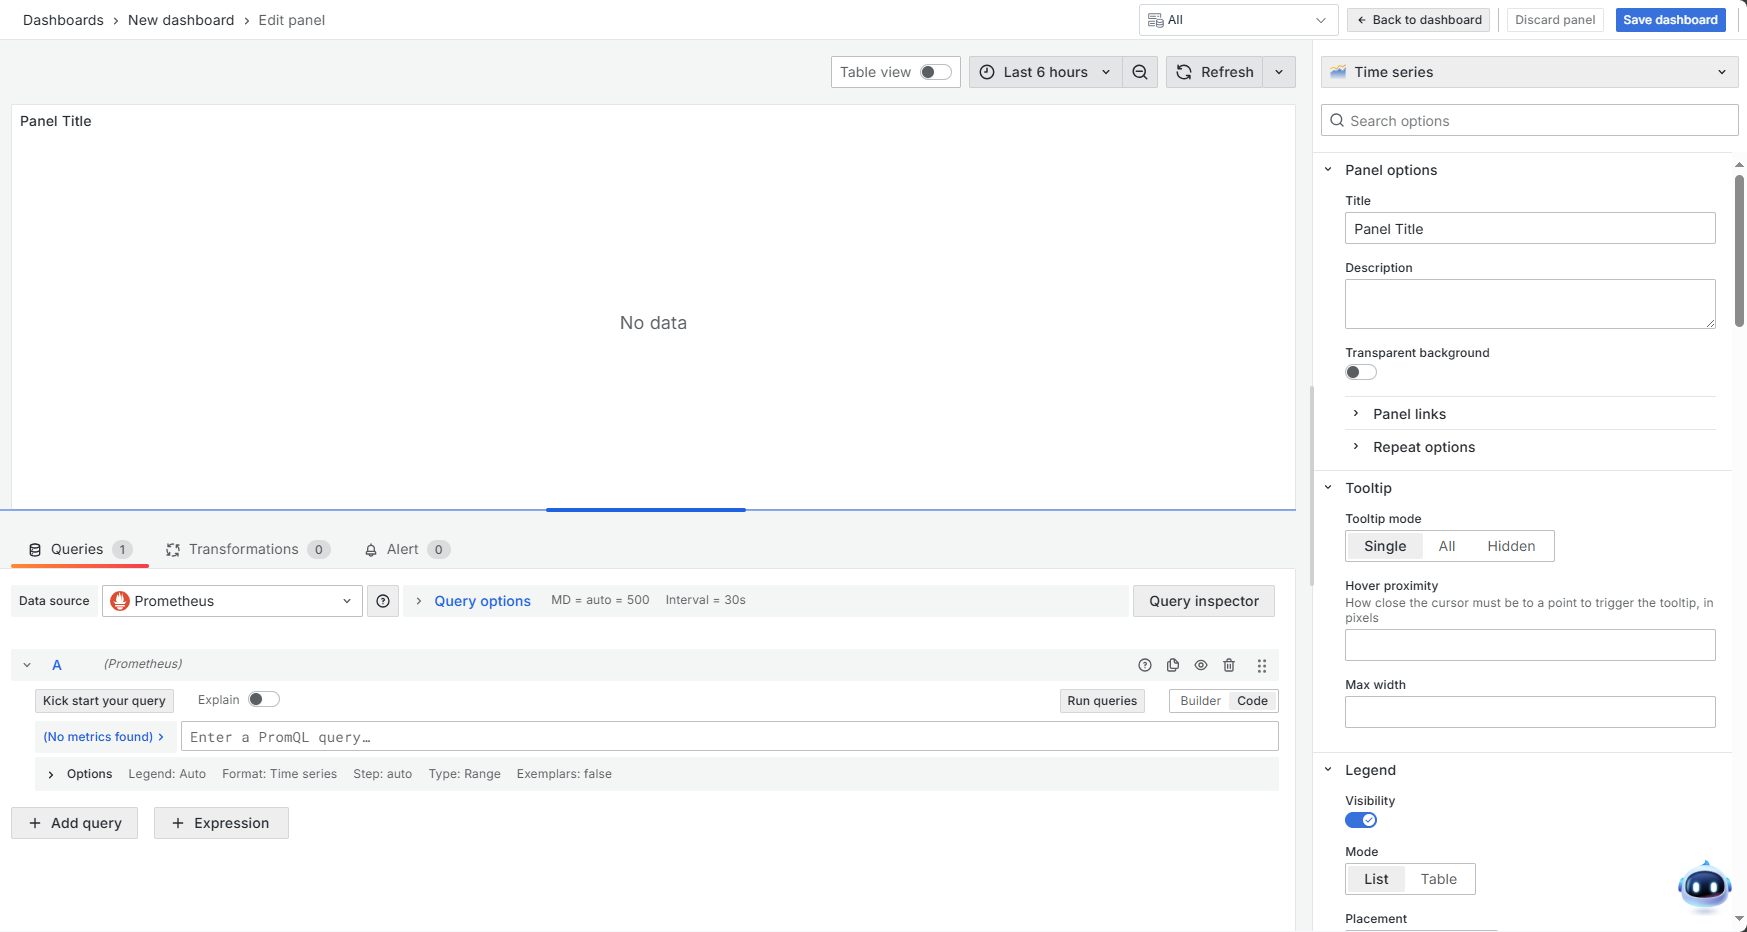
Select a data source, choose an appropriate panel type, and use PromQL queries to retrieve data.
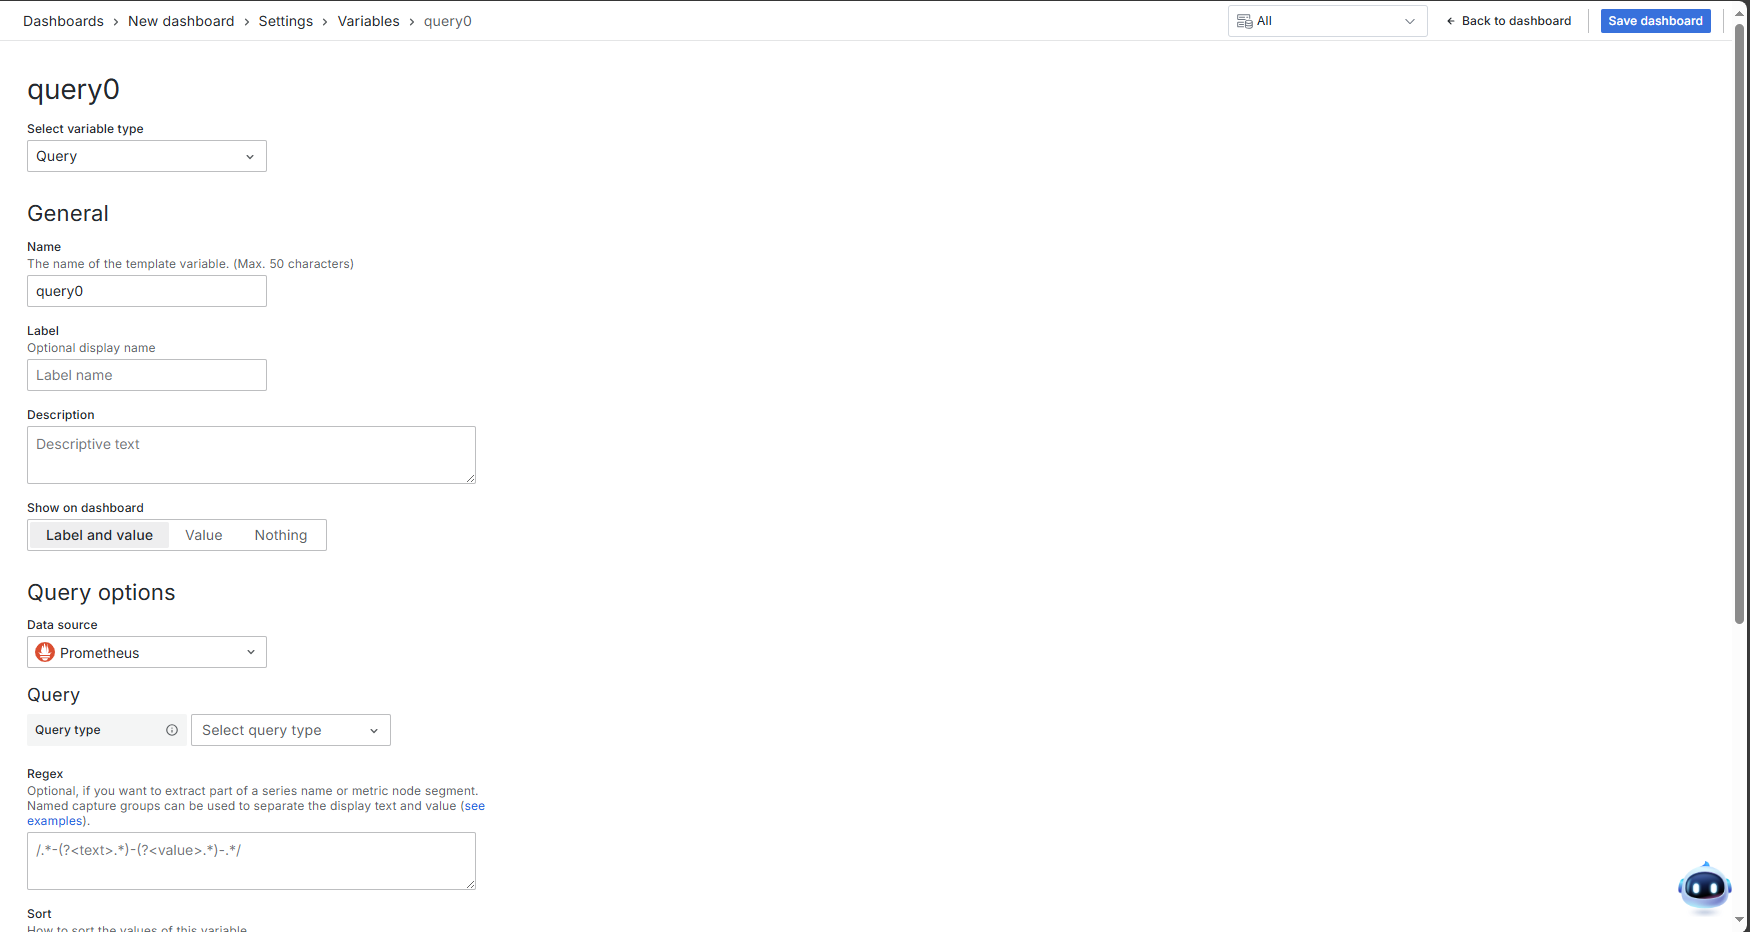
Common variables for Grafana dashboards can be added in Settings > Variables.
The actual feature interface is subject to the embedded Grafana instance, as different versions may have functional differences.
Import a Dashboard
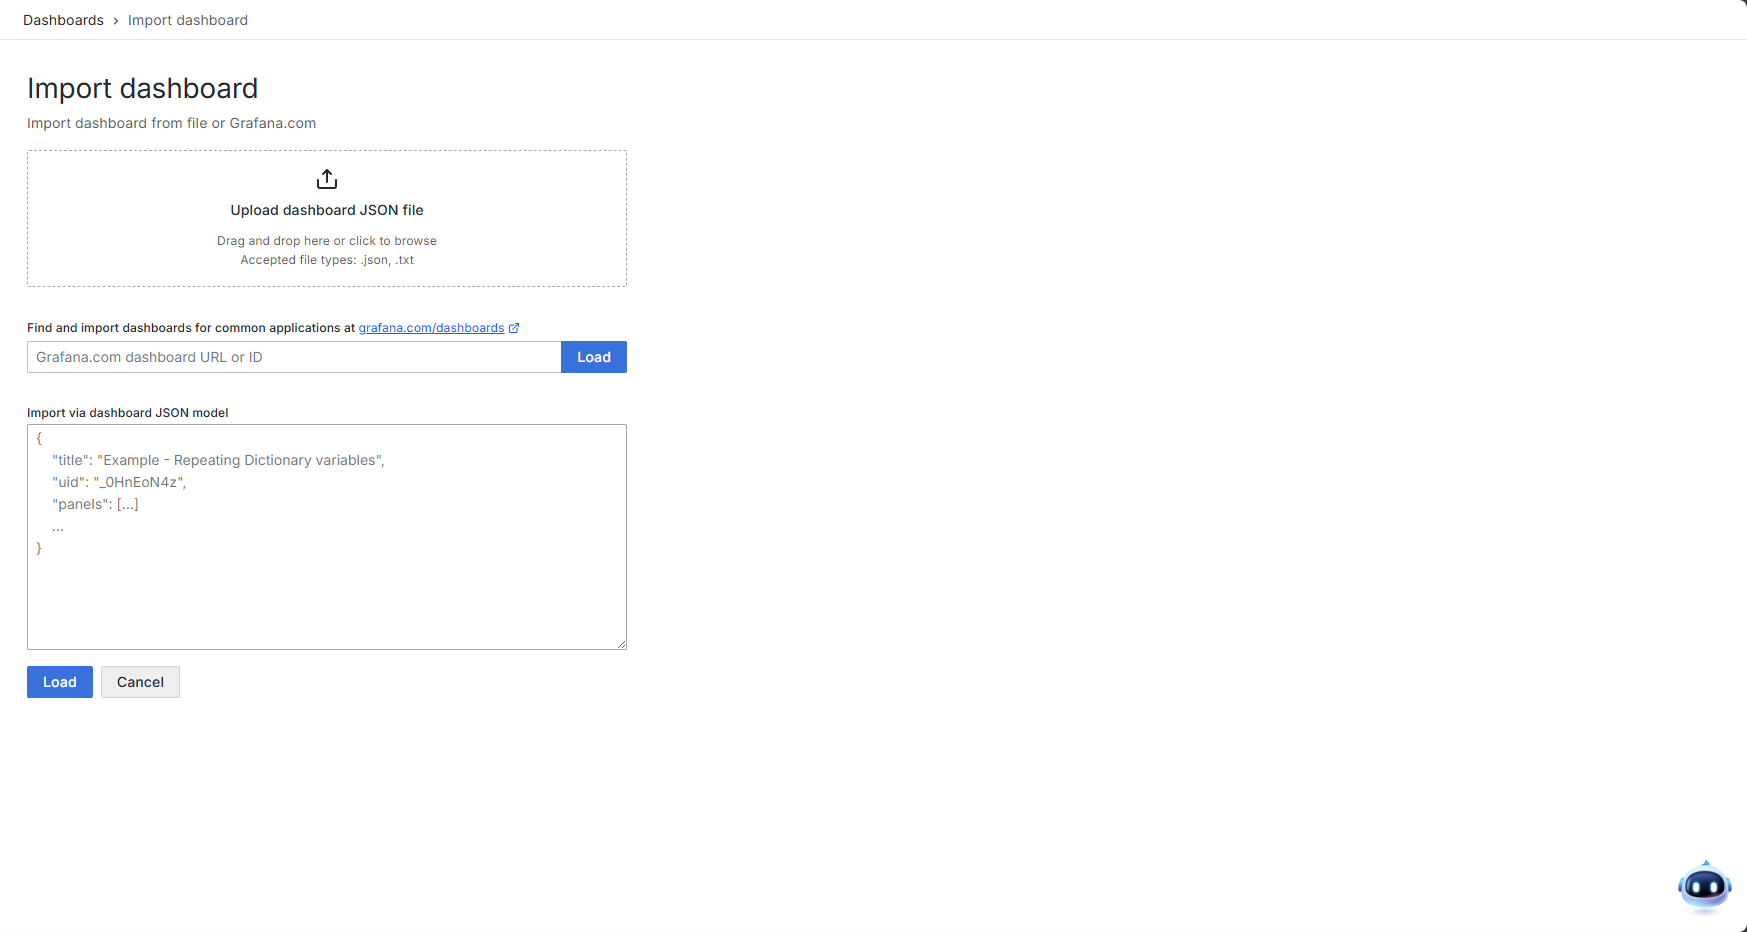
How to Import a Dashboard
Grafana supports three methods for importing dashboards:
- Upload a JSON file.
- Enter the dashboard URL or Dashboard ID from the Grafana official website.
- Paste the raw JSON data.
Import from Grafana.com
To help users quickly find suitable observability dashboards, Grafana Labs provides a dashboard repository (Grafana dashboards | Grafana Labs). You can browse the repository, select an appropriate dashboard, and import it into Grafana for use as a monitoring panel.
In the dashboard repository, you can view the dashboard's update history, required data sources, key configuration information, and directly download the JSON file or copy the Dashboard ID. Importing it into Grafana allows for quick dashboard creation.
Import from Another Grafana Instance
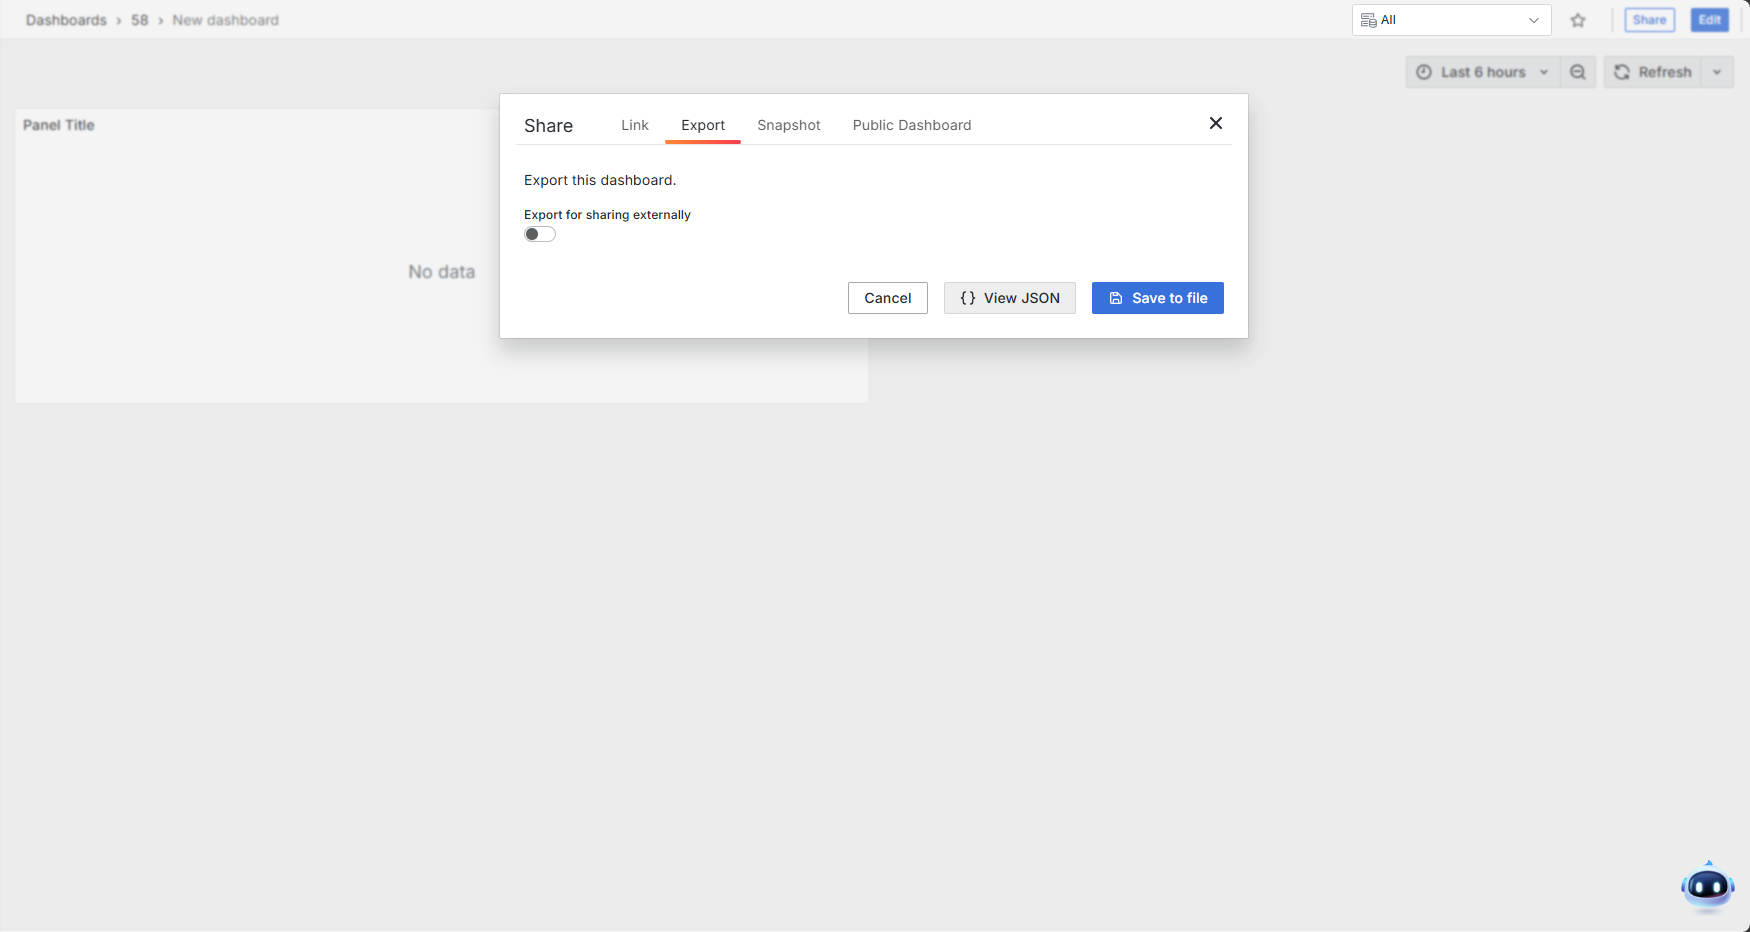
If you have previously configured dashboards in another Grafana instance and wish to migrate them to the ONE platform's External Dashboards list, you can export the desired dashboards and import them into the ONE platform. Click the Share button to view the source JSON of the current dashboard or download it directly as a JSON file. You can then import the dashboard by uploading the file or pasting the JSON content.
JSON files exported from other Grafana instances are also supported for import into the ONE platform's native dashboard module. You can choose the module based on the desired outcome.