Layout
Dashboards provide real-time insights into the performance and health of systems and applications within your organization, enabling users to visually analyze data, track key metrics, and effectively monitor trends. With dashboards, teams can identify anomalies, prioritize issues, proactively detect problems, and diagnose root causes. By offering key metric cards and functionalities for monitoring and analysis, dashboards empower teams to make informed decisions, optimize system operations, and drive business success.
Get Started
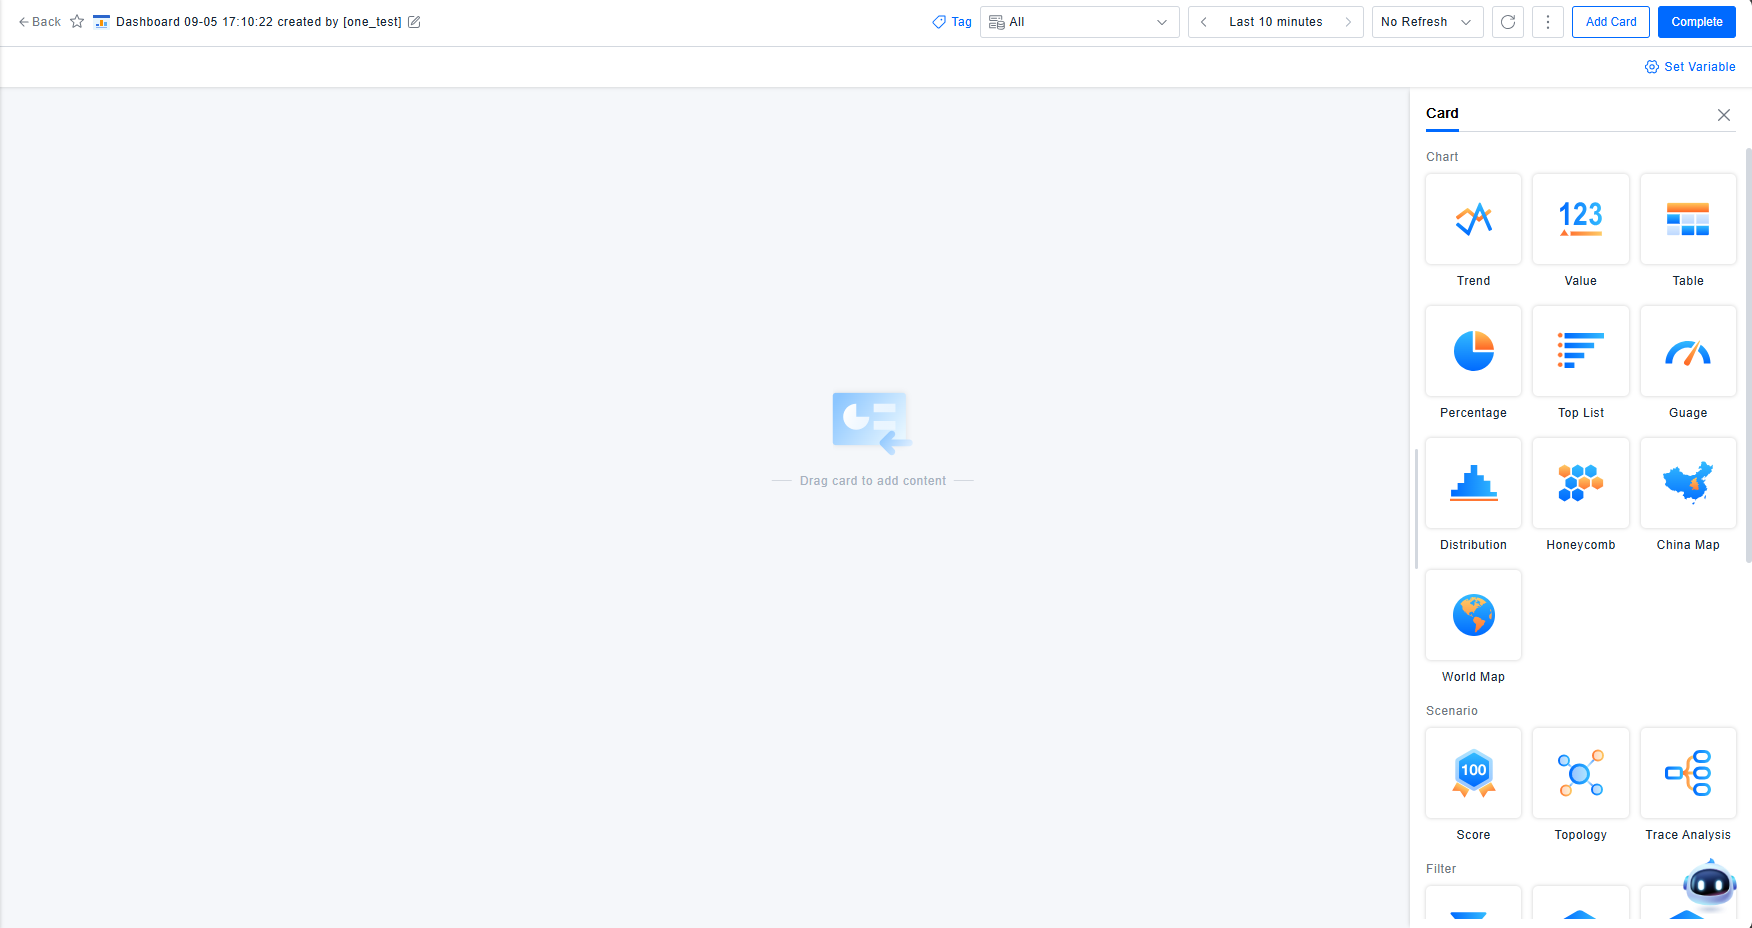
Dashboards provide users with a complete canvas for configuring their monitoring views. You can freely add cards to the dashboard and adjust their position and size via drag-and-drop. Once configured, the dashboard supports additional functions such as preview, sharing, setting as homepage, and cloning.
Title
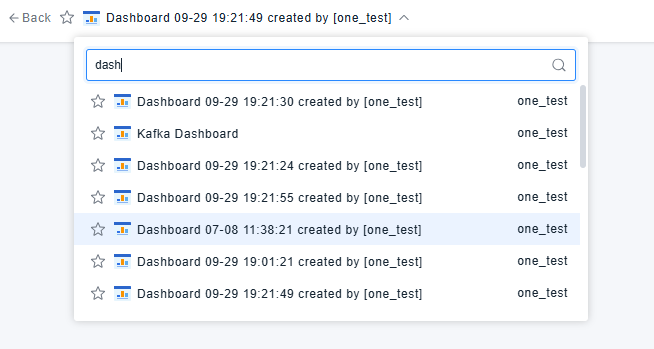
In edit mode, users can modify the dashboard name. Important dashboards can be starred, and all favorited dashboards will be prioritized in the dashboard list. In view mode, users can directly switch to other dashboards for viewing from this section.
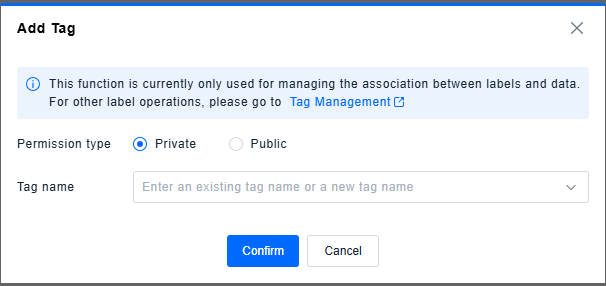
Tags
Dashboard names must be unique. Tags can be used to categorize dashboards, and the selected tags will be displayed as the dashboard's attribute information.
Resource Scope
Data permissions on the ONE platform are controlled by environment and resource scope. While dashboard configurations are the same within a single environment, the query results depend on the resource scope selected for the current dashboard.
Time Selector
All query requests require a start and end time defined by the time selector. The platform defaults to the last 10 minutes—the time range from 10 minutes prior to the moment the query is initiated. Users can use the time selector to choose either a relative or absolute time range and set a refresh interval to control how often the dashboard automatically updates.
Relative Time
The start and end times for relative time are not fixed but are calculated based on the current time. The dashboard time selector supports the following relative time options. Some options are only available in specific scenarios; please refer to Special Date Settings:
| Category | Time Option |
|---|---|
| Recent | Last 5 minutes |
| Last 10 minutes | |
| Last 30 minutes | |
| Last 1 hour | |
| Last 3 hours | |
| Last 6 hours | |
| Last 12 hours | |
| Last 24 hours | |
| Last 2 days | |
| Last 3 days | |
| Last 7 days | |
| Last 30 days | |
| Last 90 days | |
| Last 6 months | |
| Last 1 year | |
| Relative | Today |
| Yesterday | |
| Same day last week | |
| This week | |
| Last week | |
| This month | |
| Last month | |
| This year | |
| Last year | |
| Special Dates | Current [Special Date] |
| Previous [Special Date] | |
| Same [Special Date] last week |
Displayed only after special configuration is enabled. [Special Date] is related to user configuration.
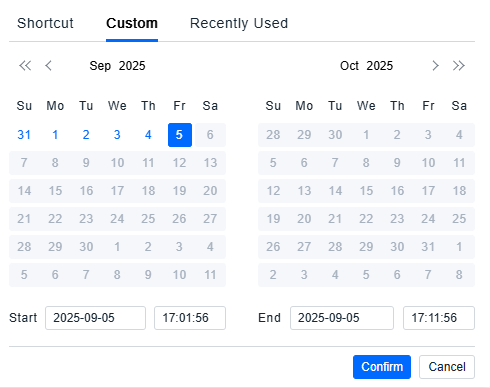
Absolute Time
In absolute time mode, both the start and end times are fixed and independent of the current time. This can be set via the custom time option in the time selector.
Refresh Frequency
Once a dashboard is configured and the time selector is not modified, it will retain the last query results by default. For users who require real-time data monitoring, an automatic refresh interval can be set, or the data can be refreshed manually via a button. Automatic refresh intervals include: 1 minute, 3 minutes, 5 minutes, and 15 minutes.
Other Functions
- Share: The current dashboard can be shared with other users or user groups for viewing or editing. For details, refer to Dashboard Sharing.
- Set as Homepage: The current dashboard can be set as the homepage view. For details, refer to Dashboard List.
- Clone: When dashboard configurations are similar, you can avoid repetitive work by cloning an existing dashboard and then modifying it.
- Delete: The current dashboard can be deleted directly.
Edit/View Modes
Dashboards have two states: Edit and View. Content can only be modified in Edit mode. In View mode, the dashboard is not editable but can be zoomed for detailed analysis.
There are no functional permissions restricting dashboard access; all accounts can create dashboards. Viewing and editing permissions are controlled through the sharing function. The dashboard configuration itself is not controlled by data permissions; the configuration remains the same within an environment, but the query results within the dashboard depend on the currently selected resource scope.