View Synthetic Tasks
Synthetic tasks utilize globally distributed simulation request nodes to capture the global performance of hosts, processes, and interfaces in real-time. Covering different network layers including ICMP PING, TCP, HTTP, gRPC, and WebSocket, they trigger precise alerts when performance degradation, response timeouts, unexpected status codes, or other issues occur, enabling full-chain control from "passive discovery" to "active warning" before problems escalate.
Getting Started
-
Create synthetic locations under Configuration/Deployment Status/Synthetic Locations
-
Create synthetic tasks under Configuration/Settings/Data Collection/Synthetic Tasks
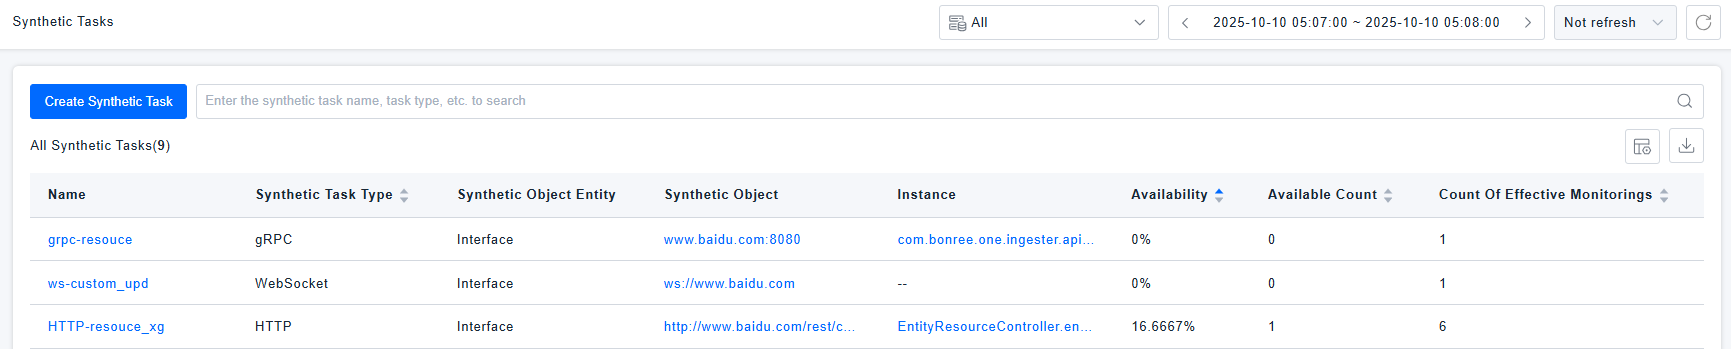
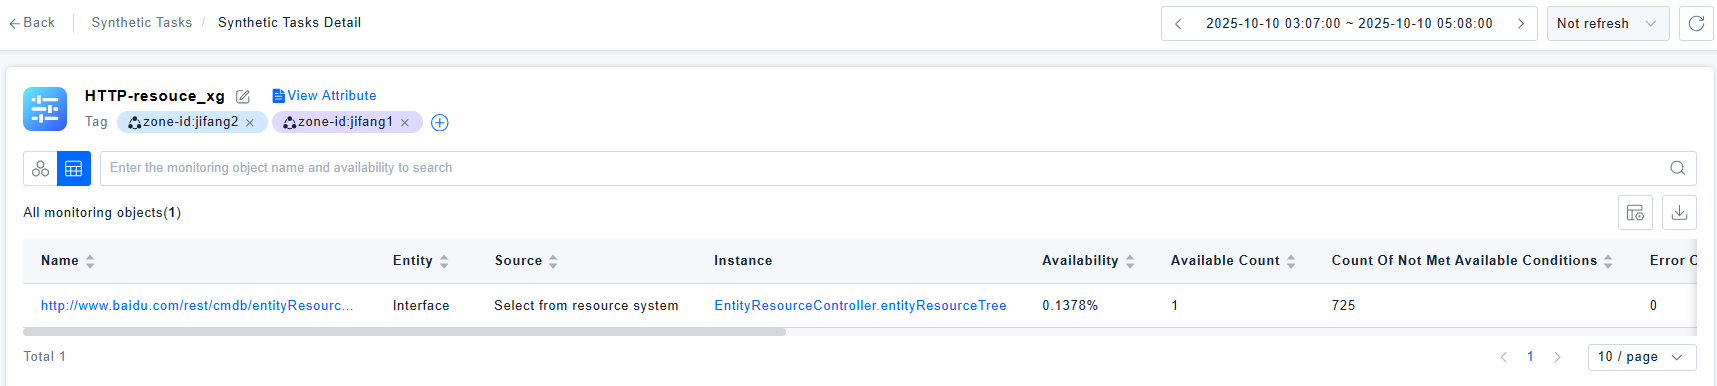
Under the Synthetic/Monitoring Tasks menu, you can view the synthetic task list, which displays tasks that have reported metrics. Click the task name to enter the task details page.
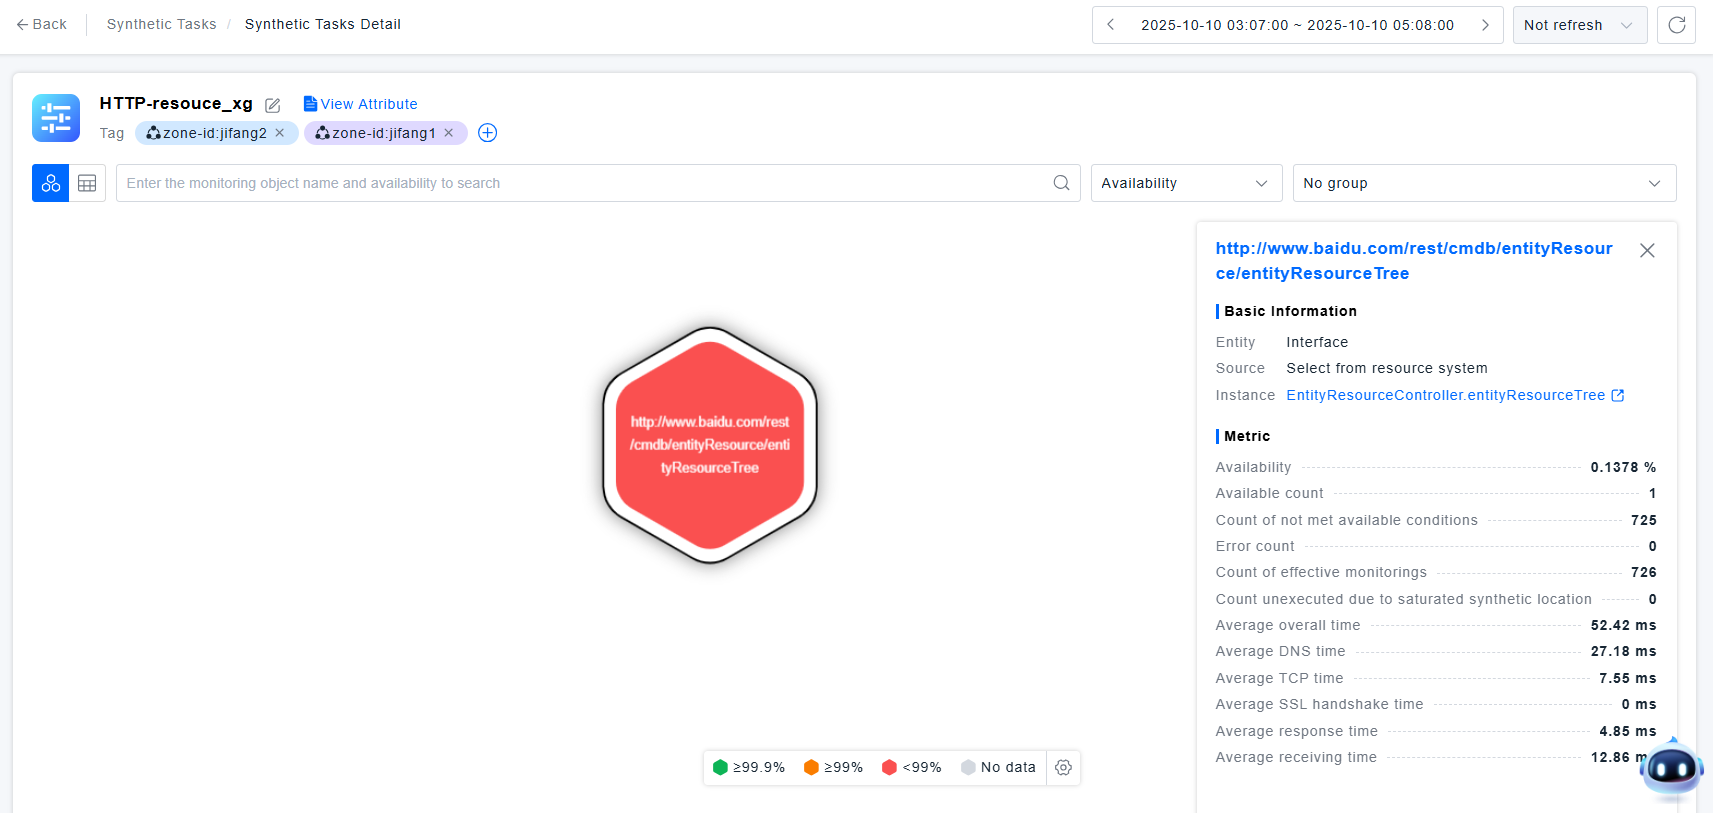
Monitoring Object Honeycomb Chart
Supports coloring based on availability rate. The legend supports custom configuration for availability rate value coloring. Gray indicates no valid monitoring data is currently available.Click on a honeycomb cell to view related metrics information for the monitoring object.
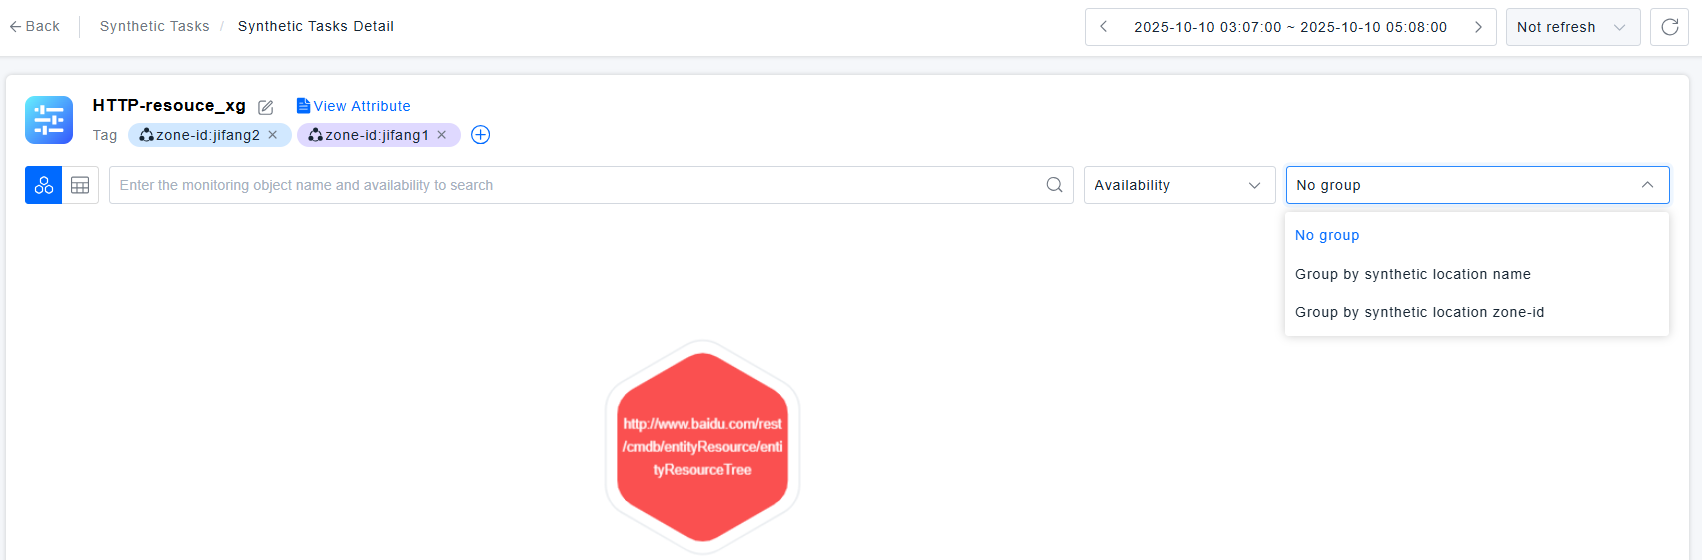
Supports grouping by synthetic location name or synthetic location tags, helping analyze whether issues are concentrated on specific synthetic locations.
Monitoring Object List
The honeycomb chart supports switching to table view.
Monitoring Object Time Series Charts and Metrics
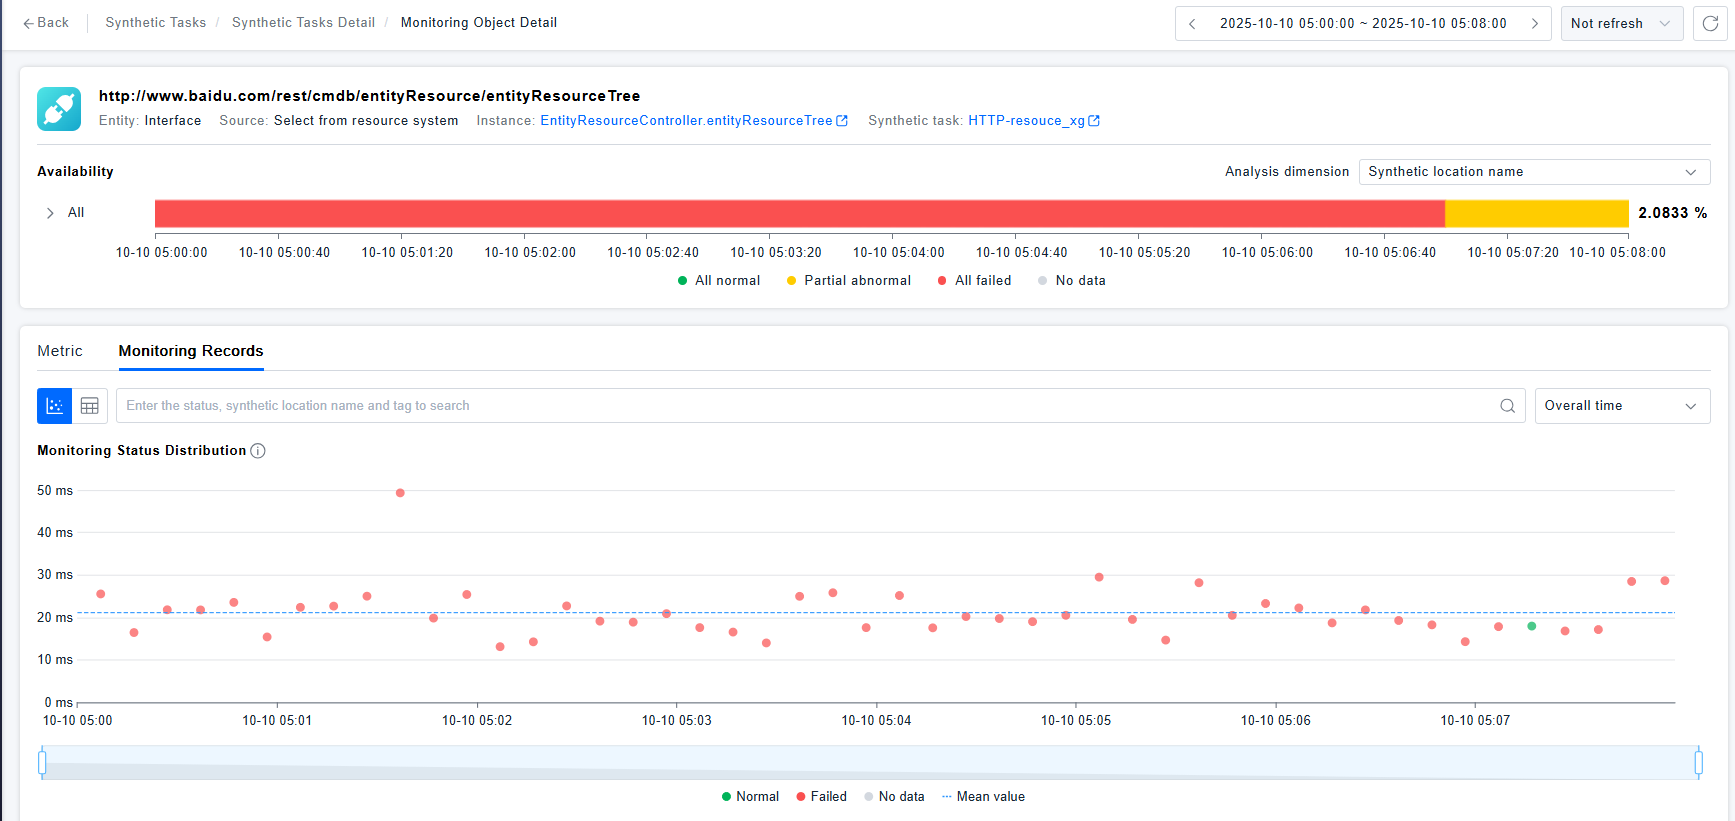
Click on a monitoring object from the honeycomb chart/list to enter the monitoring object details page:
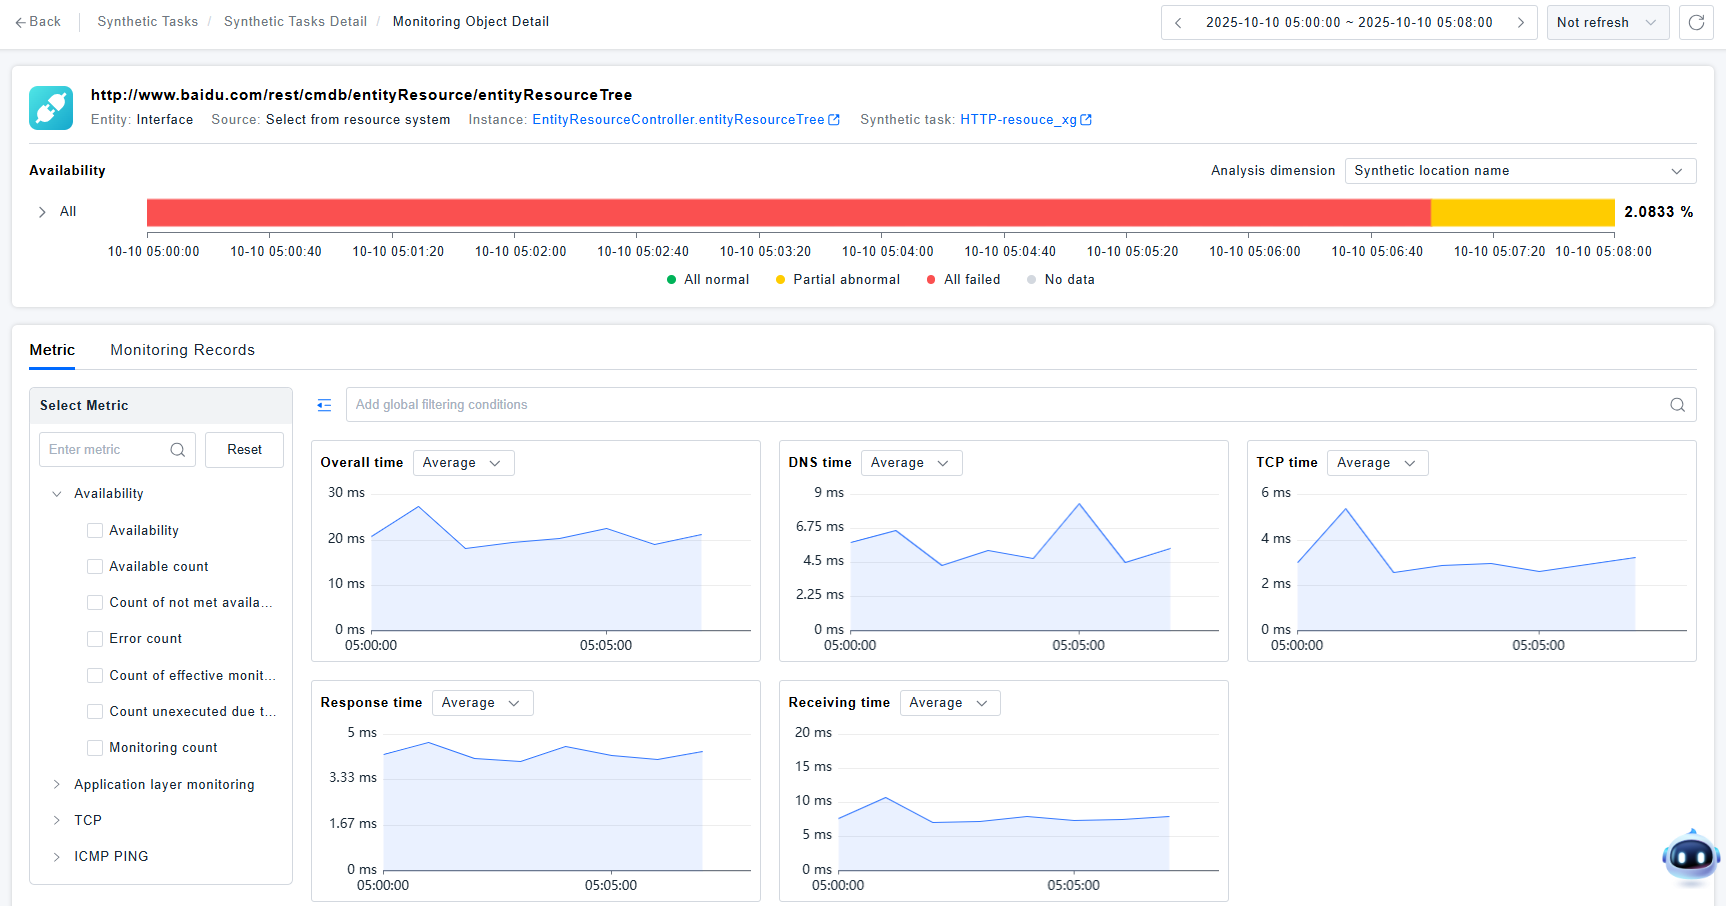
- Legend meanings in the time series chart:
- All Normal: All synthetic locations accessed the monitoring object normally (meeting available conditions set during task creation)
- All Failed: All synthetic locations failed to access the monitoring object (not meeting available conditions)
- All No Data: All synthetic locations were saturated and unable to execute the monitoring task
- Partial Exception: At a certain time, the status of synthetic locations accessing the monitoring object was inconsistent - some may have failed, or some were saturated and unable to execute the task
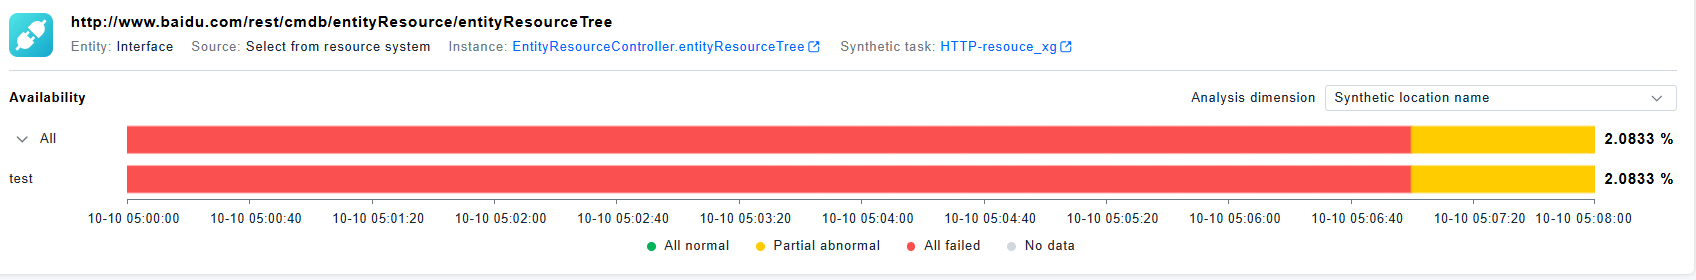
- The time series chart supports grouping by synthetic location name or synthetic location tag keys. You can expand to view availability time series charts after grouping, analyzing which synthetic locations had issues accessing the monitoring object.
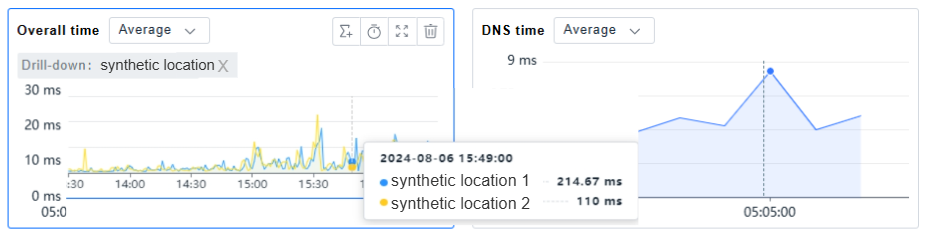
- Clicking on points in the metric trend chart will pop up: "View Related Records" and "Dimension Drill-down"
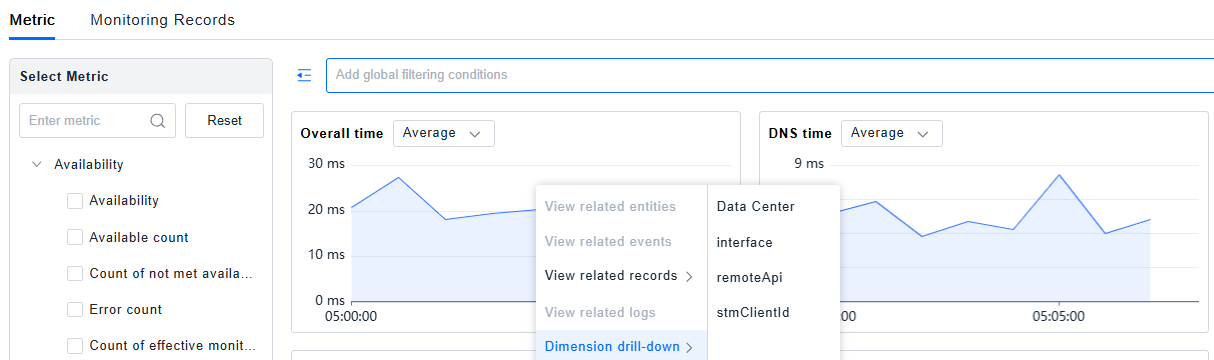 Clicking "View Related Records" - Monitoring Object Details Monitoring Records will automatically switch to the monitoring records scatter chart for the corresponding time period, facilitating detailed viewing and analysis.
Clicking "Dimension Drill-down" - Synthetic Locations allows comparing metric values across different synthetic locations.
Monitoring Records Scatter Chart/List
Click the Monitoring Records tab to view the monitoring records scatter chart/list.
The monitoring records scatter chart supports selecting which metric to use for plotting the scatter points.
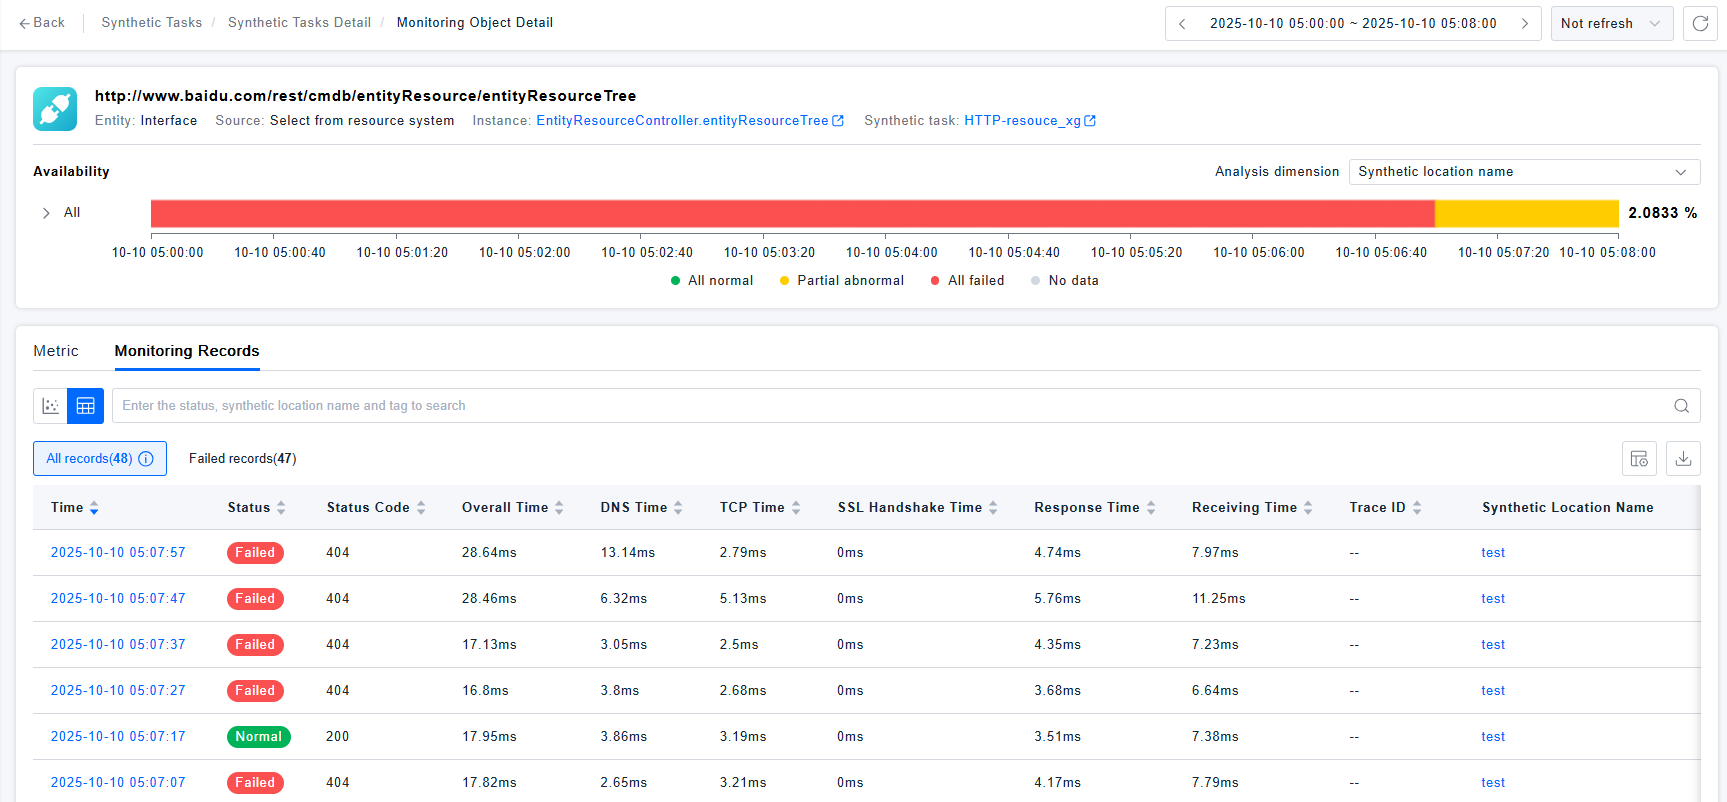
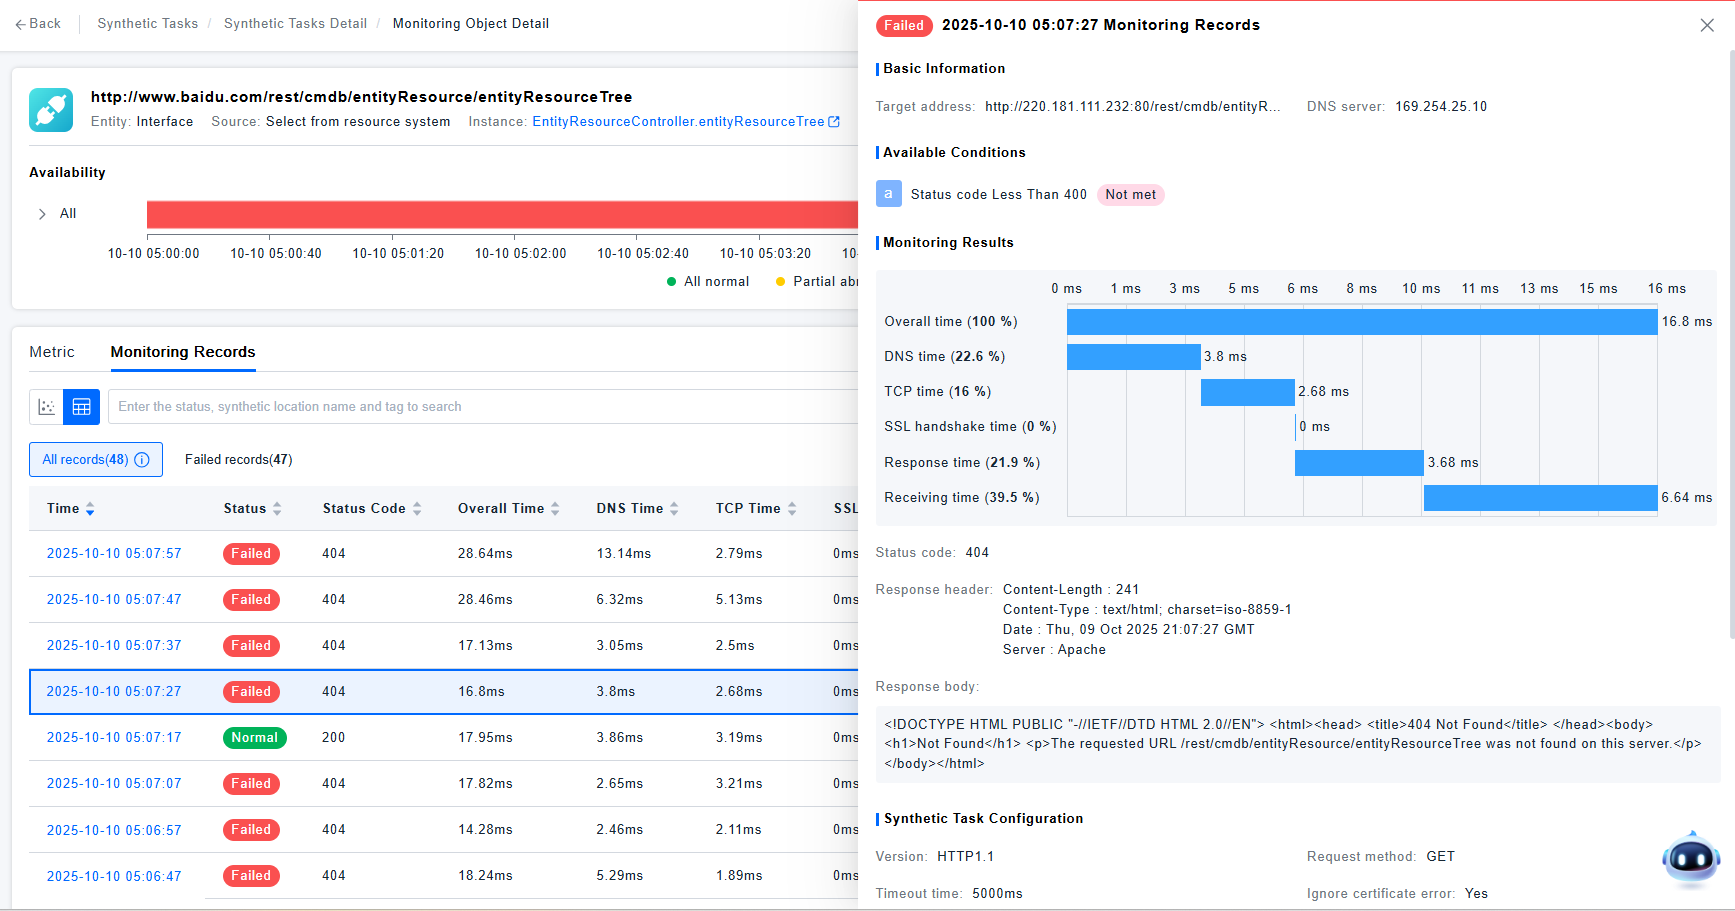
Monitoring Record Details
Click on a scatter point or the monitoring record time column to view monitoring record details, displaying monitoring results, task configuration information at monitoring time, and synthetic location information, facilitating analysis of the monitoring situation. If APM monitoring also uses Bonree APM, HTTP synthetic monitoring will display Traceid, which can be clicked to drill down and view call chain details.