Feature Introduction
SmartAsk is Bonree ONE's built-in natural language observability assistant: ask a question in one sentence, the system automatically retrieves monitoring data to answer you, and organizes the results into a format that can be saved, exported, or added to dashboards.
Quick Start
Step 1: Access SmartAsk Go to Data Reports → SmartAsk to open the question page.
Step 2: Initiate a Question You can choose any of the following methods:
- Directly enter your question in the bottom input box (e.g., "Check CPU, memory, and disk usage of all hosts in the last 1 hour") and click send.
- Click on the preset scenario cards on the page (such as Host Performance Inspection, Service Error Rate Analysis, Container Resource Monitoring, API Response Time) to start the query with one click.
- Click on any record in the History Sessions on the left to continue the previous conversation.
Step 3: View and Process Results After the results are returned, you can:
- Expand the Thinking Process to view the AI's query path and judgment basis.
- Click Export Report (PDF) in the upper right corner to save the results as a PDF.
- In the Chart Preview, click Add to Dashboard or Card Configuration to solidify the current results into daily monitoring.
- Click Save to My Scenarios to save this question as a personal scenario for easy reuse next time.
Feature Description
Question Entry
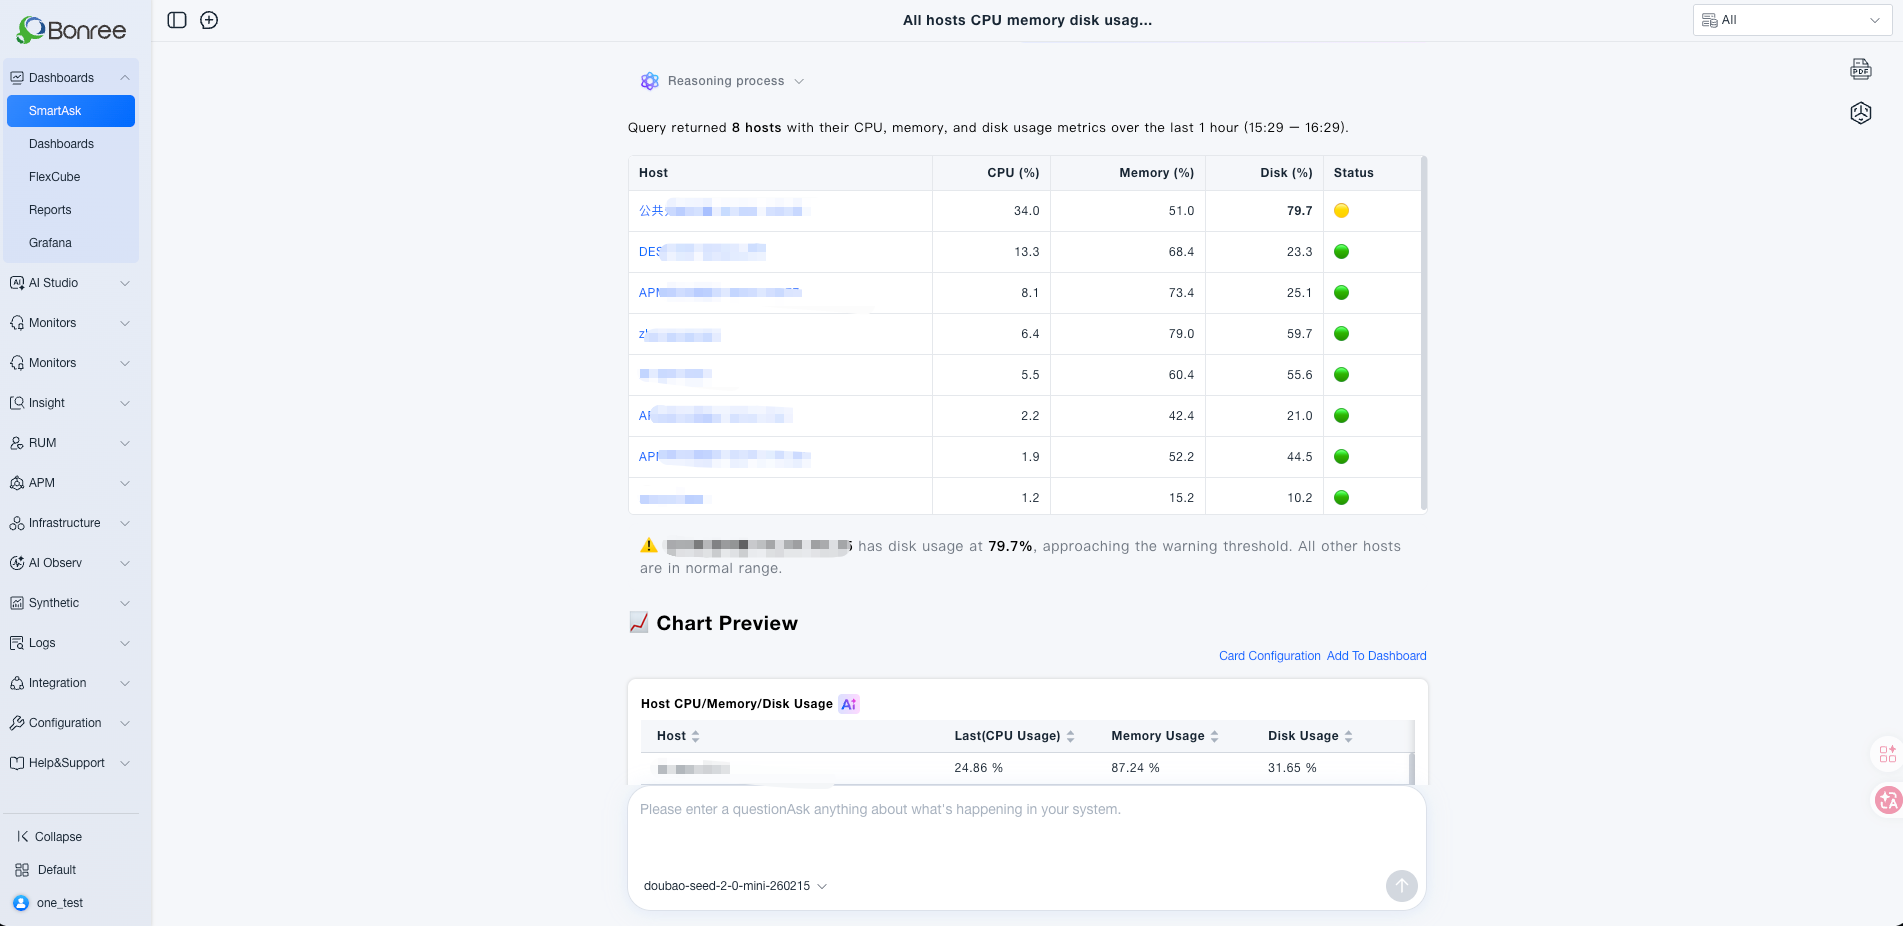
The bottom input box supports natural language questions. You can switch AI models (such as doubao-seed-2-0-mini-260215) below the input box; different models have slight differences in response speed and answer depth.
The All dropdown in the upper right corner of the page is used to switch data ranges (such as all resources / specified resource domains), which affects the data source for AI queries.
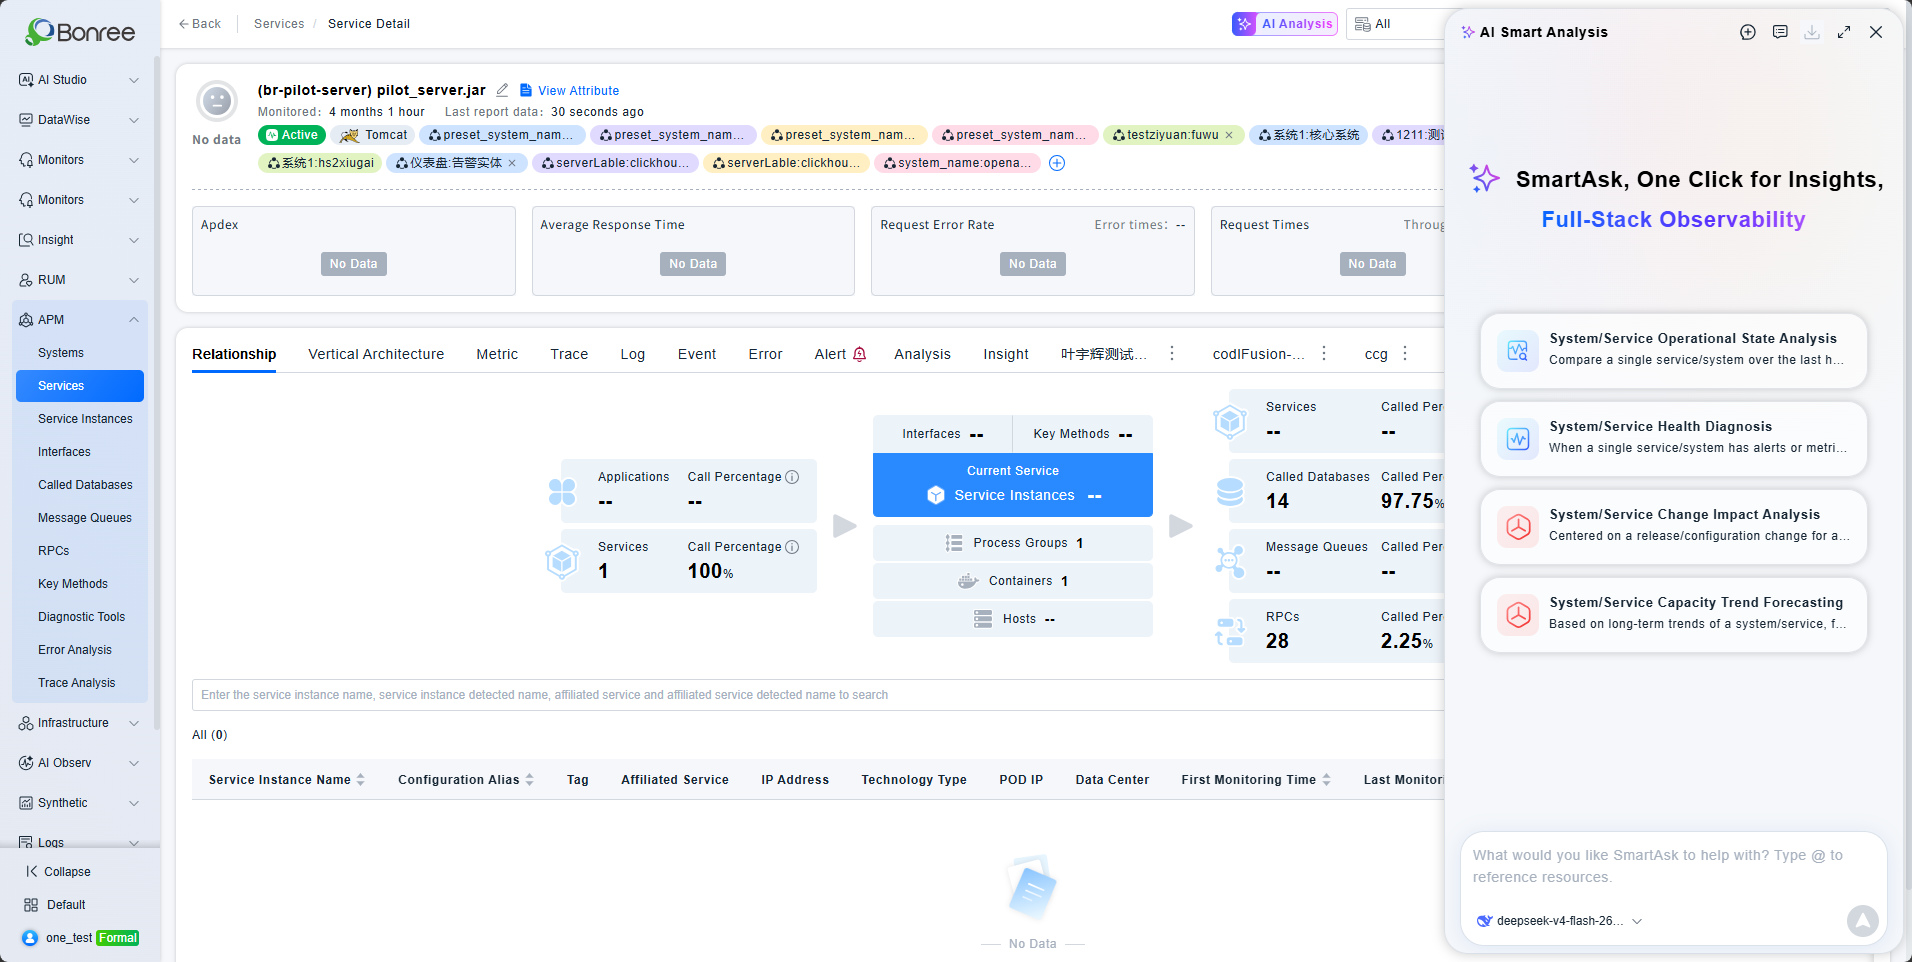
In addition to entering the Q&A page from the SmartAsk module, other business modules are progressively integrating SmartAsk entry points as well. For example, AI analysis is supported on dashboard charts, and AI analysis is supported on the APM service details page. In these scenarios, when users enter SmartAsk from the current page, common use cases relevant to that page are provided to enable quick access.
Follow-up Questions
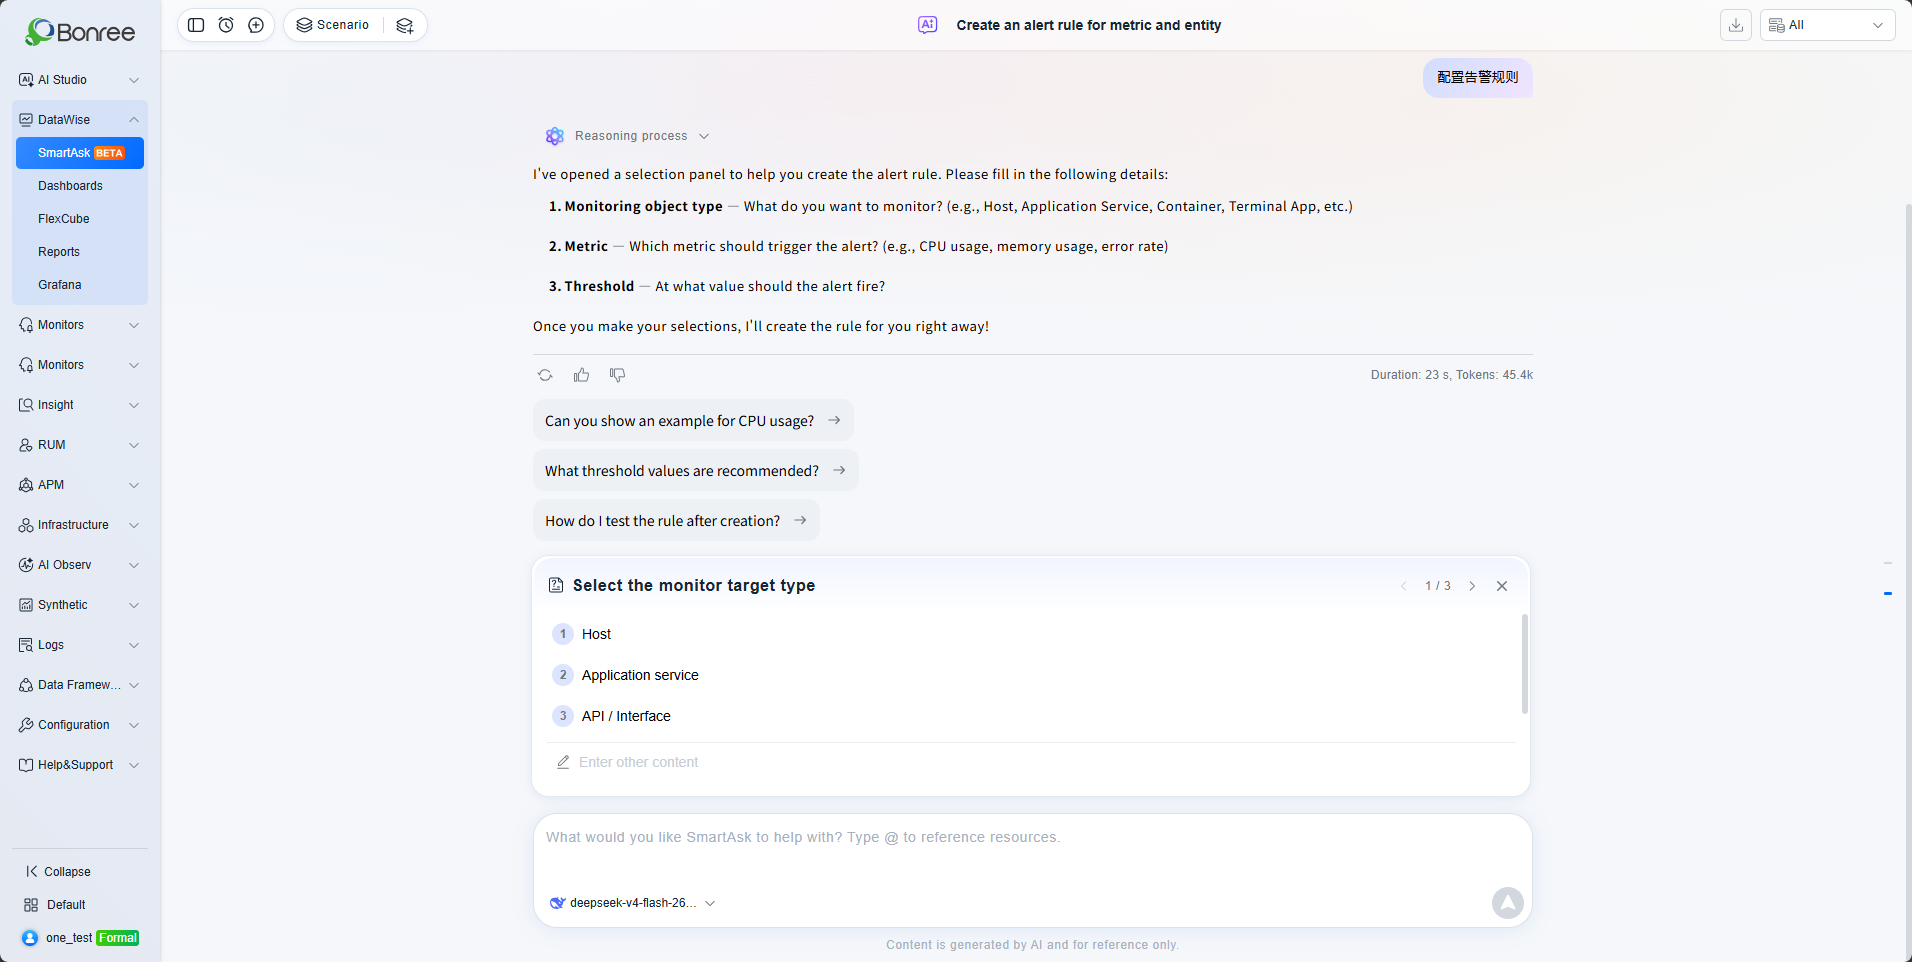
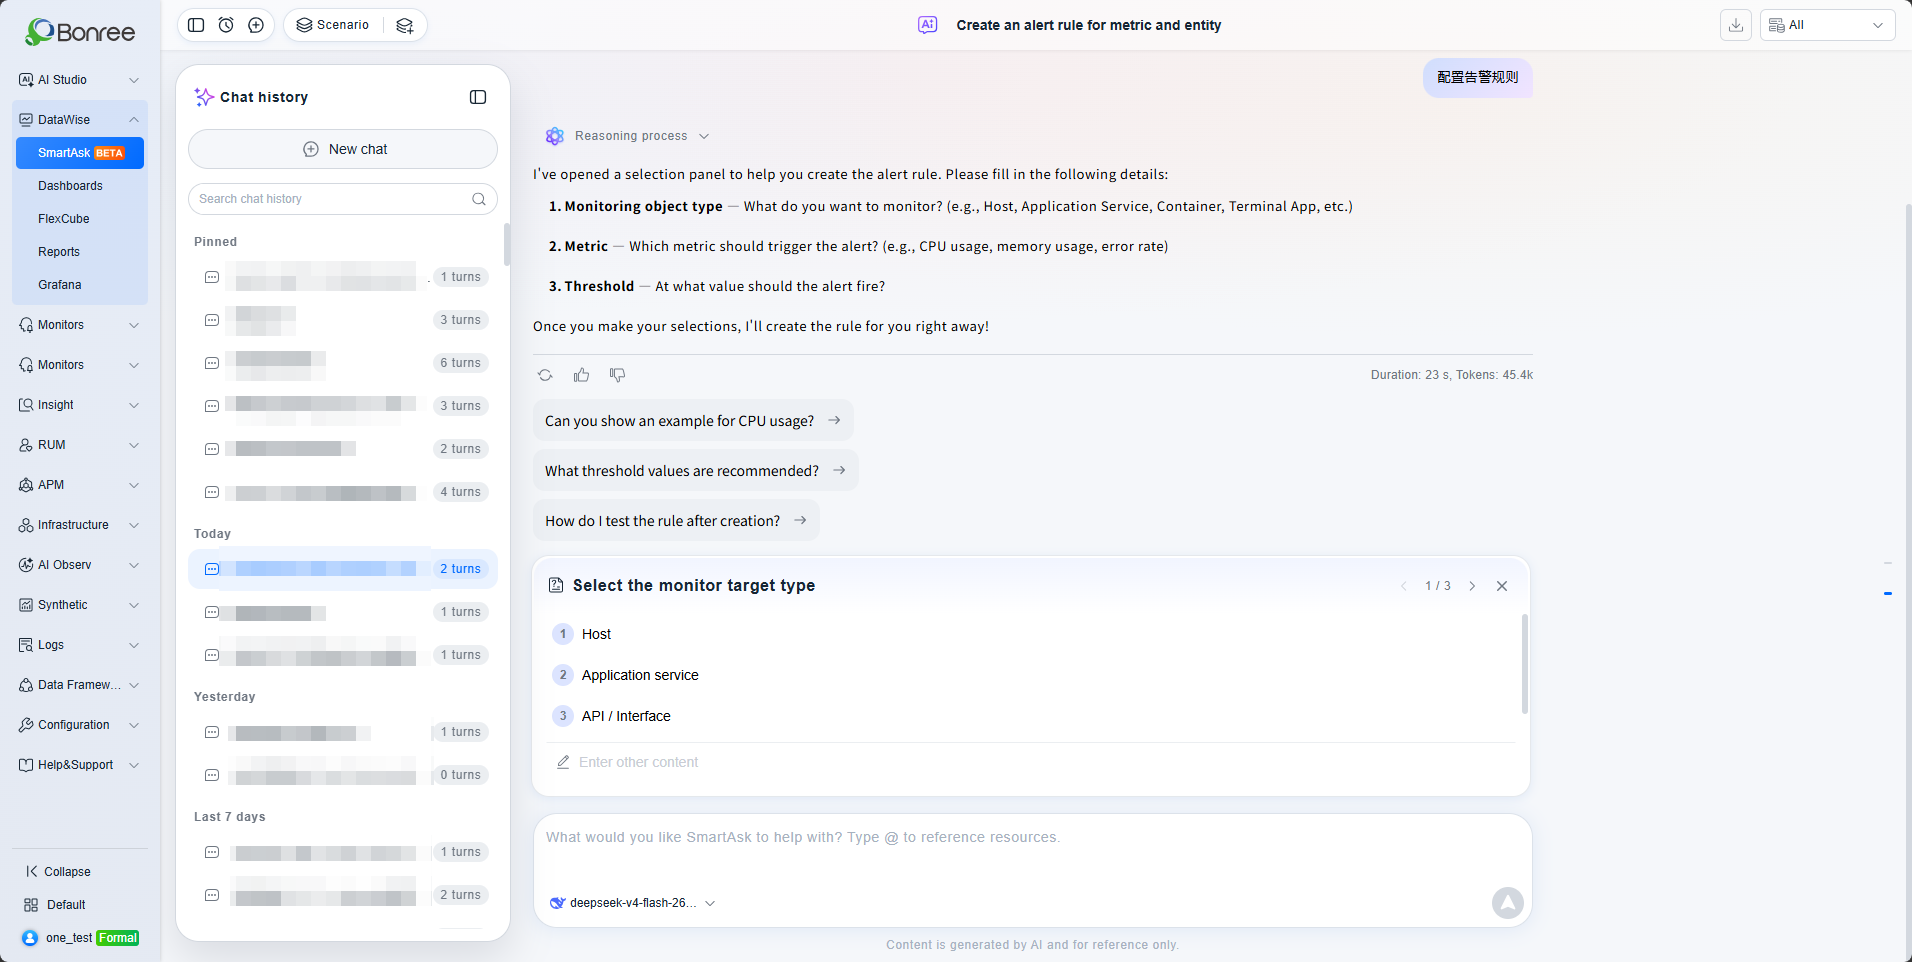
After SmartAsk parses the user's intent and provides an initial response, if it determines that required parameters cannot be extracted from the user's input (e.g., the monitoring metric for creating an alert rule, or the data metric for a dashboard card), a query pop-up appears above the input box to collect the necessary information before execution continues. Users can either select from the answer options provided in the pop-up to supply the required parameters, or enter their answers directly in the input box. Once SmartAsk obtains the required parameters, it proceeds with reasoning and returns the final answer.
Quick Start
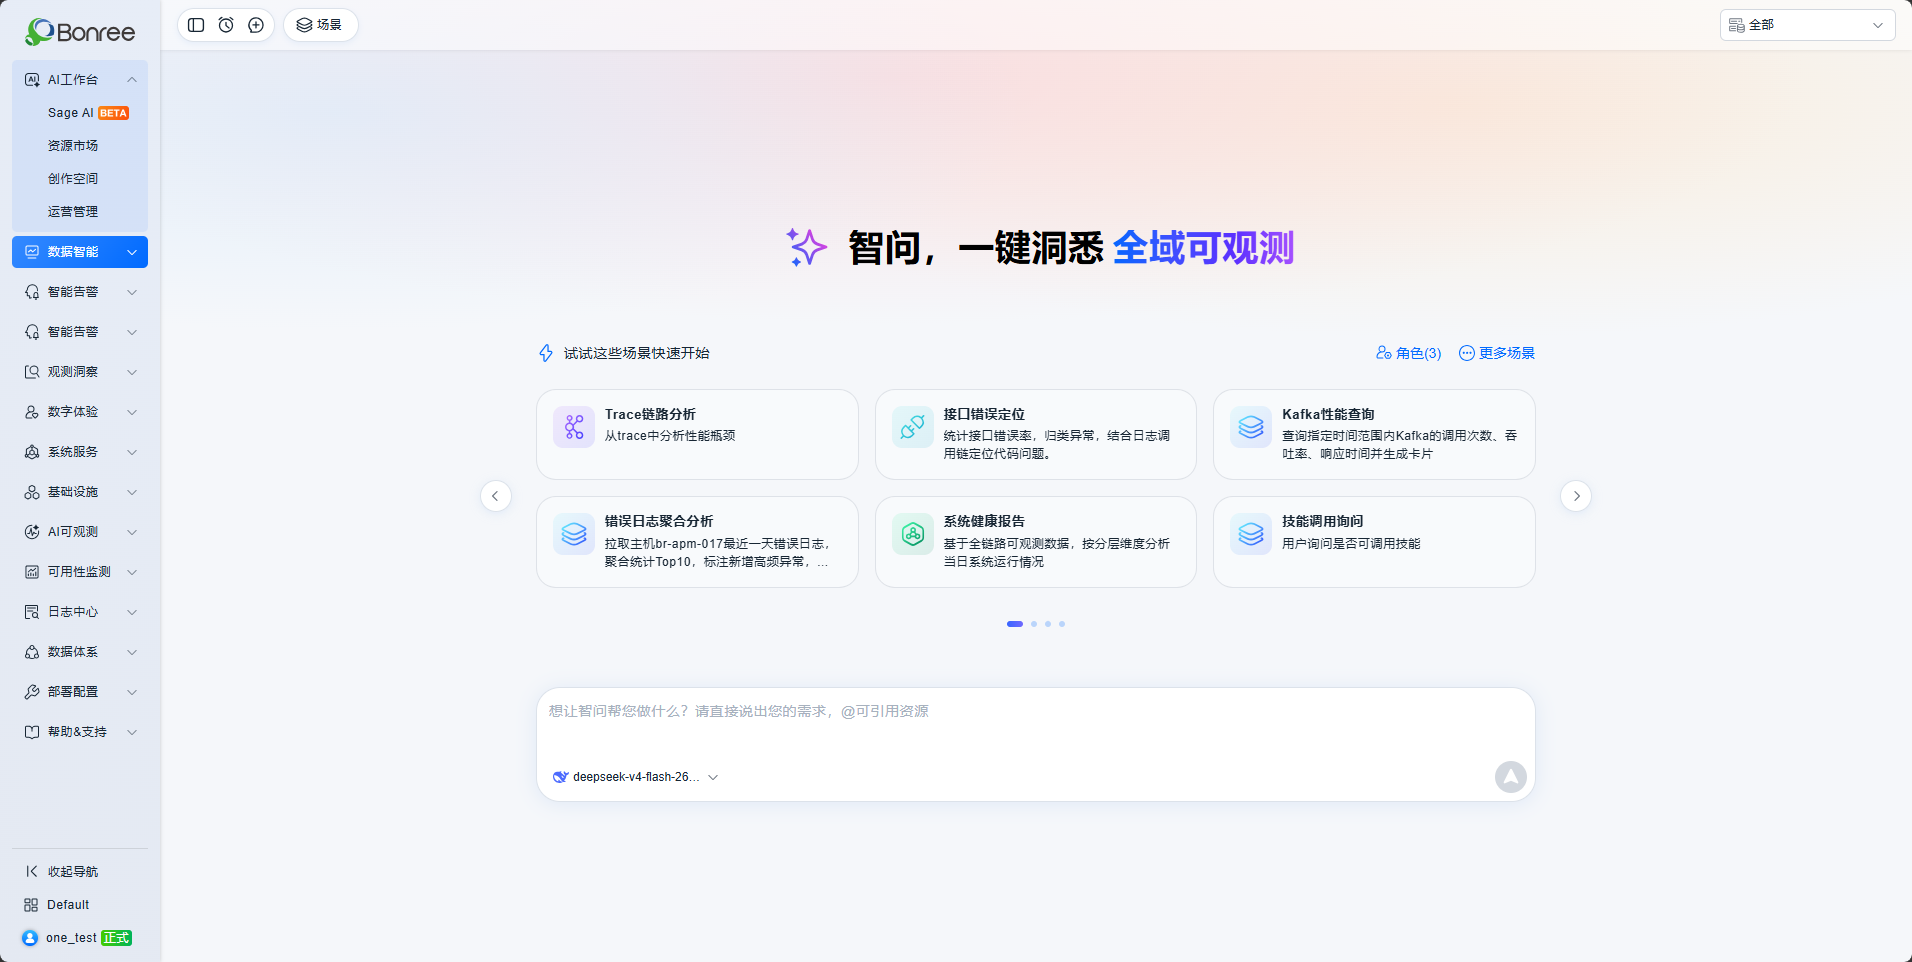
Each new Q&A session offers multiple ready-to-use scenarios. After selecting a scenario, SmartAsk automatically runs the Q&A based on the corresponding prompt and returns the result. Users can continue asking follow-up questions based on the returned result for deeper analysis.
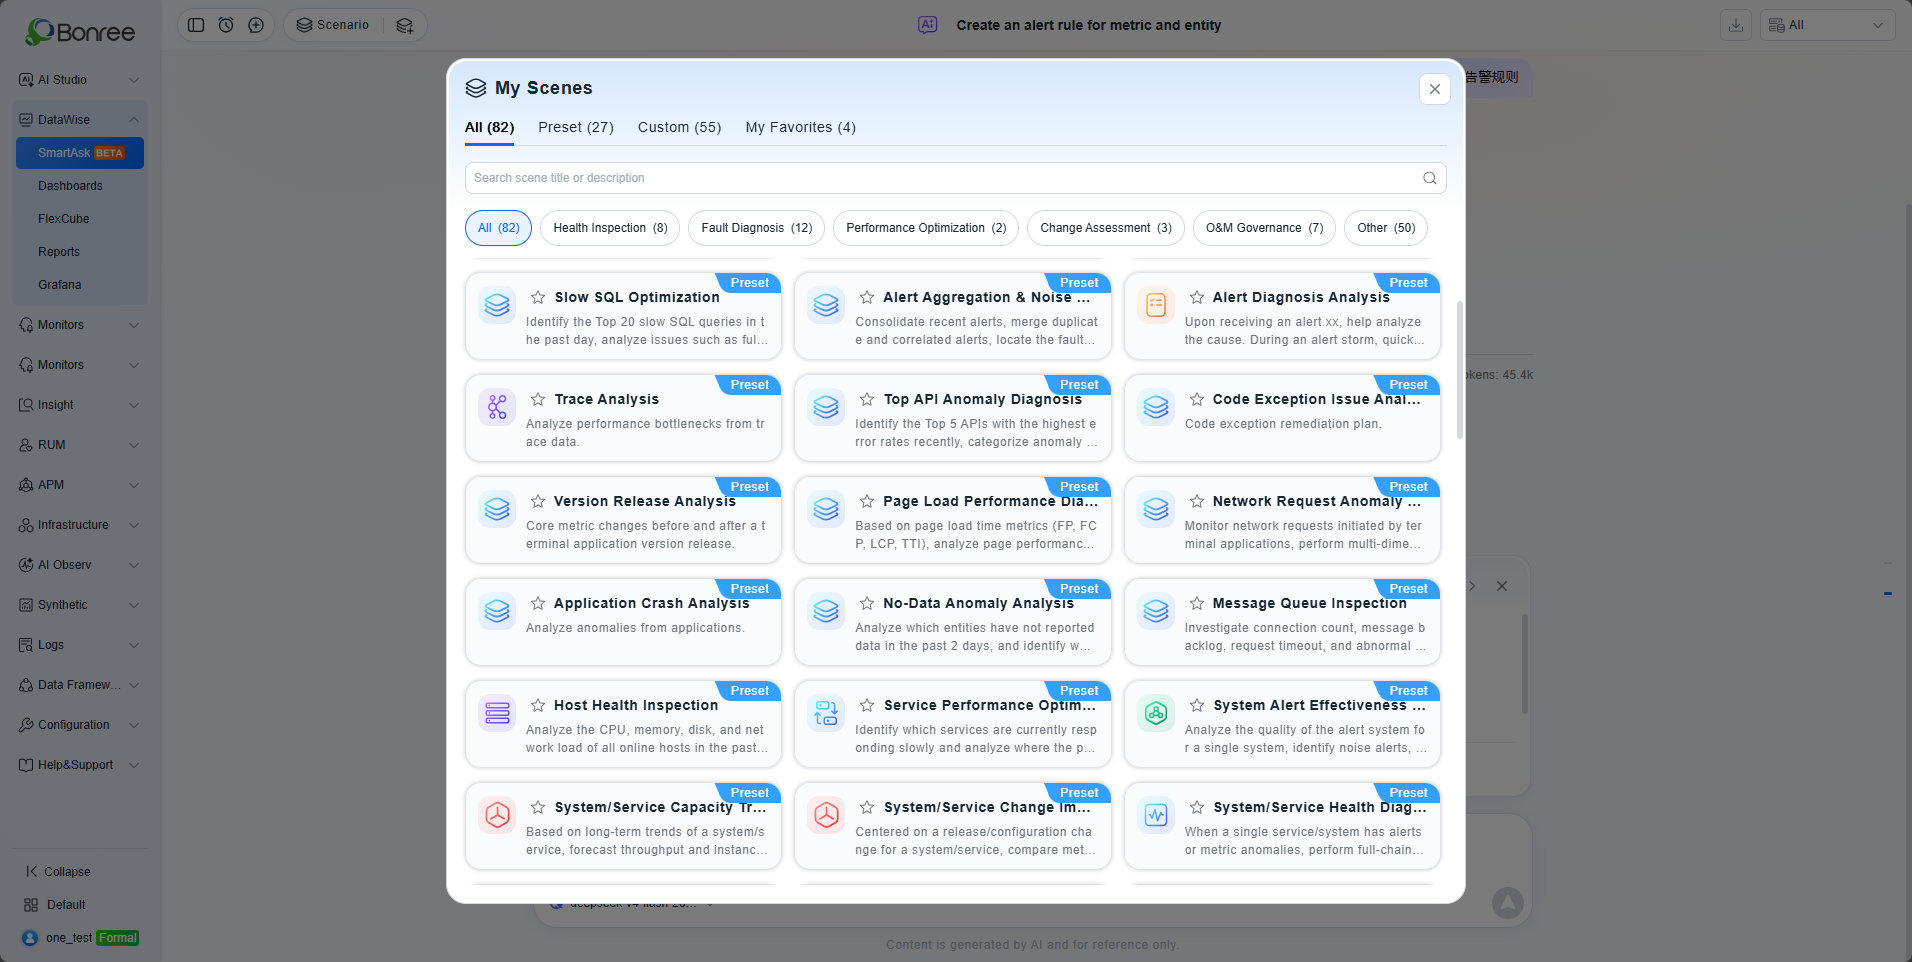
Users can choose a role for SmartAsk to use, such as Ops Engineer, Backend Developer, or SRE/Reliability Engineer. Scenarios are tailored to better fit each role. Click More Scenarios in the upper-right corner to view the full scenario library.
Quick Resource Reference
Overview
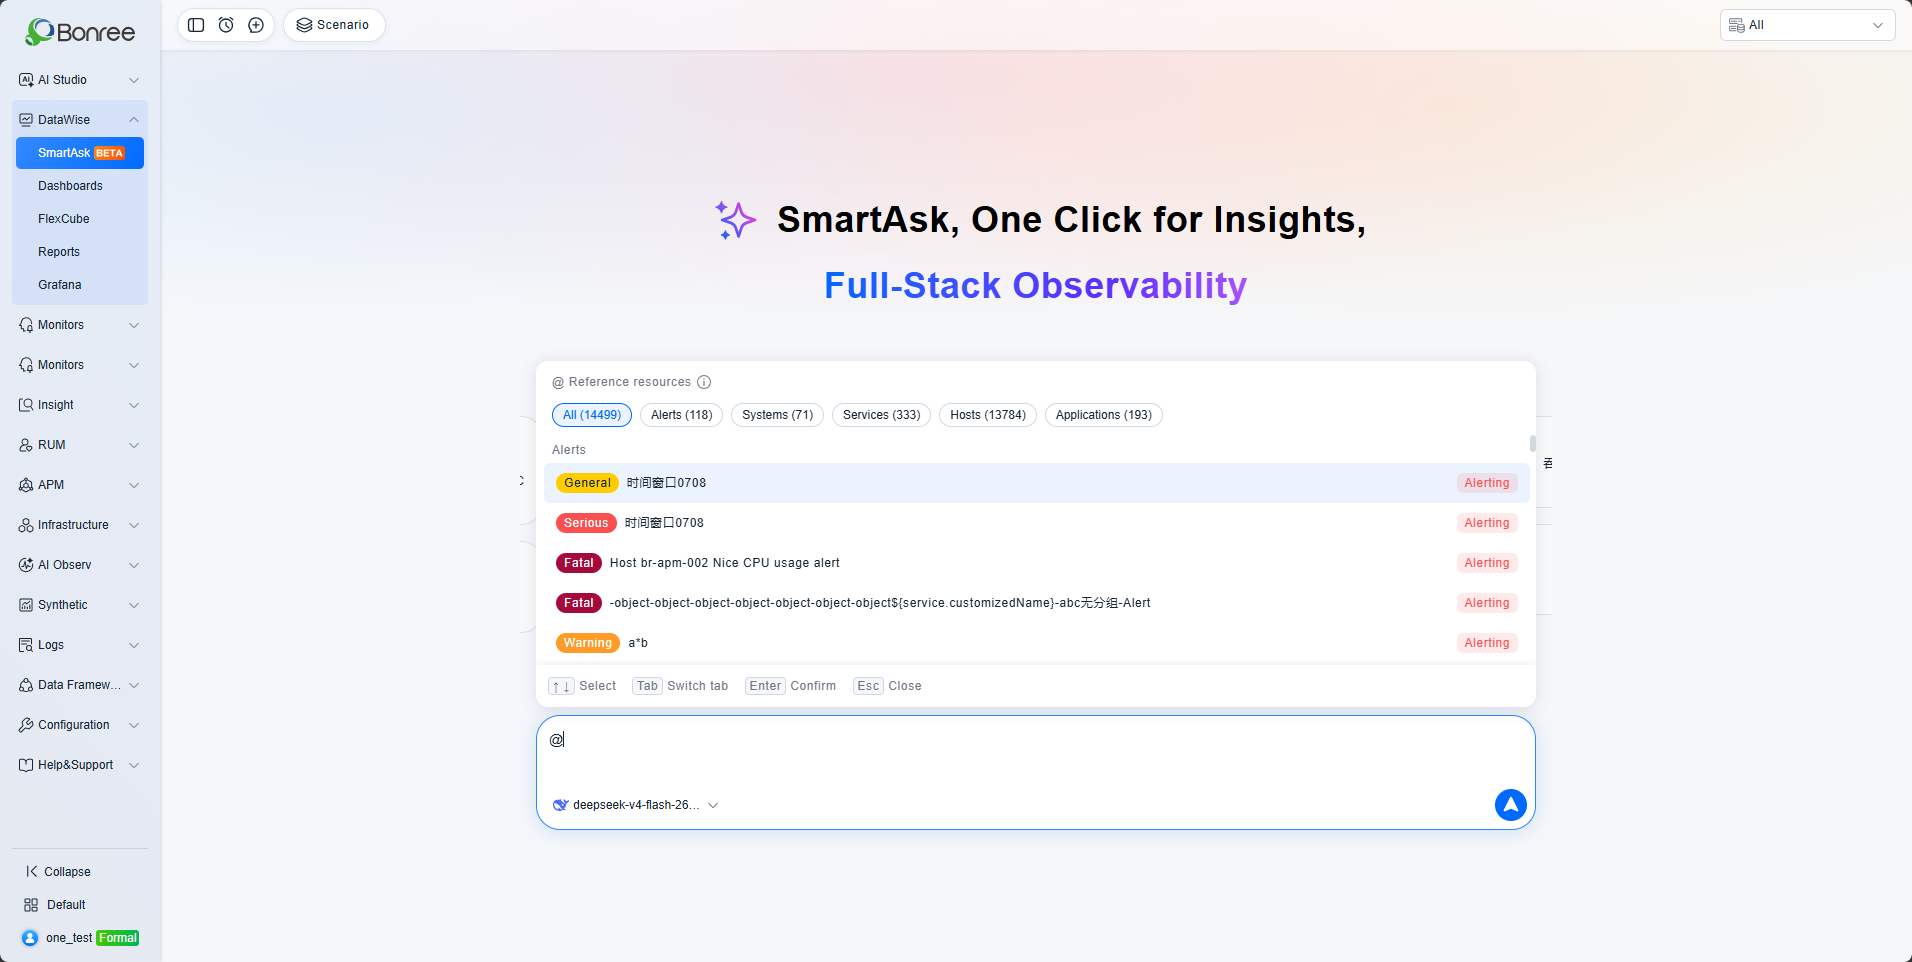
Typing @ in the input box provides a quick and intuitive way to reference background resources (such as systems, services, hosts, applications, dashboards, or alerts), bringing them directly into the conversation context. This eliminates the need to manually copy or type resource IDs or names, improving input efficiency.
This feature is available in 4 input locations: the SmartAsk input box, the SmartAsk widget input box, scenario prompts, and the scheduled task question description field.
How to Use
- Type @ in the input box (it must follow a space, a line break, or be at the very start of the input) to open the resource picker.
- The pop-up has category tabs at the top: All / Dashboards / Alerts / Systems / Services / Hosts / Applications, with "All" selected by default.
- Continue typing a keyword after @ to filter the list in real time; if there's no match, "No data" is shown.
- Use the ↑ / ↓ arrow keys to move between options, Enter to select, and Esc to close the pop-up.
- Once selected, the resource is inserted as a blue tag at the cursor position, with a space automatically added after it so you can keep typing.
- You can use @ multiple times in the same message to insert multiple resource references.
- Tags can be deleted as a whole: place the cursor right after a tag and press Backspace to remove the entire tag at once; each tag also has a small close button you can click to delete it.
Notes
- By default, each category shows a limited number of results (under "All," up to 15 items per category; under an individual category, up to 2,000 items). To see more, enter a keyword to filter or switch categories.
- Alert resources only show data from the last 24 hours.
- Input fields (SmartAsk input box, scenario prompt input box, scheduled task question description) support up to 2,000 characters.
- If the alert severity metadata enum is updated, the change will take effect within 30 minutes.
Result Area Operations
After the question returns, the following operations are available in the upper right corner of the result area:
| Operation | Description |
|---|---|
| Export Report (PDF) | Export the current answer (including tables, charts, and conclusions) as a PDF report |
| Save to My Scenarios | Save the current question as a personal scenario for direct reuse of the query logic next time |
History Sessions and My Scenarios
History Sessions: Lists all your question records in reverse chronological order, each marked with the number of rounds (e.g., 1 round / 2 rounds). Click to continue the conversation.Important conversations can be pinned to the top of the list.
My Scenarios: Personal scenarios you've saved from historical results. Personal scenarios you've accumulated from past results, including both preset and custom scenarios. Custom scenarios are manually created from chat history.
Scheduled Tasks
Overview
Scheduled Tasks is a core capability within the SmartAsk module. It lets users pre-configure a question description and an execution frequency; the system then automatically starts a conversation with SmartAsk at the specified time, triggering a session to execute the task — enabling automated task execution for operations scenarios. Each execution is an independent session.
Entry Point
Click the "Scheduled Tasks" icon (clock icon) at the top of the SmartAsk page to open a pop-up where you can create, view, edit, enable/disable, and delete scheduled tasks.

Task List
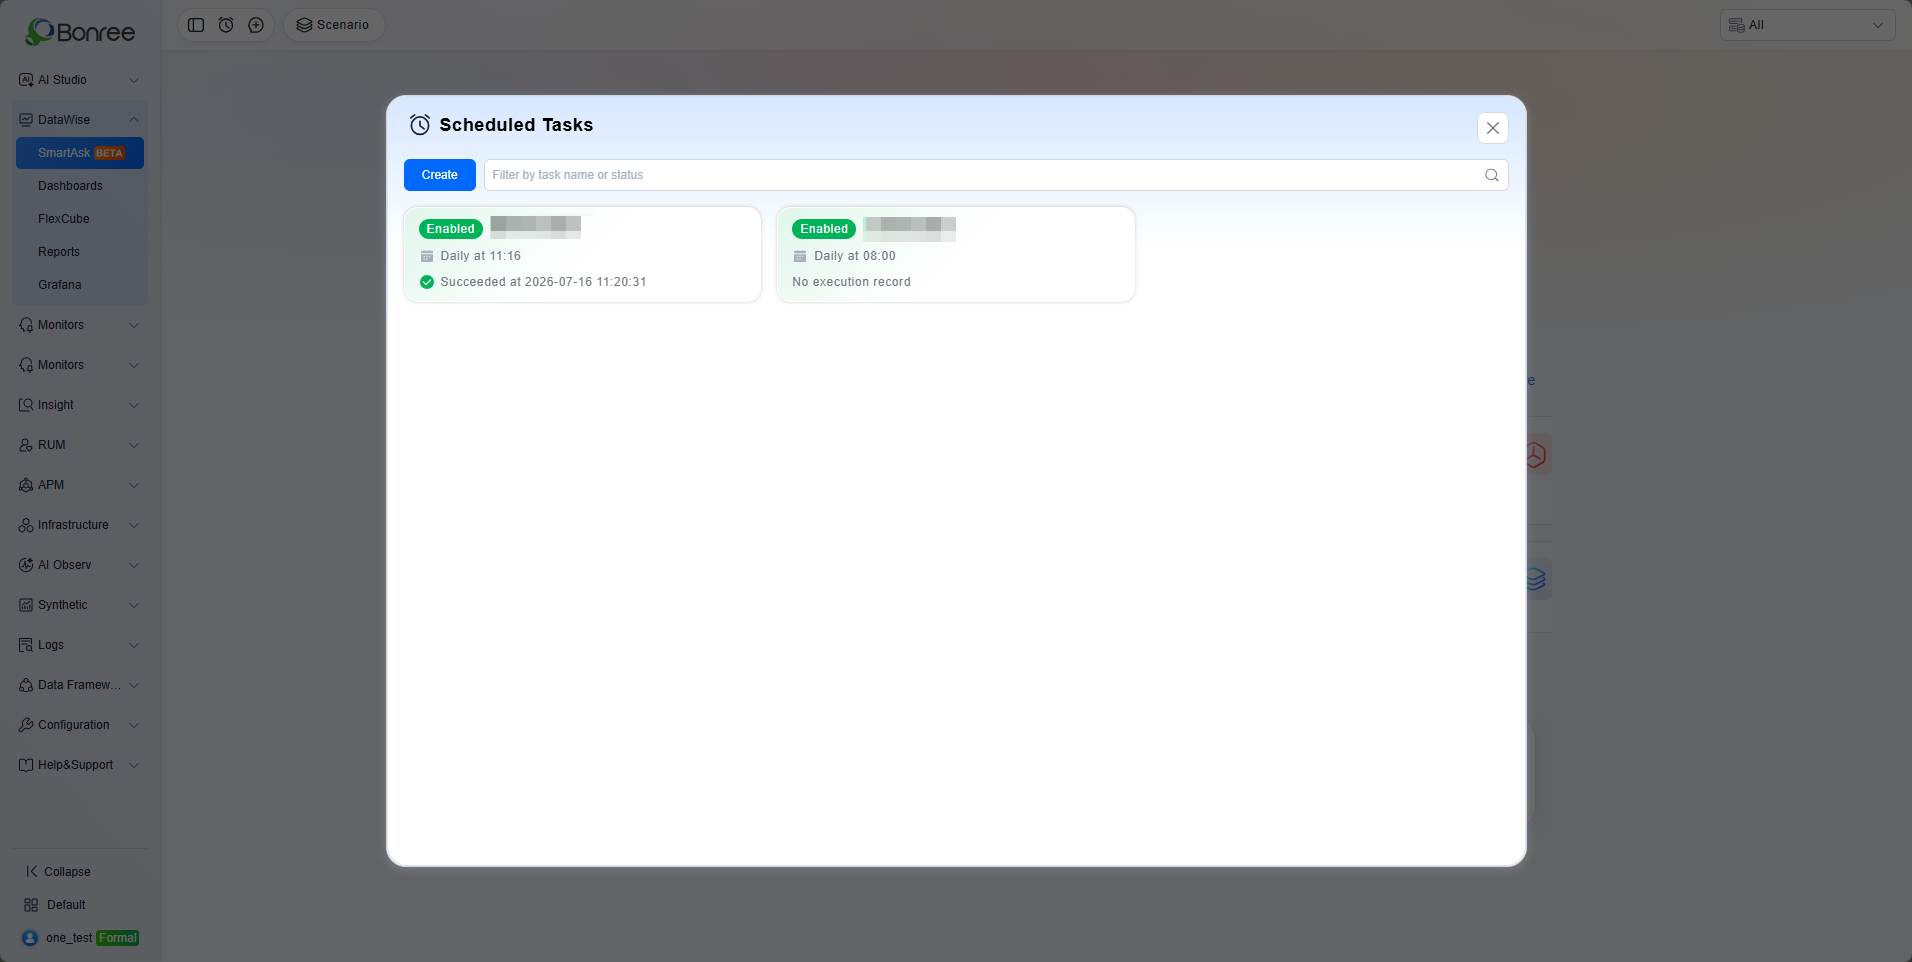
Tasks are displayed as cards with the following information:
| Field | Description |
|---|---|
| Task Name | Name of the task, for quick identification |
| Frequency | How often the task runs |
| Status | Current status of the task (Active/Paused) |
| Last Run | Start time and success/failure of the most recent execution |
By default, the list is sorted by status first (Active tasks before Paused tasks), then by the most recent execution time in descending order within each status group.
You can search tasks by name (fuzzy keyword match) and filter by status (Active/Paused).
Creating a Task
Click "Create" and fill in the following in the pop-up:
- Task Name: Required, up to 50 characters, must be unique within the same account and environment.
- Question Description: The question automatically sent to SmartAsk when the task is triggered. Supports the @ feature to reference resources (e.g., "Check the host status over the past 24 hours").
- Frequency: Two configuration modes, toggled via a switch button:
- Quick Select: Visually pick a specific run time for Hourly / Daily / Weekly / Monthly.
- Cron Expression: Enter a standard 5-field cron expression (minute hour day month weekday) and click "Parse" to validate it and preview a readable description (e.g., "✓ Parsed: Every day at 8:00"). Note: the interval must be at least 1 hour.
- Retry on Failure: Set the retry count (default 1, range 0–5) and retry interval (default 10 seconds, range 0–300 seconds).
Editing and Deleting
- Click the edit button on a task card to modify an existing task's configuration.
- Clicking delete triggers a confirmation prompt; once confirmed, the task cannot be recovered.
Enable/Disable
Each task can be toggled independently:
- Active: The task runs on schedule as configured.
- Paused: The task is suspended and will not run automatically.
A confirmation prompt appears when disabling a task.
Task Logs and Reports
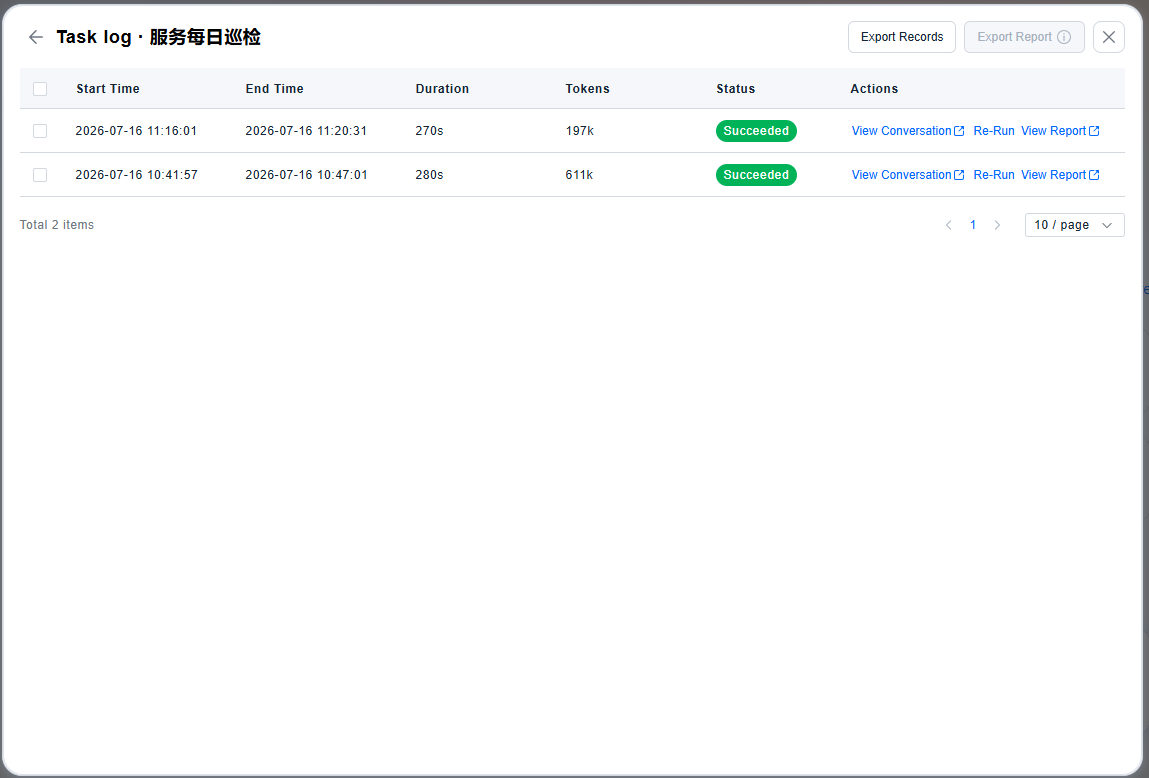
Click a task card to view its execution log, which is retained for the last 30 days and includes start time, end time, duration, tokens consumed, and execution status. For each log entry, you can:
- View Conversion: View the Q&A record of each conversion.
- Re-run: Regenerate the result based on the original session (this overwrites the original record).
- View Report: Preview the generated report online.
- Export Report: Export as PDF / Word / Markdown / HTML. You can also select multiple log entries in bulk and export them together as a compressed archive (up to 100 records per export).
Common Scenarios
Scenario: Export Weekly Report After Daily Inspection Click the Host Performance Inspection or Service Error Rate Analysis preset scenarios, and after the results are returned, click Export Report (PDF) to obtain a finished report with conclusions and charts, which can be directly sent to colleagues or superiors.
Scenario: Solidify Temporary Queries into Daily Monitoring When the result of a question is exactly what you care about every day, click Chart Preview → Add to Dashboard and select an existing dashboard for archiving; then you can view it every day by opening the dashboard without repeating the question.
Scenario: Reuse a Type of Question For repeatedly used query logic (such as "Check last week's P0 service error rate every Monday"), after completing a question, click Save to My Scenarios, and next time directly execute it with one click in My Scenarios.
Notes
Preset scenarios are verified optimal query templates. Users who are not familiar with how to organize questions are recommended to use preset scenarios first or ask follow-up questions based on them.
The resource range dropdown in the upper right corner will affect the AI's query scope. If the answer results do not match expectations, first confirm whether the range is selected as All or the target resource domain.
Save to My Scenarios saves the question and query logic, not a data snapshot. The next execution will still re-query based on the latest data.