Alerts
Prerequisites
Feature Menu Access: Availability of the alerts feature menu. Operation Permissions: read-write, and read-only permissions for alerts. Data Permissions: Access to at least one resource domain within an environment.
Overview
The alert list serves as the real-time information hub in the operational monitoring system, responsible for unifying, presenting, and managing all active and historical alerts generated by alert rule detection.
With the list as its core component, it clearly displays key information such as alert name, status, severity, and occurrence time, while also deeply integrating related entity information, metric trends, event details, in-depth analysis views, and handling records. This provides the operations team with an end-to-end work interface from perception and analysis to resolution.

Value
- Centralized Monitoring and Situational Awareness By consolidating scattered alerts into a single view, it provides the operations team with a "single source of truth" for system health status, significantly enhancing overall operational situational awareness and monitoring efficiency.
- Accelerated Problem Identification and Troubleshooting Through integrated metric trends, event details, and in-depth analysis capabilities, it provides engineers with rich contextual information, enabling them to quickly understand alert impact and trace event root causes, thereby effectively reducing the Mean Time to Repair (MTTR).
- Achieving Process Closure and Knowledge Retention Complete handling records ensure the traceability of the alert lifecycle and promote the standardization of operational processes. Meanwhile, the results of in-depth analysis and handling experience are accumulated, laying the foundation for building the team's knowledge base and proactive prevention capabilities.
Use Cases
- Daily Shift Monitoring On-duty engineers use the alert list to monitor system status in real time, quickly filter, acknowledge, and assign newly generated alerts.
- Fault Emergency Response When a failure occurs, the team uses the list to quickly locate related alerts and utilizes features such as deep analysis and metric trends for root cause analysis.
- Post-Incident Review and Analysis The operations team reviews the incident handling process by examining historical alerts and complete processing records, optimizing alert rules and response procedures.
- Resource Performance Management By analyzing the alert history and metric trends of specific entities (e.g., hosts, processes), their health and stability are assessed to facilitate capacity planning.
Operational Scenario
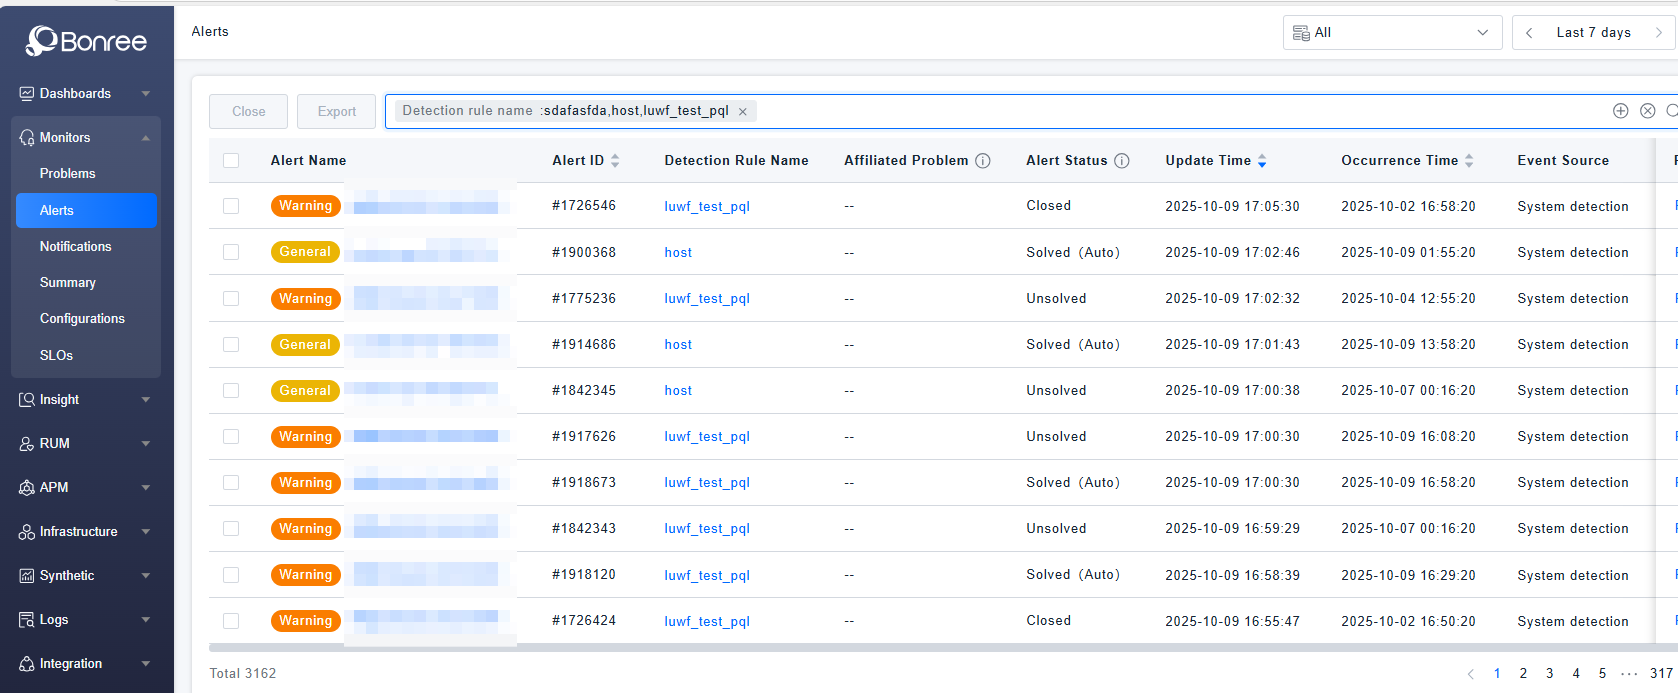
- Query: When users need to search for target alerts in the alert list, they can query based on alert fields and entity attributes in the search box. The filter component also supports recording recently used filters and provides quick filter condition template management.
- Close: When users need to close some unresolved or resolved alerts, they can batch select alerts and click the 【Close】 button to perform the operation.
- Export: When users need to export data from the alert list locally, they can batch select alerts and click the 【Export】 button. Each export generates a single CSV file, with a maximum of 100 alert records supported per export.
- Time Frame Selection: Click the time frame selector in the upper right corner to quickly select or customize a time range. It also supports selecting recently used time periods.
- Resource Domain Switching: Click the resource domain dropdown in the upper right corner to switch resource domains. The default is the "All" resource domain, which displays data from all accessible resource domains in the current environment.
Get Started
Alerts List
- Log in to Bonree ONE.
- Navigate to Intelligent Alerting > Alerts.
- Supports alert querying, closing, and exporting.
- The list supports customizable headers, provides default display fields, and allows defining display columns according to usage scenarios.

Alerts Details
-
Clicking on any row of an alert will navigate to the details page of the corresponding alert.
-
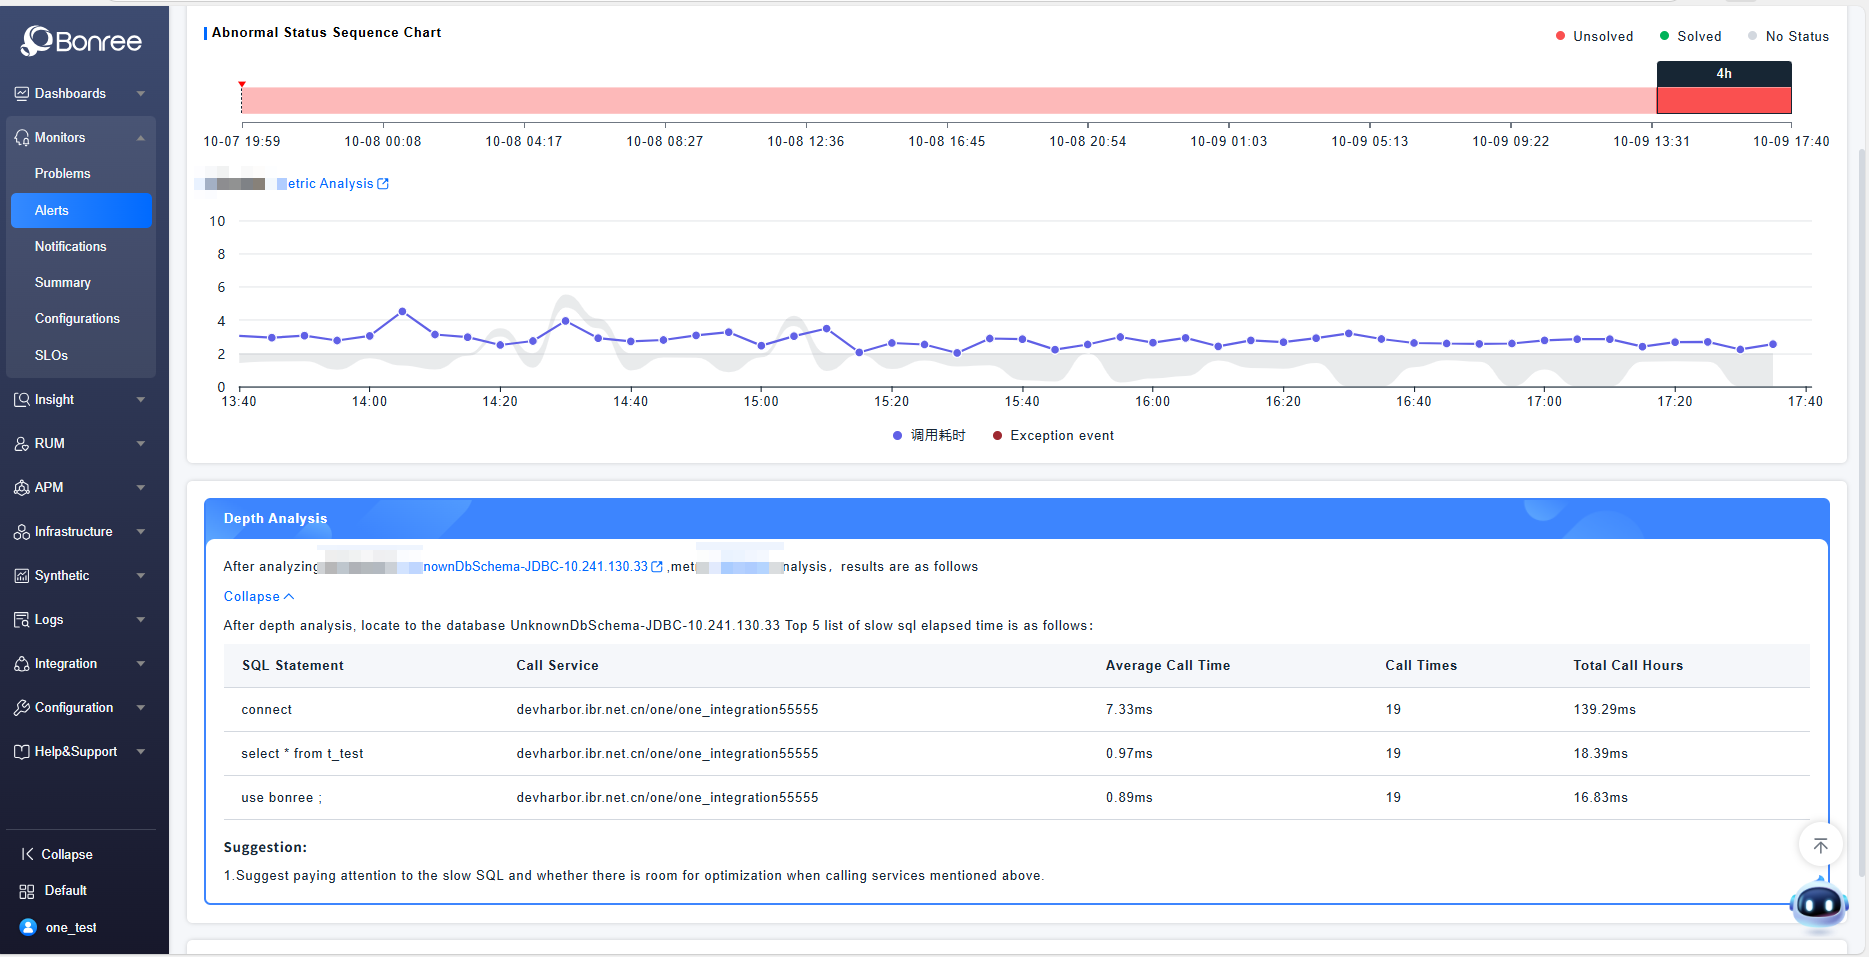
The alert details include three sections: Basic Information, In-depth Analysis, and Handling Records.
-
Basic Information contains three tabs - Abnormal Status, Event List, and Logs - which display metric trend charts, event details, and logs related to the alert entity, respectively.
-
In-depth Analysis refers to further drill-down analysis of the alert entity and metric anomalies, providing evidence related to the abnormality to help quickly locate and resolve the issue.
-
Handling Records display the complete history from alert generation, notification triggering, suppression, to status changes, until the alert is closed.
