Call Chain Collection Configuration
The Call Chain Collection Configuration is used to set collection rules for call chain data in the system. By configuring parameters such as collection mode, collection rate, maximum number of collected spans per trace, and request parameters, you can precisely control the collection behavior of call chain data. While ensuring the acquisition of valid call chain information for problem troubleshooting and performance analysis, it also balances system resource consumption reasonably, avoiding excessive pressure on normal system operation due to over-collection.
This module supports custom collection rules and default collection rules configuration. Custom collection rules take priority over default collection rules; when a request does not match any custom rule, the default rule takes effect.
Usage Scenarios
- Daily Operations: Use intelligent sampling or intelligent intensity mode to continuously retain call chain samples at a low collection rate, supporting service performance trend analysis and daily inspections.
- Troubleshooting: Enable "Collect All Error and Slow Call Chains" to ensure error and slow request call chains are not missed without significantly increasing the collection rate, quickly restoring fault links.
- Fine-grained Control: Create custom rules for core services and high-concurrency services respectively, with differentiated configuration of collection intensity, stack collection, CPU time consumption collection, and other parameters.
- Compatibility Adaptation: Disable "Append Trace ID to Response Header" by service dimension to resolve business exceptions caused by response header compatibility issues with third-party clients.
Getting Started
Navigate to Deployment Configuration → Rule Configuration → Data Collection → Call Chain to view the global configuration and rule list for call chain collection.
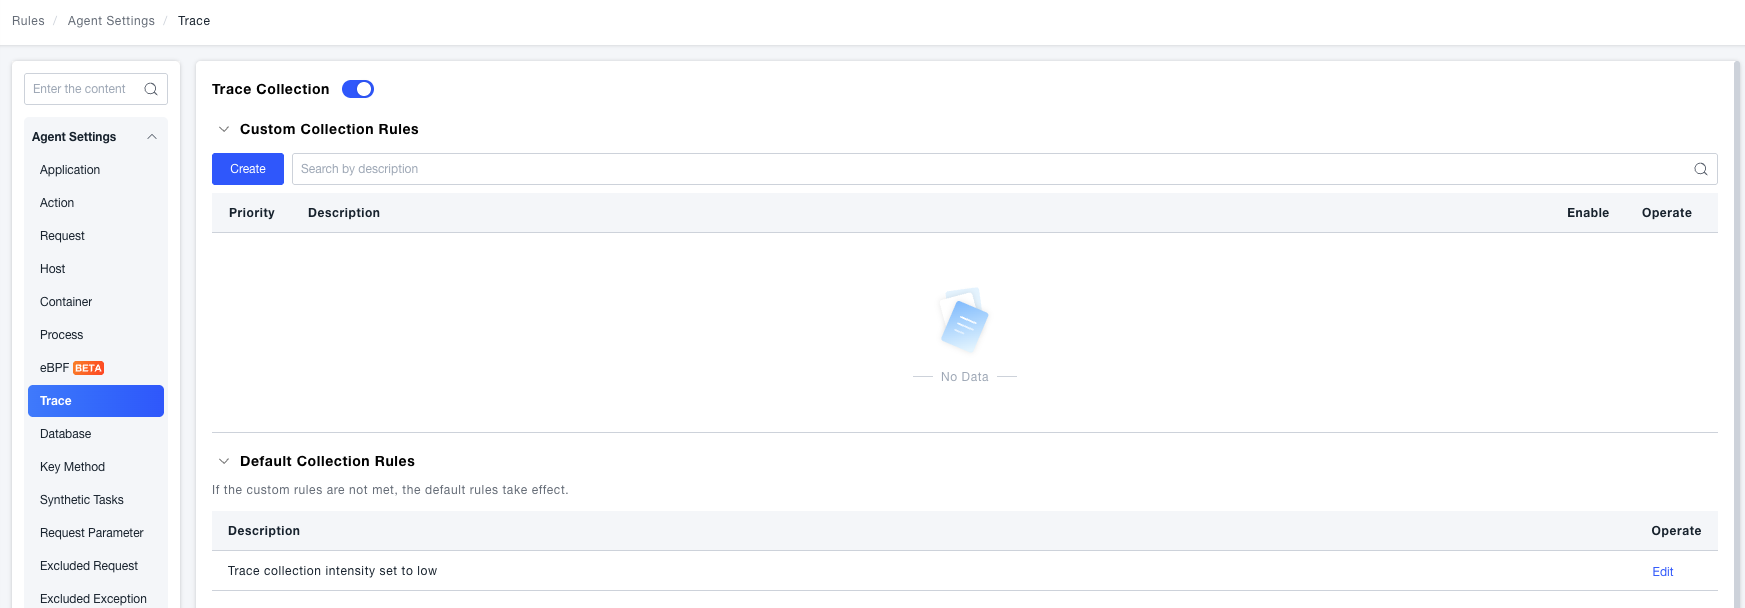
Call Chain Collection Master Switch
The Call Chain Collection master switch at the top of the page enables or disables call chain data collection globally. When disabled, the system stops collecting call chain data.
Custom Collection Rules
The custom collection rules list displays fields such as Priority, Description, Enabled, and Operations (Edit, Delete), supporting search by description keywords.
- Rules are matched from top to bottom by priority; you can adjust the priority order by dragging.
- Each rule supports independent enabling or disabling.
- Click Create to add a new custom rule; click Edit or Delete to manage existing rules.
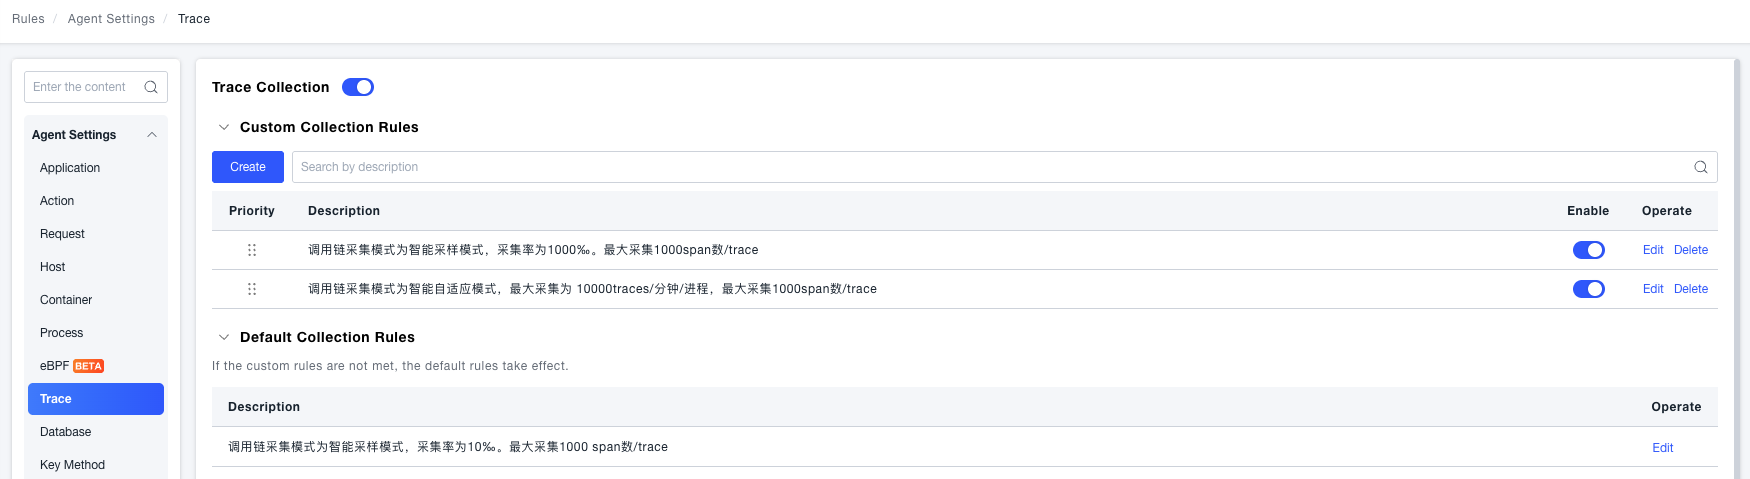
Default Collection Rules
The default collection rules serve as a fallback strategy and take effect when a request does not match any custom rule. The list shows "If no custom rule is matched, the default rule takes effect", and only Edit operation is supported (cannot be deleted).
Configure Custom Collection Rules
Click the Create or Edit button to slide in the "Create Custom Collection Rule" / "Edit Custom Collection Rule" drawer from the right.
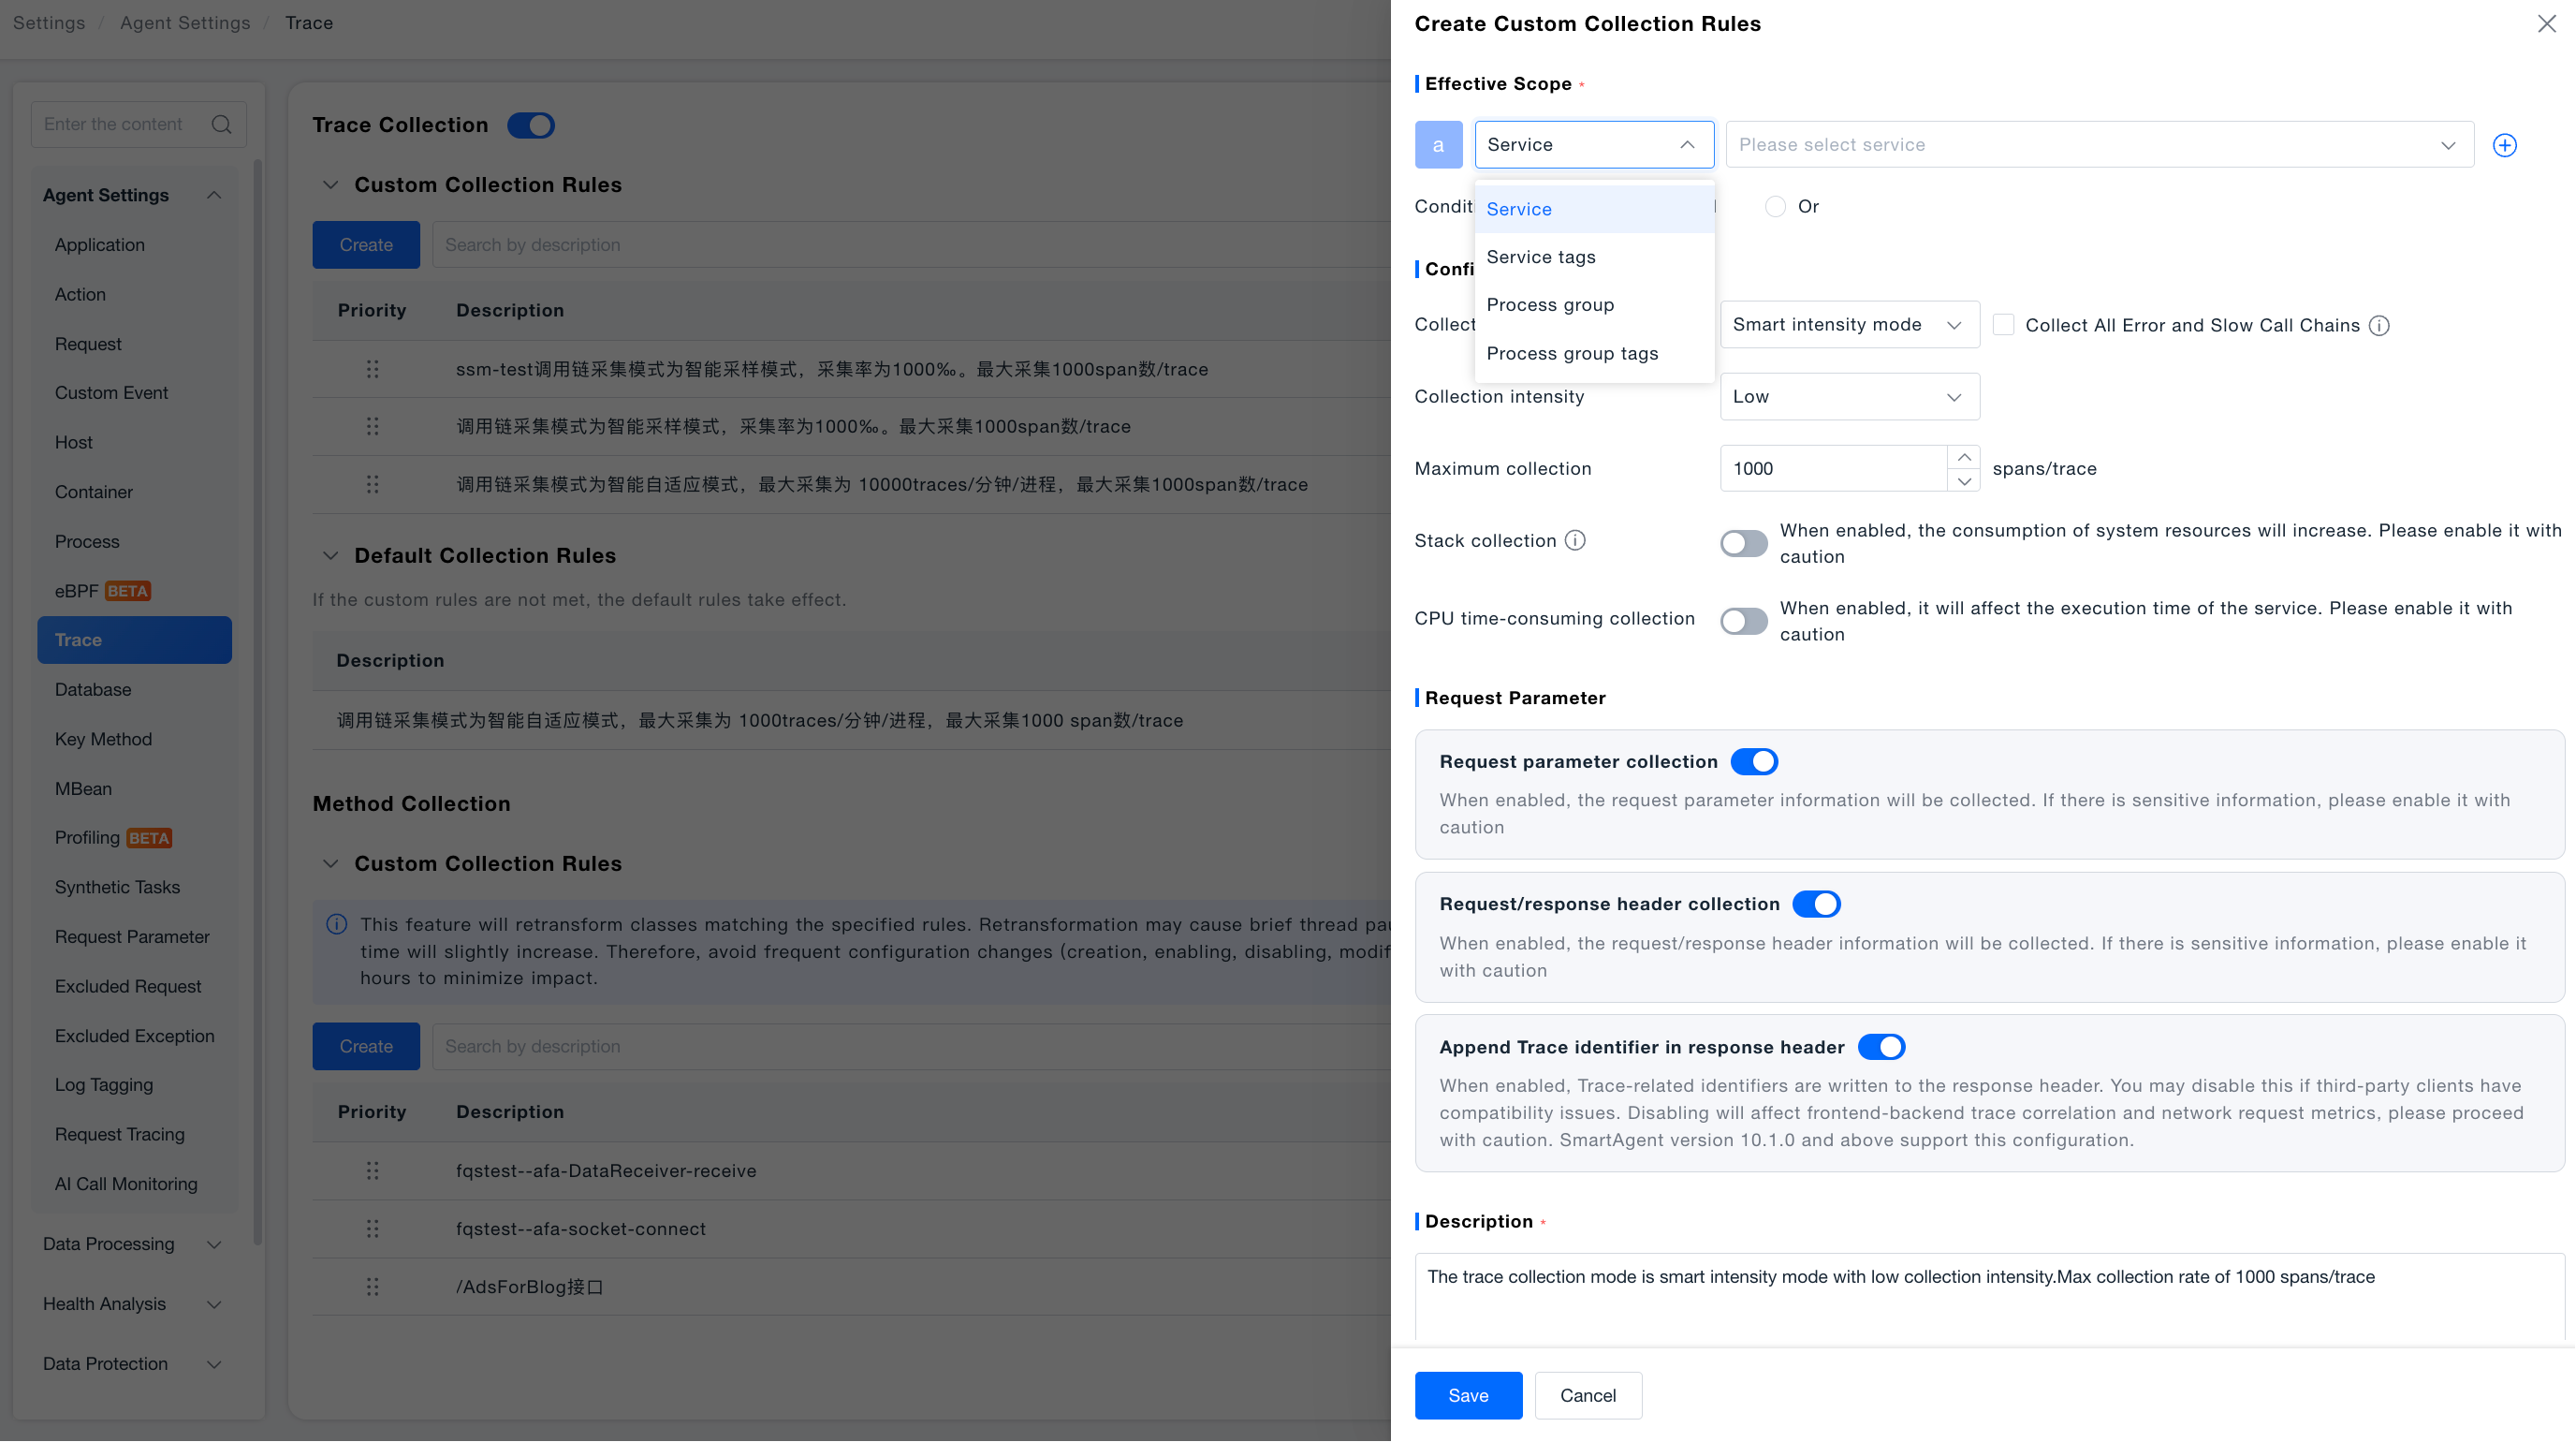
Effective Scope
- Required, supports selecting effective scope by Service, Service Tag, Process Group, Process Group Tag.
- Supports adding multiple conditions, click "+" to add a new condition row; condition relationships can be AND or OR.
- Condition operators support Exact Match and other matching methods.
Configuration Items
"Configuration Items" is a required area, with the core configuration being Collection Mode. Different collection modes correspond to different additional parameters, see below for details.
Collection Mode Overview
| Collection Mode | Additional Parameters | Description |
|---|---|---|
| No Collection | None | Disable call chain collection within this scope |
| Threshold Mode | Max Collection (span count/trace), Stack Collection, CPU Time Consumption Collection | Collect all raw data related to call chains, generate call chains from all slow and error request data when business ends |
| Intelligent Sampling | Collection Rate (‰), Max Collection (span count/trace), Stack Collection, CPU Time Consumption Collection | Randomly sample and generate call chains by collection rate; supports enabling "Collect All Error and Slow Call Chains" |
| Intelligent Intensity | Collection Intensity (Low/Medium/High), Max Collection (span count/trace), Stack Collection, CPU Time Consumption | Periodically collect call chains by collection intensity; supports enabling "Collect All Error and Slow Call Chains" |
| Intelligent Adaptive | Max Collection (traces/minute/process), Max Collection (span count/trace), Stack Collection, CPU Time Consumption | Balance collection ratio across businesses without exceeding the maximum collection limit |
SmartAgent 10.1.0 and above versions support the "Collect All Error and Slow Call Chains" switch in Intelligent Sampling Mode and Intelligent Intensity Mode, as well as the "Append Trace ID to Response Header" configuration.
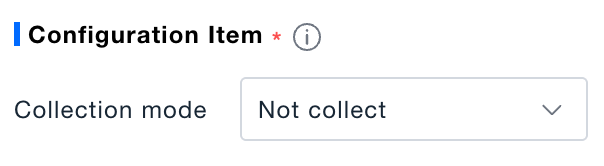
No Collection
After selecting No Collection, services within the rule matching scope will no longer collect call chain data, with no additional configuration items.
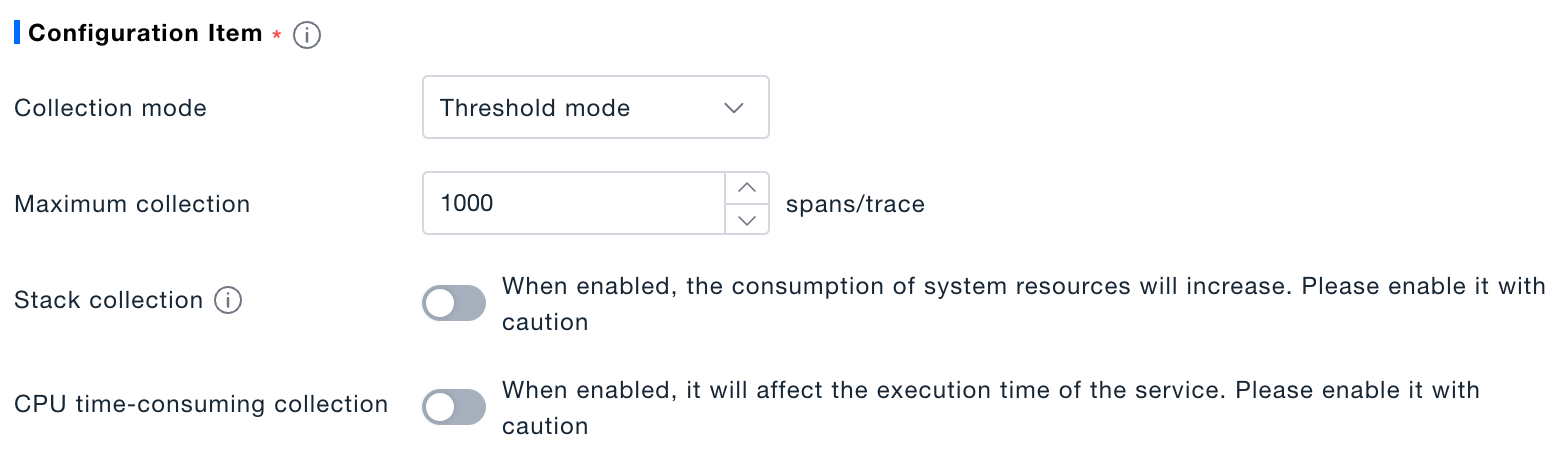
Threshold Mode
In Threshold Mode, the probe collects all raw data related to call chains. When the business ends, it generates call chains from the data of all slow requests (slower and very slow requests determined by the service interface response time threshold) and error requests.
Configurable parameters:
- Max Collection (span count/trace): Limits the maximum number of Span nodes that can be collected for a single Trace, default is 1000.
- Stack Collection, CPU Time Consumption Collection: See Public Configuration Description below.
Intelligent Sampling Mode
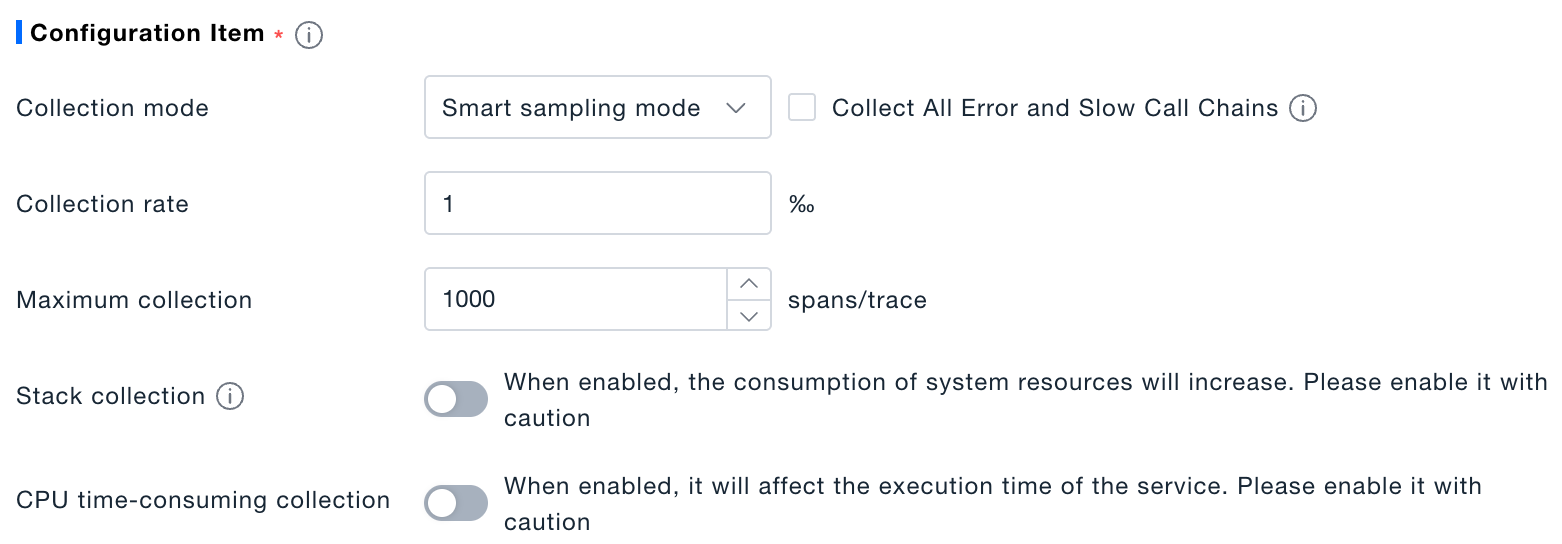
Generate call chains by randomly sampling at the collection rate (‰). In SmartAgent 10.1.0 and above versions, random sampling is performed by default at the collection rate.
Configurable parameters:
- Collection Rate (‰): Controls the random sampling ratio for healthy requests, in per thousand (‰).
- Max Collection (span count/trace): Limits the maximum number of Span nodes that can be collected for a single Trace, default is 1000.
- Collect All Error and Slow Call Chains (optional switch, default off): Located below the collection mode dropdown, only displayed in Intelligent Sampling Mode.
"Collect All Error and Slow Call Chains" Switch Logic:
| Switch Status | Collection Logic |
|---|---|
| Off (Default) | Randomly sample all requests at the set collection rate (‰) to generate call chains |
| On | Healthy requests are randomly sampled and reported at the set collection rate; error and slow request call chains are reported in full without sampling rate restrictions |
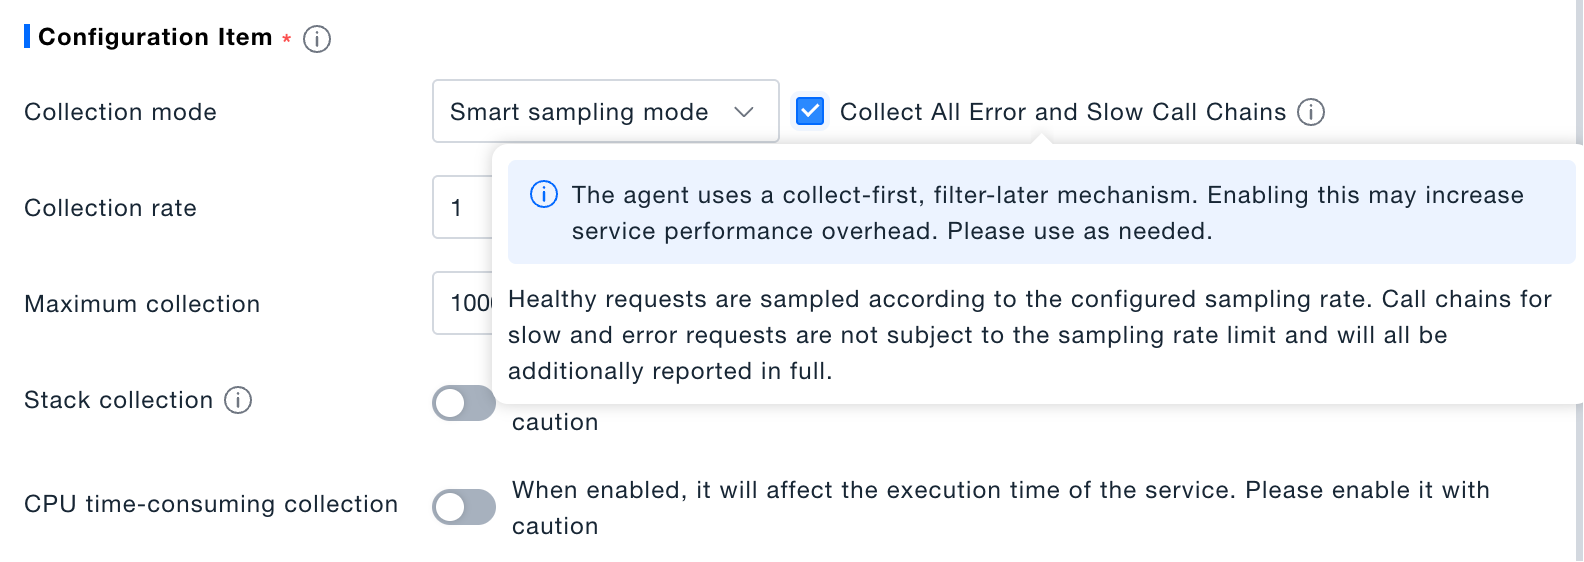
The probe uses a collect-first, filter-later mechanism. Enabling "Collect All Error and Slow Call Chains" may increase service performance consumption, please use as needed.
Intelligent Intensity Mode
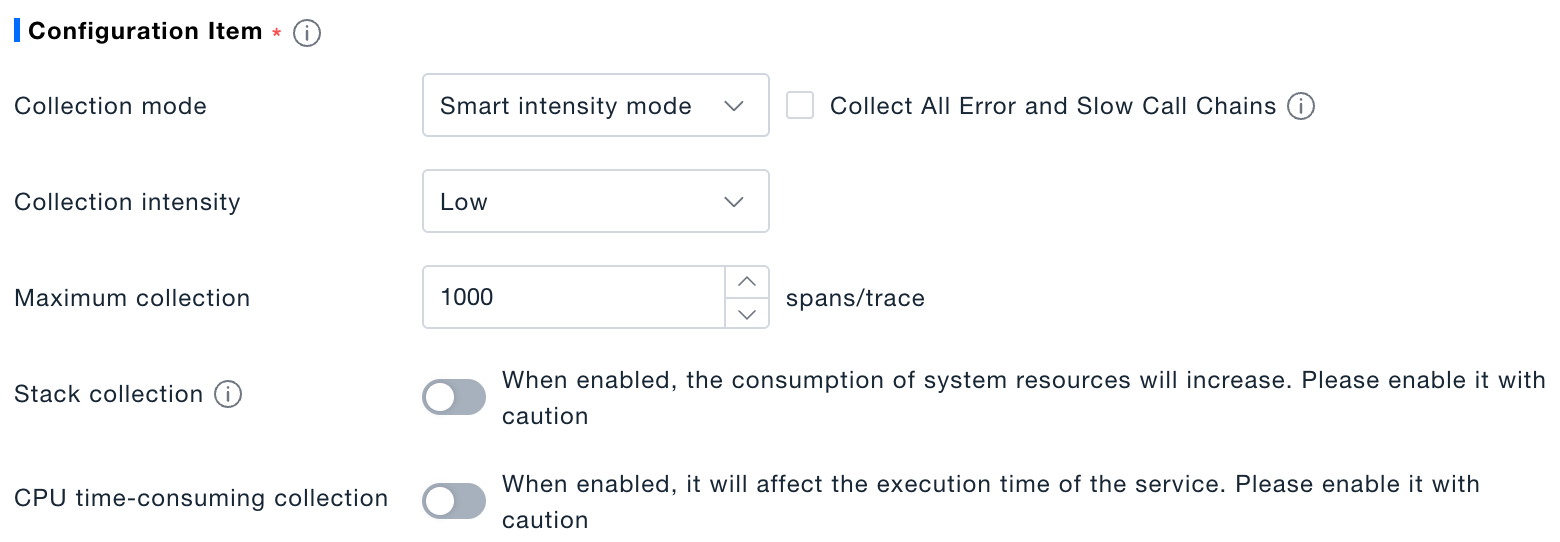
Collect call chains based on collection intensity. For each entry business, collect call chains for the first n requests in each 5-second collection cycle, where n corresponds to 1, 2, 3 for low, medium, and high intensity respectively, with default intensity being Low.
Configurable parameters:
- Collection Intensity: Provides three preset options (Low, Medium, High), directly controlling the number of requests hit within each collection cycle.
- Max Collection (span count/trace): Limits the maximum number of Span nodes that can be collected for a single Trace, default is 1000.
- Collect All Error and Slow Call Chains (optional switch, default off): Located below the collection mode dropdown, only displayed in Intelligent Intensity Mode.
Collection Intensity Description:
- Low: Collect the first 1 request per collection cycle (5s), minimal probe performance impact, suitable for ultra-high concurrency and performance-sensitive core businesses.
- Medium: Collect the first 2 requests per collection cycle, balances link sample coverage and service performance overhead, recommended for most businesses.
- High: Collect the first 3 requests per collection cycle, most complete link sample data, suitable for pre-release environments, low-traffic businesses, and online issue reproduction scenarios.
"Collect All Error and Slow Call Chains" Switch Logic:
| Switch Status | Collection Logic |
|---|---|
| Off (Default) | Hit requests by intensity, generate complete call chains for hit requests; no reporting for non-hit requests |
| On | On the basis of hit collection logic, for non-hit requests containing error or slow nodes, additionally report the call chains of these nodes (topology only contains error/slow nodes themselves, no complete upstream/downstream nodes) |
Taking intensity "Low" as an example, hit/report examples after the switch is turned on:
| Request | Node Link | Status | Hit? | Report Result |
|---|---|---|---|---|
| A | s1→s2→s3 | All Normal | ✓ Hit | Report complete link |
| B | s1→s2(Error)→s3(Error) | With Error | ✗ Miss | Additional report s2, s3 error nodes |
| C | s1→s2(Slow)→s3 | With Slow | ✗ Miss | Additional report s2 slow node |
| D | s1→s2→s3 | All Normal | ✗ Miss | No report |
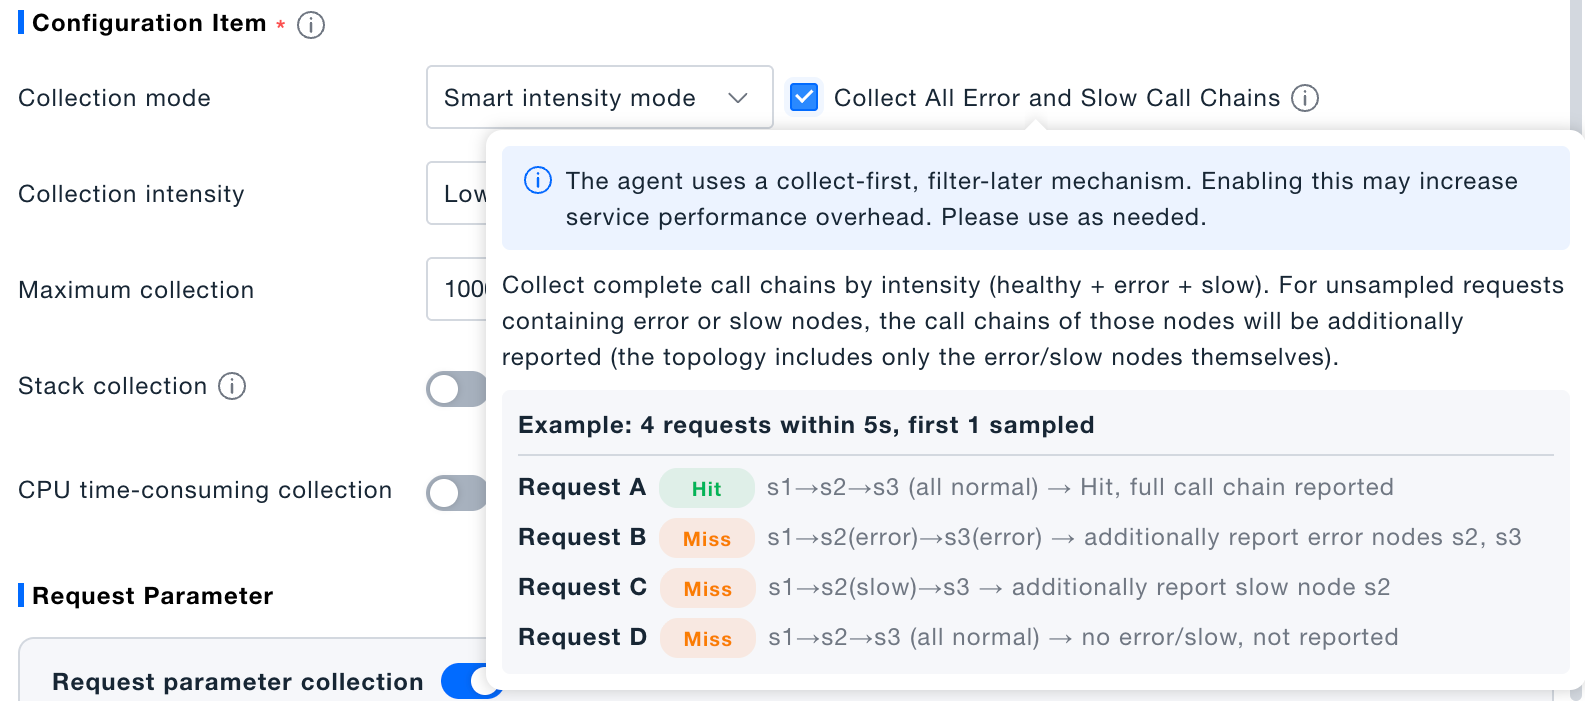
The probe uses a collect-first, filter-later mechanism. Enabling "Collect All Error and Slow Call Chains" may increase service performance consumption, please use as needed.
It is recommended to check "Collect All Error and Slow Call Chains" in online production environments to prioritize retaining fault-related links, only compressing normal traffic through sampling; for high-throughput fault-free businesses and stress testing scenarios, you can uncheck as needed.
Intelligent Adaptive Mode
Under the premise of ensuring no exceeding the maximum collection limit, collection is balanced across businesses. The specific rules are as follows:
- Maximum Collection Limit: Defines the upper limit of the total number of collections per minute (traces/minute/process).
- Dynamically Adjust Collection Ratio: Dynamically adjust the collection ratio according to the access volume of each business:
- Each type of business is collected at least once;
- Businesses with large access volumes have a relatively lower collection ratio;
- Businesses with small access volumes have a relatively higher collection ratio.
Configurable parameters:
- Max Collection (traces/minute/process): Limits the maximum total number of Traces collected per minute per process.
- Max Collection (span count/trace): Limits the maximum number of Span nodes that can be collected for a single Trace, default is 1000.
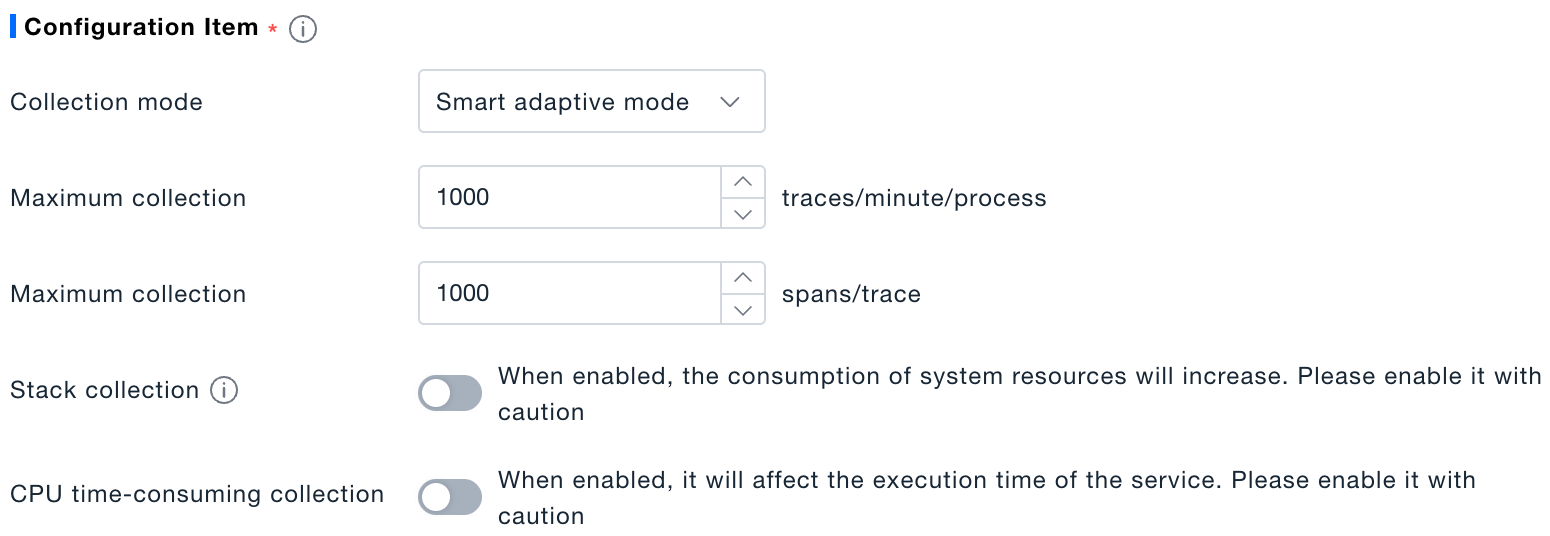
Stack Collection (Default Off)
- Function: When enabled, reported Spans will include code stack information, facilitating code error location and performance bottleneck identification.
- Resource Risk: Stack information serialization and reporting will significantly increase service CPU and memory resource consumption, not recommended for regular use in production core businesses.
- Usage Scenario: Only temporarily enabled during deep troubleshooting of interface errors and performance issues, and turned off promptly after investigation is completed.
When Stack Collection is enabled, stacks will be collected in the following cases:
- Collected when framework methods have exceptions
- Collected when framework method execution time exceeds 100ms
- Maximum 10 collections per interface
Note: Methods in the code stack are not all methods, but partial framework methods collected by the platform.
CPU Time Consumption Collection (Default Off)
- Function: When enabled, the probe will count the actual CPU time consumed by code fragments and interfaces, supplementing CPU dimension observation metrics in call chains.
- Performance Risk: Collecting CPU clock will intrude into business execution flow, prolonging overall interface response time. Prohibited for long-term use in high QPS services.
- Usage Scenario: Only used for temporary troubleshooting of CPU-related issues such as high CPU usage, thread dead loops, and abnormal code computation time.
When enabled, system resource consumption ratio will increase, use with caution (Stack Collection); when enabled, service execution time will be affected, use with caution (CPU Time Consumption Collection).
Max Collection (span count/trace) Description
A numeric input configuration item with a default value of 1000, used to limit the maximum number of Span nodes that can be collected for a single complete call chain (Trace):
- Collection Rule: When the total number of Span nodes generated by a single request exceeds this threshold, the excess portion will be truncated and discarded.
- Tuning Reference: Multi-layer microservice nesting, batch loop call businesses can appropriately increase the value to avoid link information truncation and loss; simple monolithic interfaces and performance-sensitive services can maintain the default value or reduce the threshold to reduce the data volume of a single Trace.
Request Parameters
| Configuration Item | Description | Default |
|---|---|---|
| Request Parameter Collection | When enabled, request parameter information will be collected. Use with caution if there is sensitive information | On |
| Request/Response Header Collection | When enabled, request/response header information will be collected. Use with caution if there is sensitive information | On |
| Append Trace ID to Response Header | When enabled, Agent injects x-br-response and traceresponse parameters into HTTP response headers for link tracing and front-end/back-end correlation; supported in SmartAgent 10.1.0 and above | On |
"Append Trace ID to Response Header" Switch Behavior:
| Status | Behavior |
|---|---|
| On (Default) | Agent injects Trace ID into HTTP response headers for link tracing and RUM front-end/back-end correlation |
| Off | Agent stops injecting the above parameters into response headers, resolving third-party client exceptions caused by response header compatibility issues |
Disabling "Append Trace ID to Response Header" will affect RUM front-end/back-end link correlation, please operate with caution.
Description
Required, automatically generated by the system in real-time based on the current configuration, and synchronized to the description column of the rule list after saving. Examples:
- Call chain collection mode is Intelligent Sampling, collection rate is 5‰. Max collection is 1000 span count/trace. Collect All Error and Slow Call Chains is enabled
- Call chain collection mode is Intelligent Intensity, collection intensity is Low. Max collection is 1000 span count/trace
- Call chain collection mode is Intelligent Adaptive, max collection is 1000 traces/minute/process, max collection is 1000 span count/trace
Click Save to complete rule creation or editing.
Configure Default Collection Rules
Click the Edit button of the default collection rule to expand the edit drawer. The configuration items are the same as custom collection rules, but without "Effective Scope" condition configuration.
- Description: Required, automatically generated by the system based on the configuration.
- Save: Click Save to complete editing the default collection rule.
Collection Mode Quick Reference
- No Collection: Disable call chain collection within this scope.
- Threshold Mode: Collect all raw data related to call chains. After the business ends, generate call chains from the data of all slow requests (slower and very slow requests determined by the service interface response time threshold) and error requests.
- Intelligent Sampling Mode: Collect call chains at the set collection rate (‰). In SmartAgent 10.1.0 and above probe versions, randomly sample and generate call chains at the collection rate by default. After enabling "Collect All Error and Slow Call Chains", error and slow call chains are collected in full, while healthy requests (all requests excluding slow and error requests) are sampled and reported at the collection rate.
- Intelligent Intensity Mode: Collect call chains based on collection intensity. For each entry business, collect call chains for the first n requests in each 5-second collection cycle, where n corresponds to 1, 2, and 3 for low, medium, and high intensity respectively; default intensity is Low. Supports enabling "Collect All Error and Slow Call Chains" to additionally report non-hit requests containing error/slow nodes.
- Intelligent Adaptive Mode: Balance collection across businesses without exceeding the maximum collection limit. The maximum collection limit defines the upper limit of total collections per minute; dynamically adjust collection ratio, ensuring each type of business is collected at least once, with lower collection ratios for high-traffic businesses and higher ratios for low-traffic businesses.