2026
This document covers the version iteration details of multiple core components of the ONE platform in 2026, focusing on three key dimensions: new features, functional optimizations, and bug fixes.
The components involved include ONE_ALERT, ONE_ANALYSIS, ONE_LOG, ONE_EVENT, ONE_APM, ONE_ETL, ONE_STM, ONE_RUM, ONE_IAM, ONE_CMDB, ONE_TAG, ONE_Pilot, ONE_CHAT, covering critical areas such as alert configuration management, data visualization analysis, log collection and parsing, event tracking and correlation, application performance monitoring, multi-source data extraction, transformation and loading, and end-user experience monitoring.
The following table provides the Chinese-English comparison and brief product introductions for each product component:
| Product Component | Product Module | Functional Introduction |
|---|---|---|
| ONE_AI | AI Studio | The ONE Platform AI Capability Hub centrally manages models, tools, Skills, and knowledge bases, supporting both workflow-based and autonomous decision-making agents. Rui AI serves as the unified conversational entry, integrating intent routing, multi-agent invocation, Skill execution, and fault diagnosis for scenarios such as alert diagnosis, intelligent Q&A, PromQL generation, and automated inspection reports. Together with diagnosis policy configuration, history tracking, and statistical analysis, it forms an AI operations closed-loop of "trigger → execute → evaluate → optimize." |
| ONE_ALERT | Intelligent Alert | Responsible for platform alert rule configuration, alert generation, alert notification, and alert status management (e.g., manual closure, batch processing). Supports alert data filtering, permission isolation, and cross-resource domain alert handling, helping operations personnel promptly detect and respond to system anomalies. |
| ONE_ANALYSIS | Data Analysis (Data Reporting) | Provides data visualization and analysis capabilities such as dashboard configuration, data cube construction, and automatic report generation. Supports custom chart displays, multi-dimensional data filtering, and report email push, helping users intuitively grasp system operation data and business trends. |
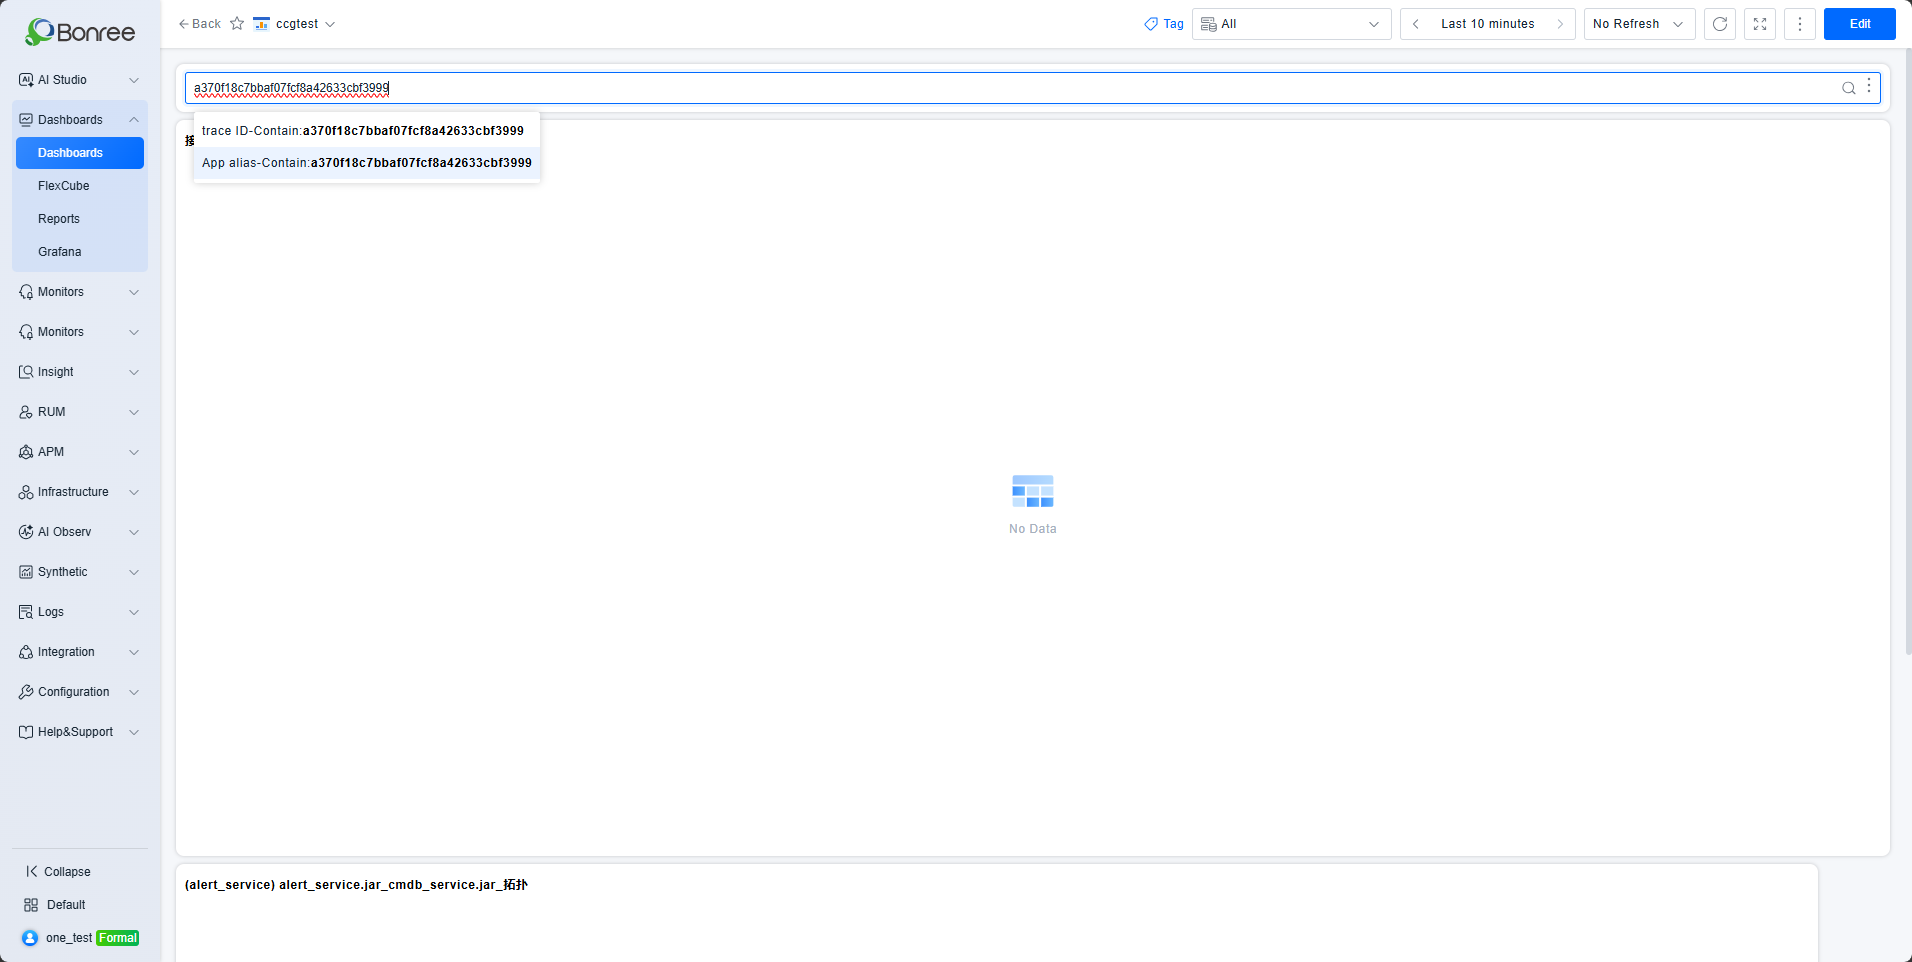
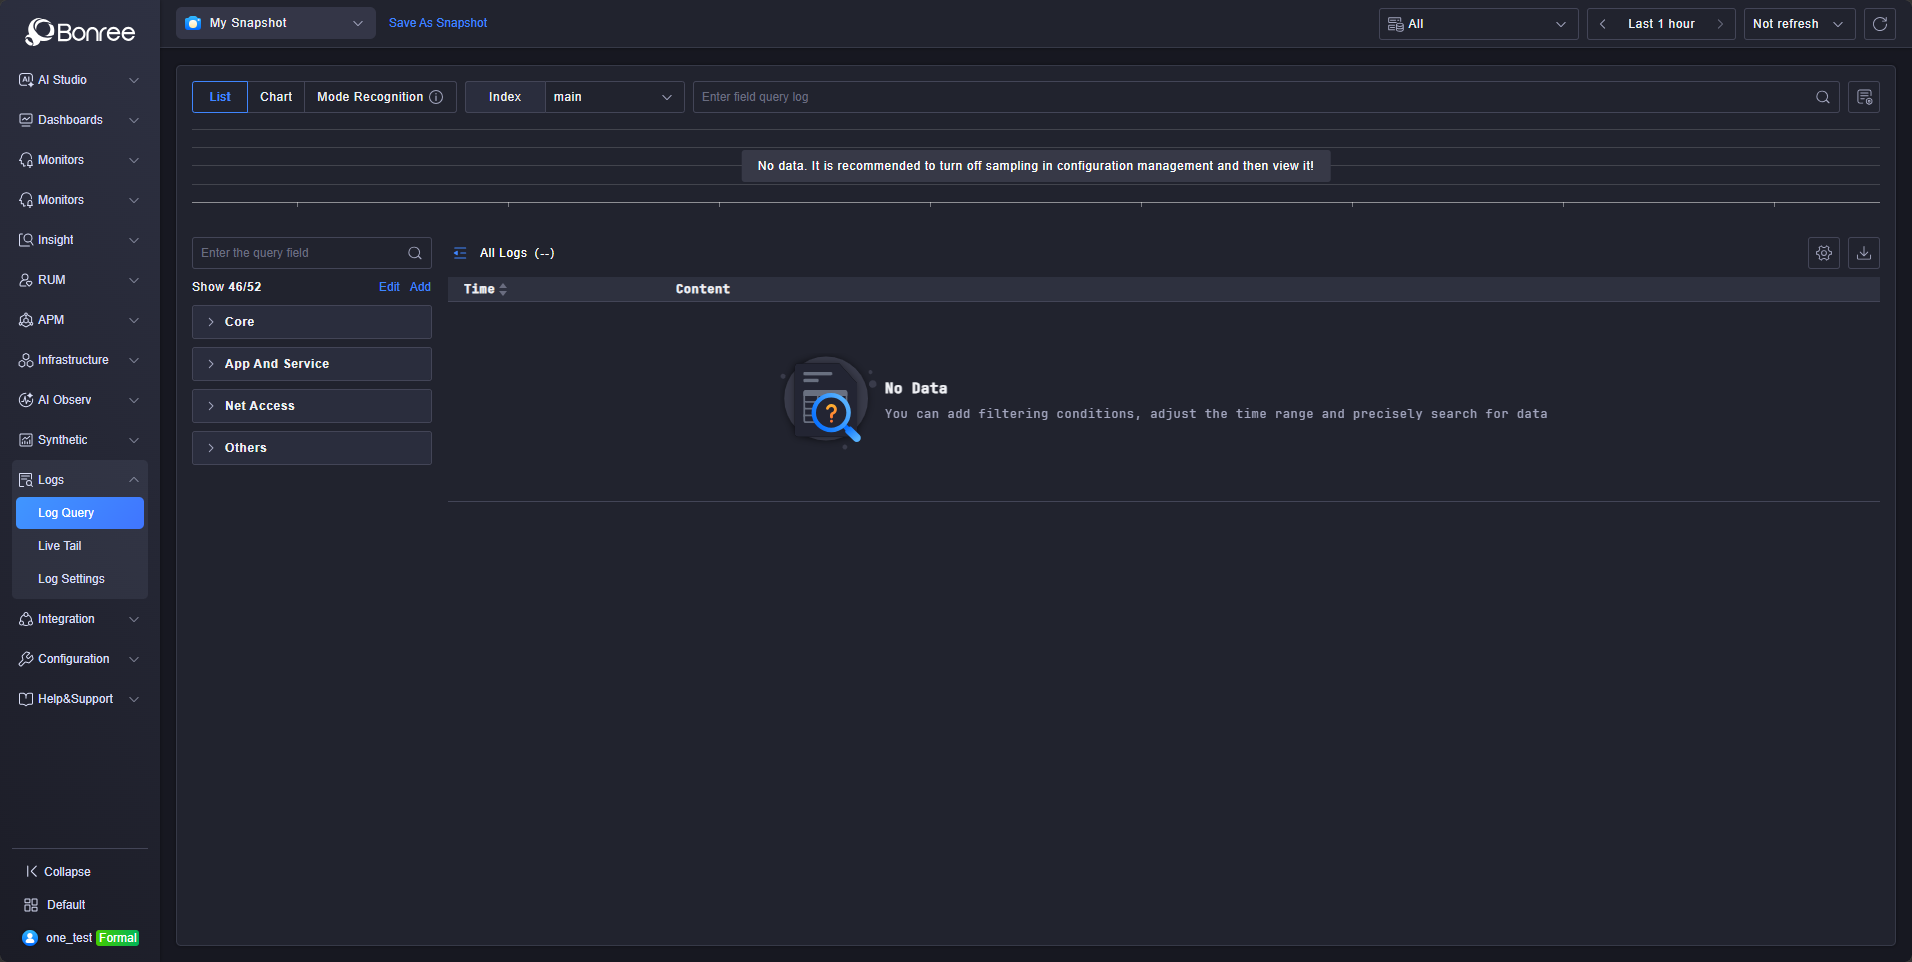
| ONE_LOG | Log Analysis | Implements log collection (including in-depth monitoring process logs, third-party log ingestion), log query, index management, and data processing (e.g., JSON parsing, grok rule processing). Supports filtering logs by service and data center, aiding problem troubleshooting and log auditing. |
| ONE_EVENT | Event Management | Responsible for event data collection, filtering, display, and correlation analysis. Supports filtering by data center and event attributes, standardizes instance field display specifications, and enables event-alert association and jumping, assisting in tracking various system events (e.g., deployment, failure events). |
| ONE_APM | Application Performance Monitoring (System Services) | Focuses on application performance observation, covering service identification, call chain tracing, process monitoring, container and K8s resource monitoring, and probe management. Supports call chain detail analysis and performance metric statistics, aiding in locating application performance bottlenecks and service dependency issues. |
| ONE_ETL | Data Integration | Implements the ingestion, processing, and storage of multi-source data (e.g., Alibaba Cloud service metrics, SkyWalking trace data, SNMP protocol data). Supports data flow topology editing and data localization storage, adapting to multi-region and multi-data center data architectures. |
| ONE_STM | Availability Detection (Monitoring Tasks) | Responsible for creating and managing monitoring points and monitoring tasks. Supports resource organization by tags, records search conditions and quick filter configurations, enabling continuous monitoring of system key nodes to ensure business continuity. |
| ONE_RUM | Digital Experience | Focuses on performance and experience monitoring for end-user applications (Web, Douyin Mini Programs, HarmonyOS applications, etc.), including page load speed, JS error statistics, and user session analysis, optimizing end-user experience. |
| ONE_IAM | Identity and Access Management | Manages platform user identities, permissions, licenses, and security settings. Supports user list filtering, custom headers, multi-language adaptation, and login verification (e.g., SMS verification codes). Implements centralized permission management in the main center to ensure platform access security. |
| ONE_CMDB | Configuration Management (Data Model) | Stores configuration information and lifecycle status of system resource instances (hosts, services, containers, etc.). Supports resource tag management, instance relationship maintenance, and unified management of instances across multiple data centers, providing foundational resource data support for other components. |
| ONE_TAG | Tag Management | Provides tag creation, batch association/disassociation, and automatic propagation functions. Supports filtering resource instances by tags, implementing resource permission control and classification management, adapting to multi-region and multi-data center resource tag synchronization requirements. |
| ONE_Pilot | ONE Platform Monitoring and Operations (SkyEye Platform) | Provides global topology view of ONE platform components, Nginx container traffic analysis (inbound/outbound traffic, request count statistics), manages Kafka component OOM monitoring alert policies and ClickHouse data storage periods, assisting in overall ONE platform operations and traffic control. |
| ONE_CHAT-SERVICE / ONE_CHAT | XiaoRui Assistant | Integrates the DeepSeek-R1 large language model to provide intelligent Q&A services such as platform usage instructions and operations knowledge queries. Supports generating PQL query statements, improving operations personnel's problem-solving efficiency. |
| ONE_CORE-LINK | Observability Insights (Core-Link) | Provides core link topology orchestration and panoramic observation capabilities. Supports custom service call relationships, combining monitoring, log, and trace data to achieve cross-service problem localization and fault diagnosis, aiding efficient operational decision-making. |
ONE 4.0.0.0 发布时间:2026/04/26
【AI】
New Features
- AI Studio Launched: Added the AI Studio module as the central AI capability hub of the ONE platform, centrally managing models, tools, Skills, knowledge bases, and other foundational resources, providing end-to-end capability support for agents in reasoning, action, and retrieval.
-
Agent Hub: Supports two construction methods: workflow and autonomous decision-making. Workflows are suitable for tasks with fixed execution paths, while autonomous decision-making supports multi-round LLM-driven reasoning, addressing diverse O&M scenarios from fixed processes to dynamic decision-making. Built-in general-purpose agents are available out-of-the-box, covering high-frequency scenarios such as fault diagnosis, knowledge Q&A, PromQL generation, and data observation. Users can also build their own personal agents, integrating MCP tools, Skills, and dedicated knowledge bases.
-
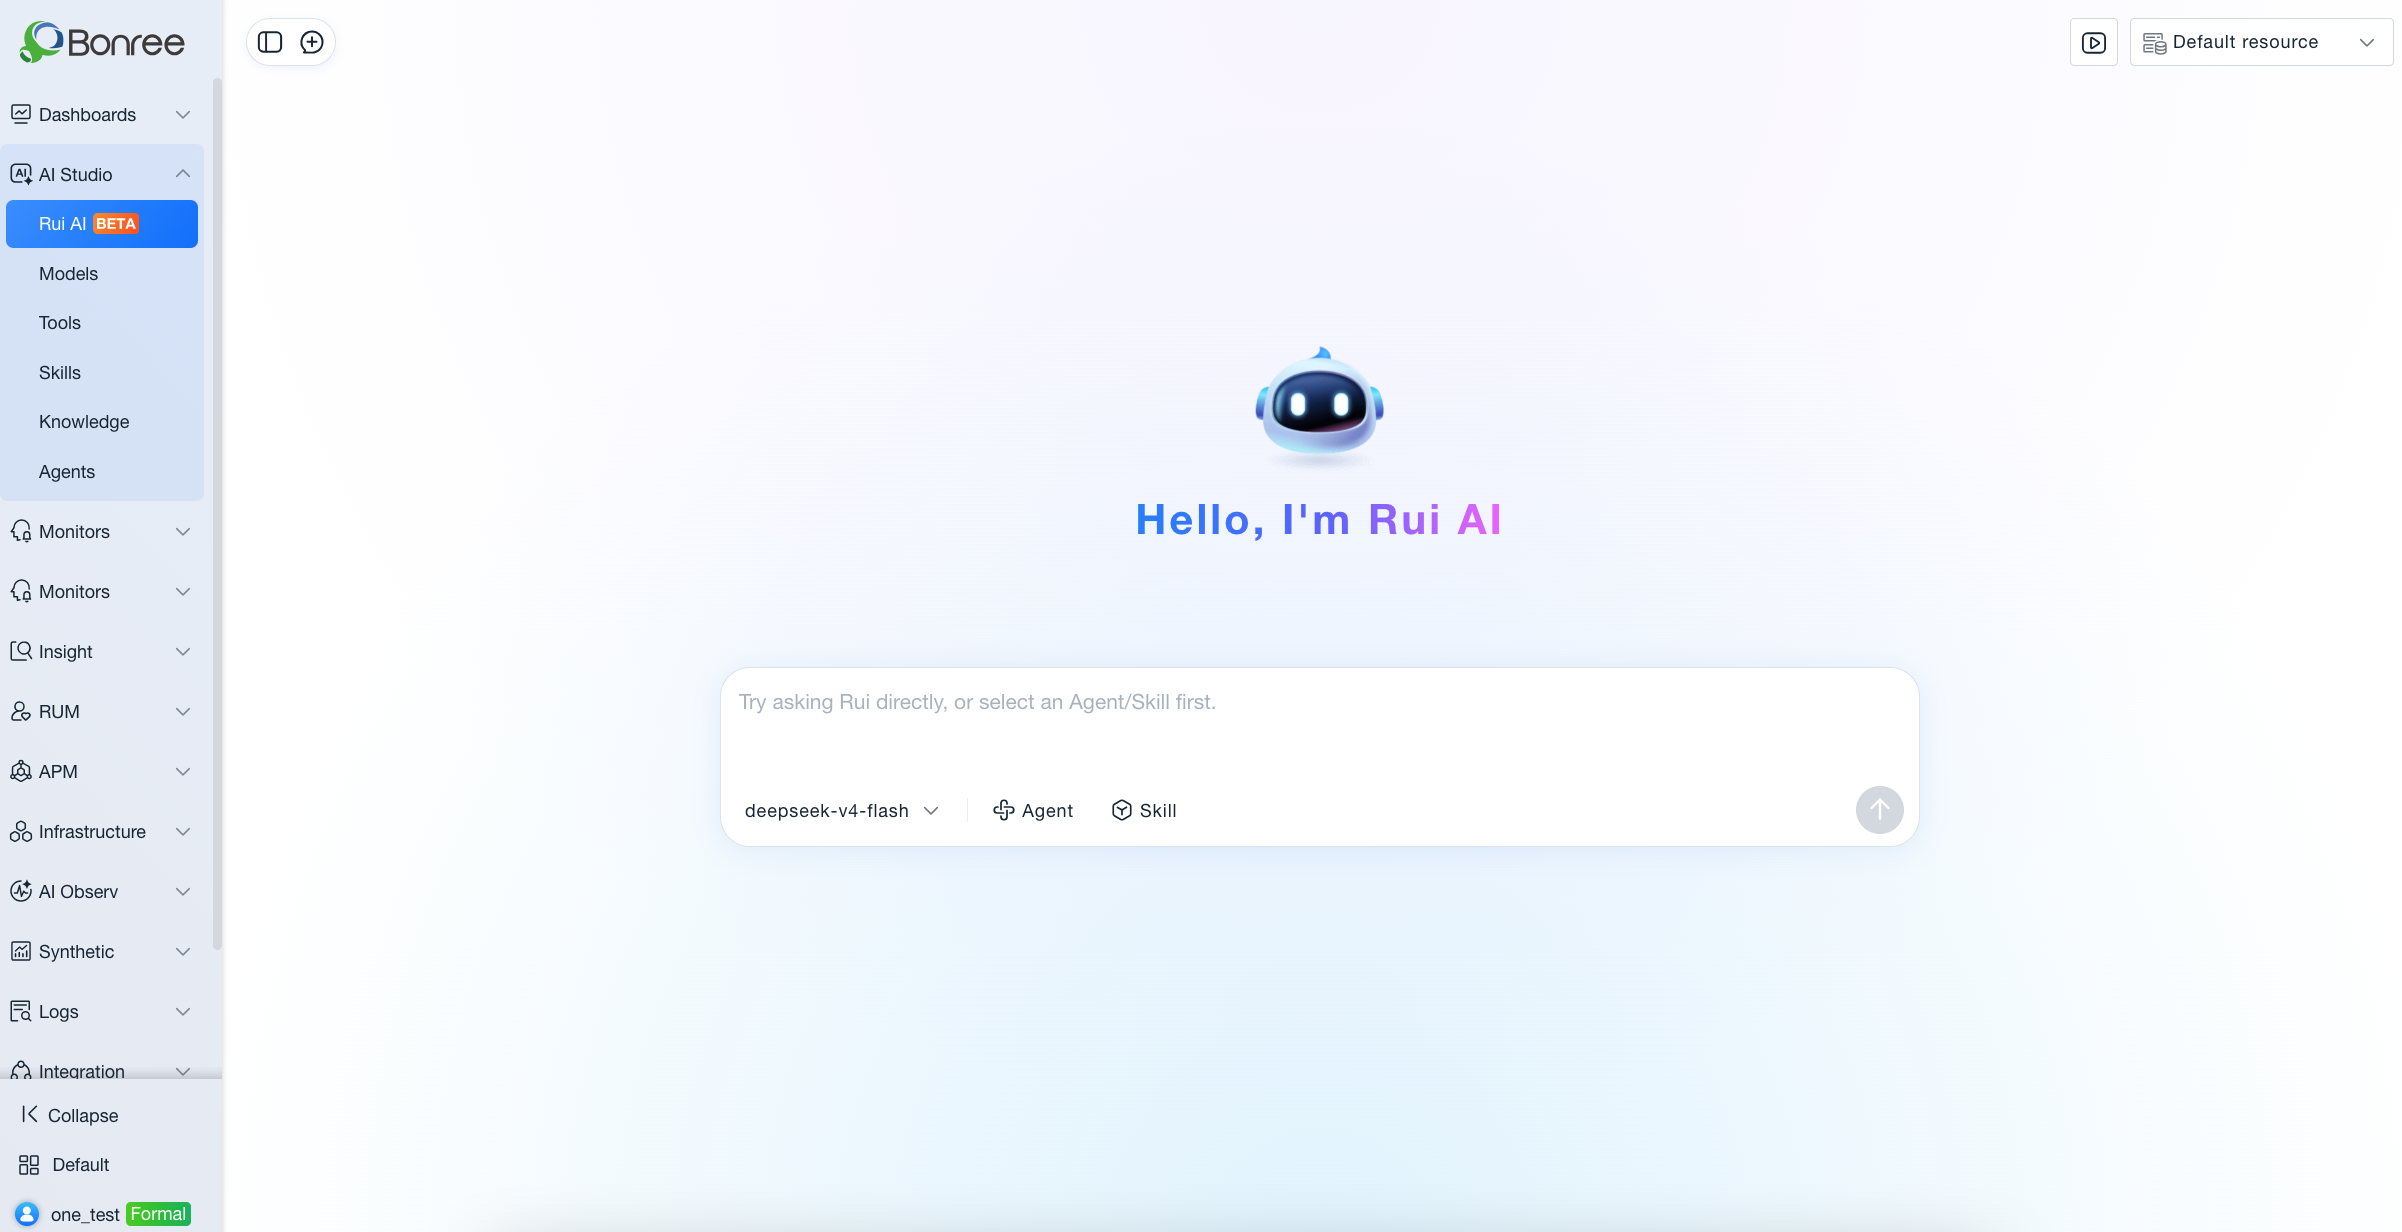
Rui AI Unified Interaction Entry: Added the Rui AI conversation interface, integrating intent routing, multi-agent selection, and Skill execution capabilities. When no agent is specified, the routing agent automatically recognizes intent and assigns processing logic. Supports three display modes: initialization, single-panel, and split-screen. Complex diagnostic tasks automatically switch to split-screen mode, presenting conversation history and structured reports side by side. Conversation history is retained for 7 days, allowing users to resume context and continue the conversation.
-
Knowledge Base Management: Added a knowledge base module, supporting the upload of team troubleshooting experience, SOPs, system architecture descriptions, and other documents, enabling agents to understand business context during diagnosis. A single knowledge base can be referenced by multiple agents simultaneously, enabling one-time maintenance and cross-scenario reuse.
-
Tool (MCP) Management: Added a tools module, supporting the integration of custom external tools (log query, metric analysis, change retrieval, etc.) via the MCP protocol, forming a complete diagnostic toolchain together with built-in tools.
-
Skill Management: Added a Skills module, encapsulating operational capabilities such as sending notifications, creating tickets, pushing logs, etc., enabling agents not only to "diagnose" but also to "take action," achieving full automation from query → reasoning → execution → notification.
-
Model Management: Added a models module, supporting the integration of LLMs, embedding models, and reranking models compatible with the OpenAI API protocol. Connectivity checks are automatically performed upon saving.
Optimizations
- Cloning Mechanism: All agents support cloning, enabling rapid derivation of new versions from built-in or existing custom agents. After modifying configurations, users can publish directly without rebuilding from scratch.
【APM】
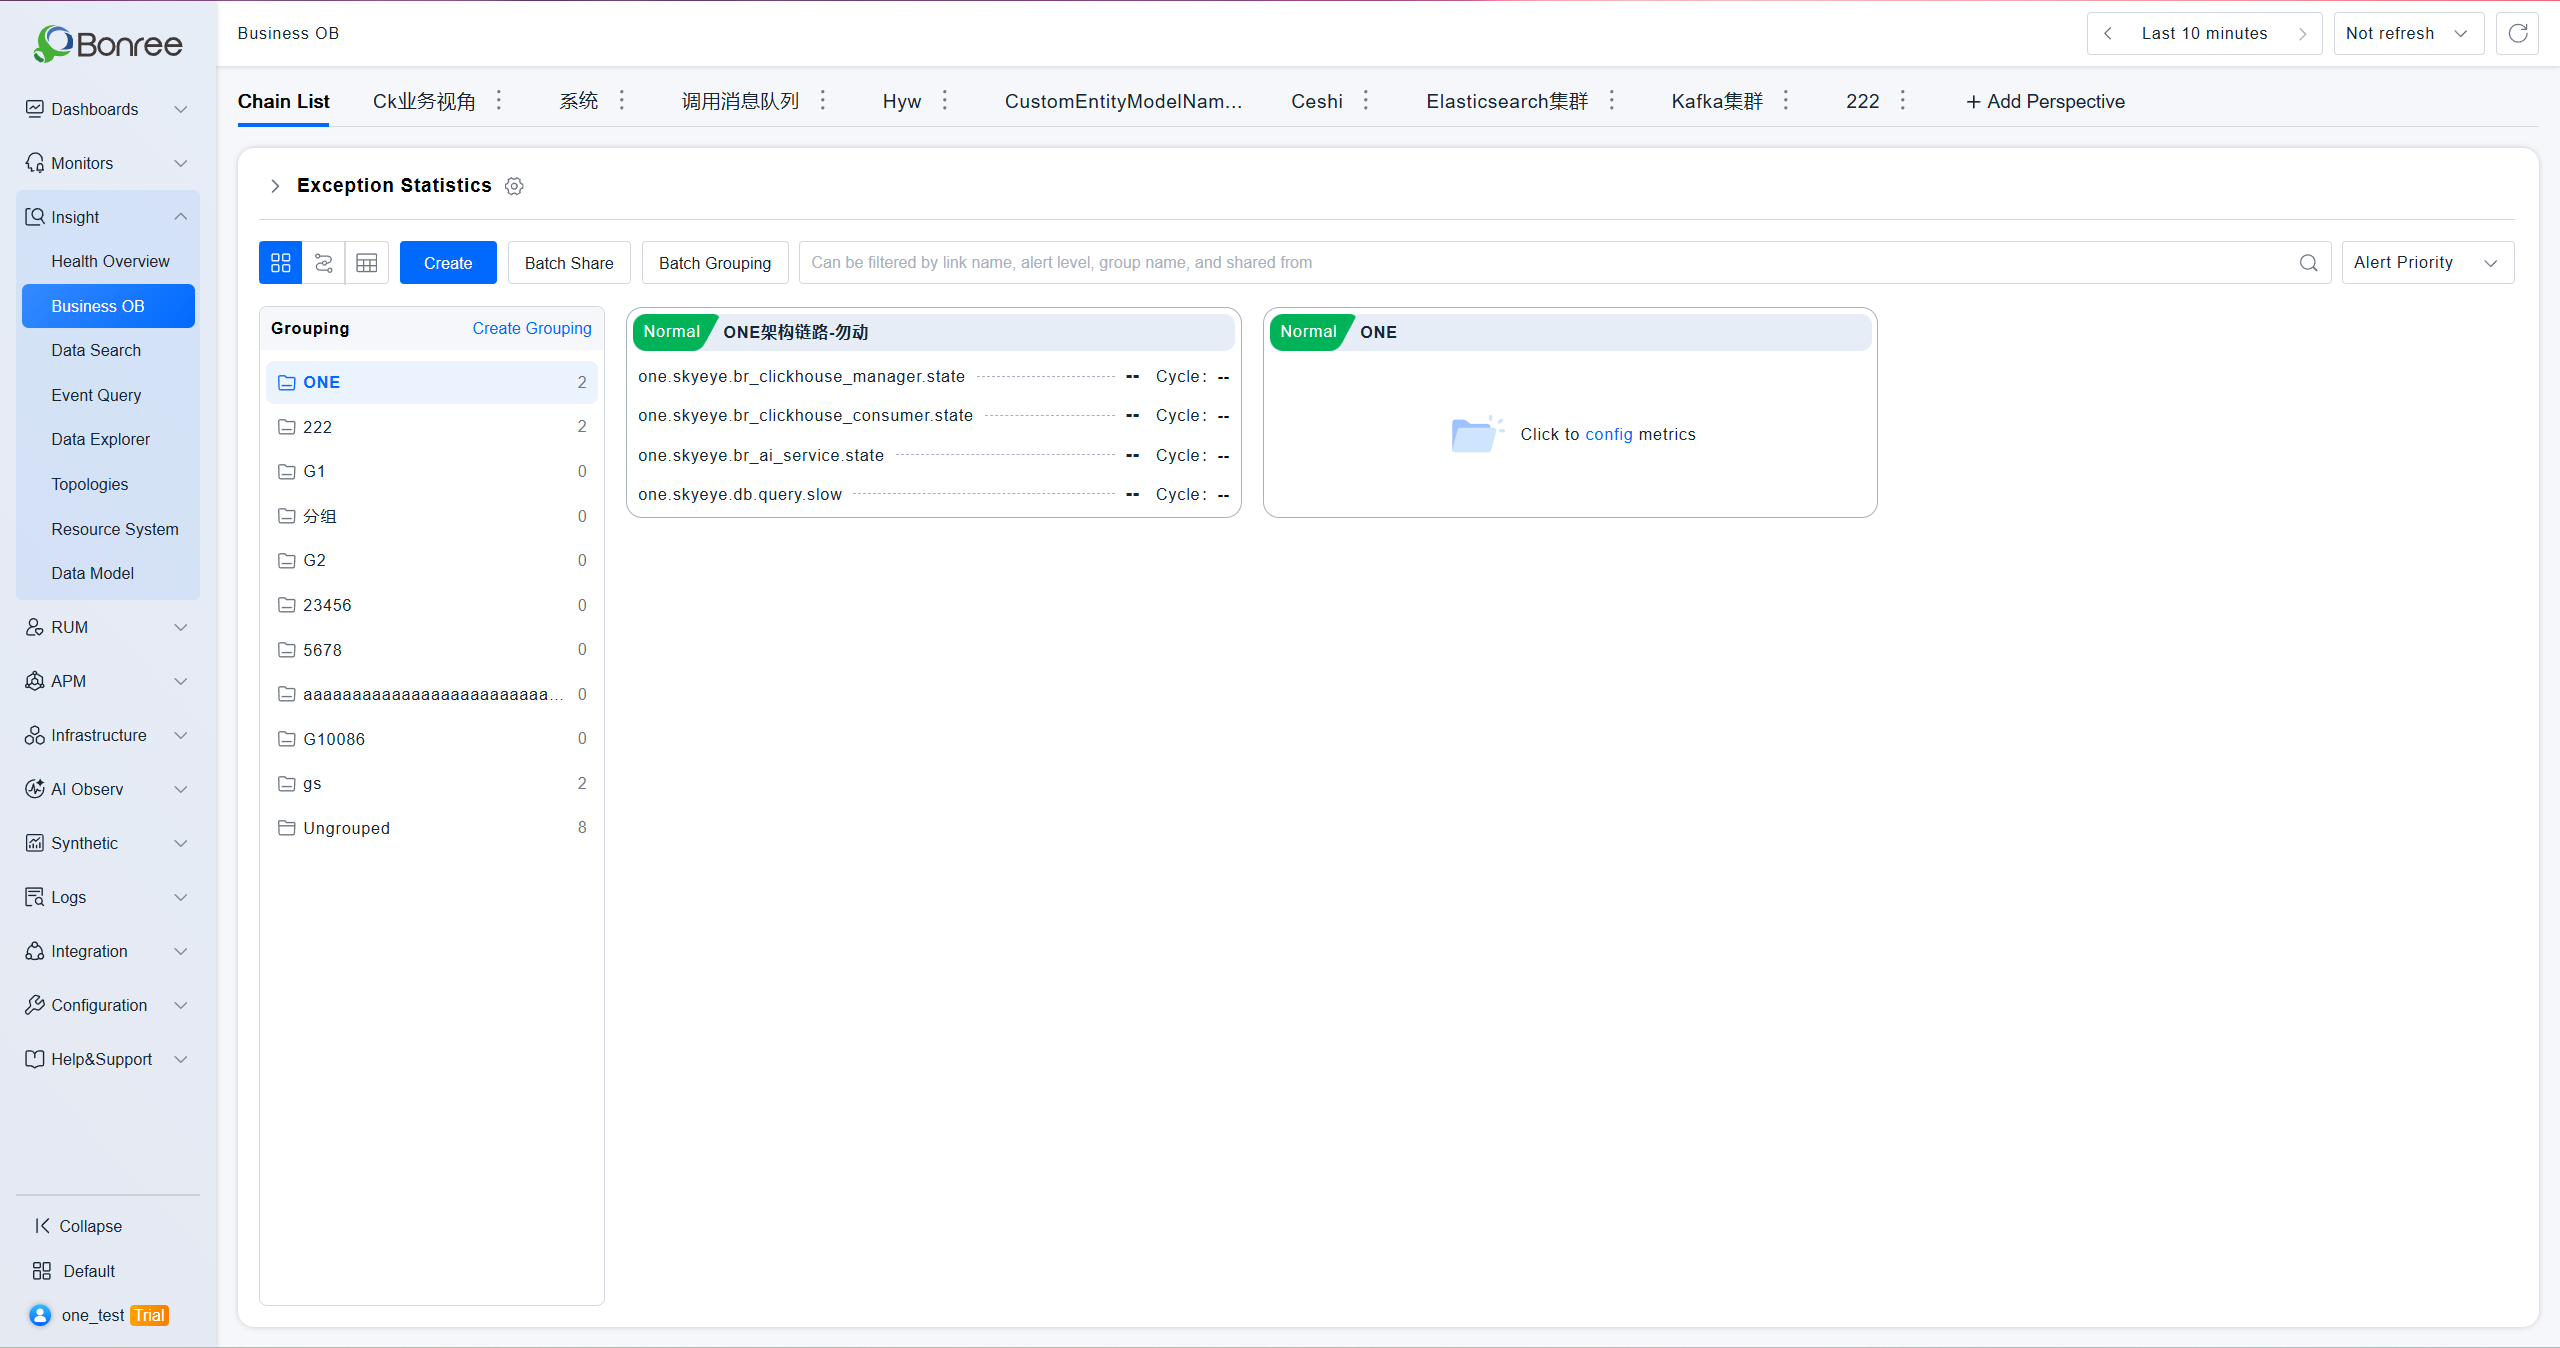
- The original Core Links module has been officially renamed to Business Observation.
-
Business Observation is officially released with the Beta label removed.
-
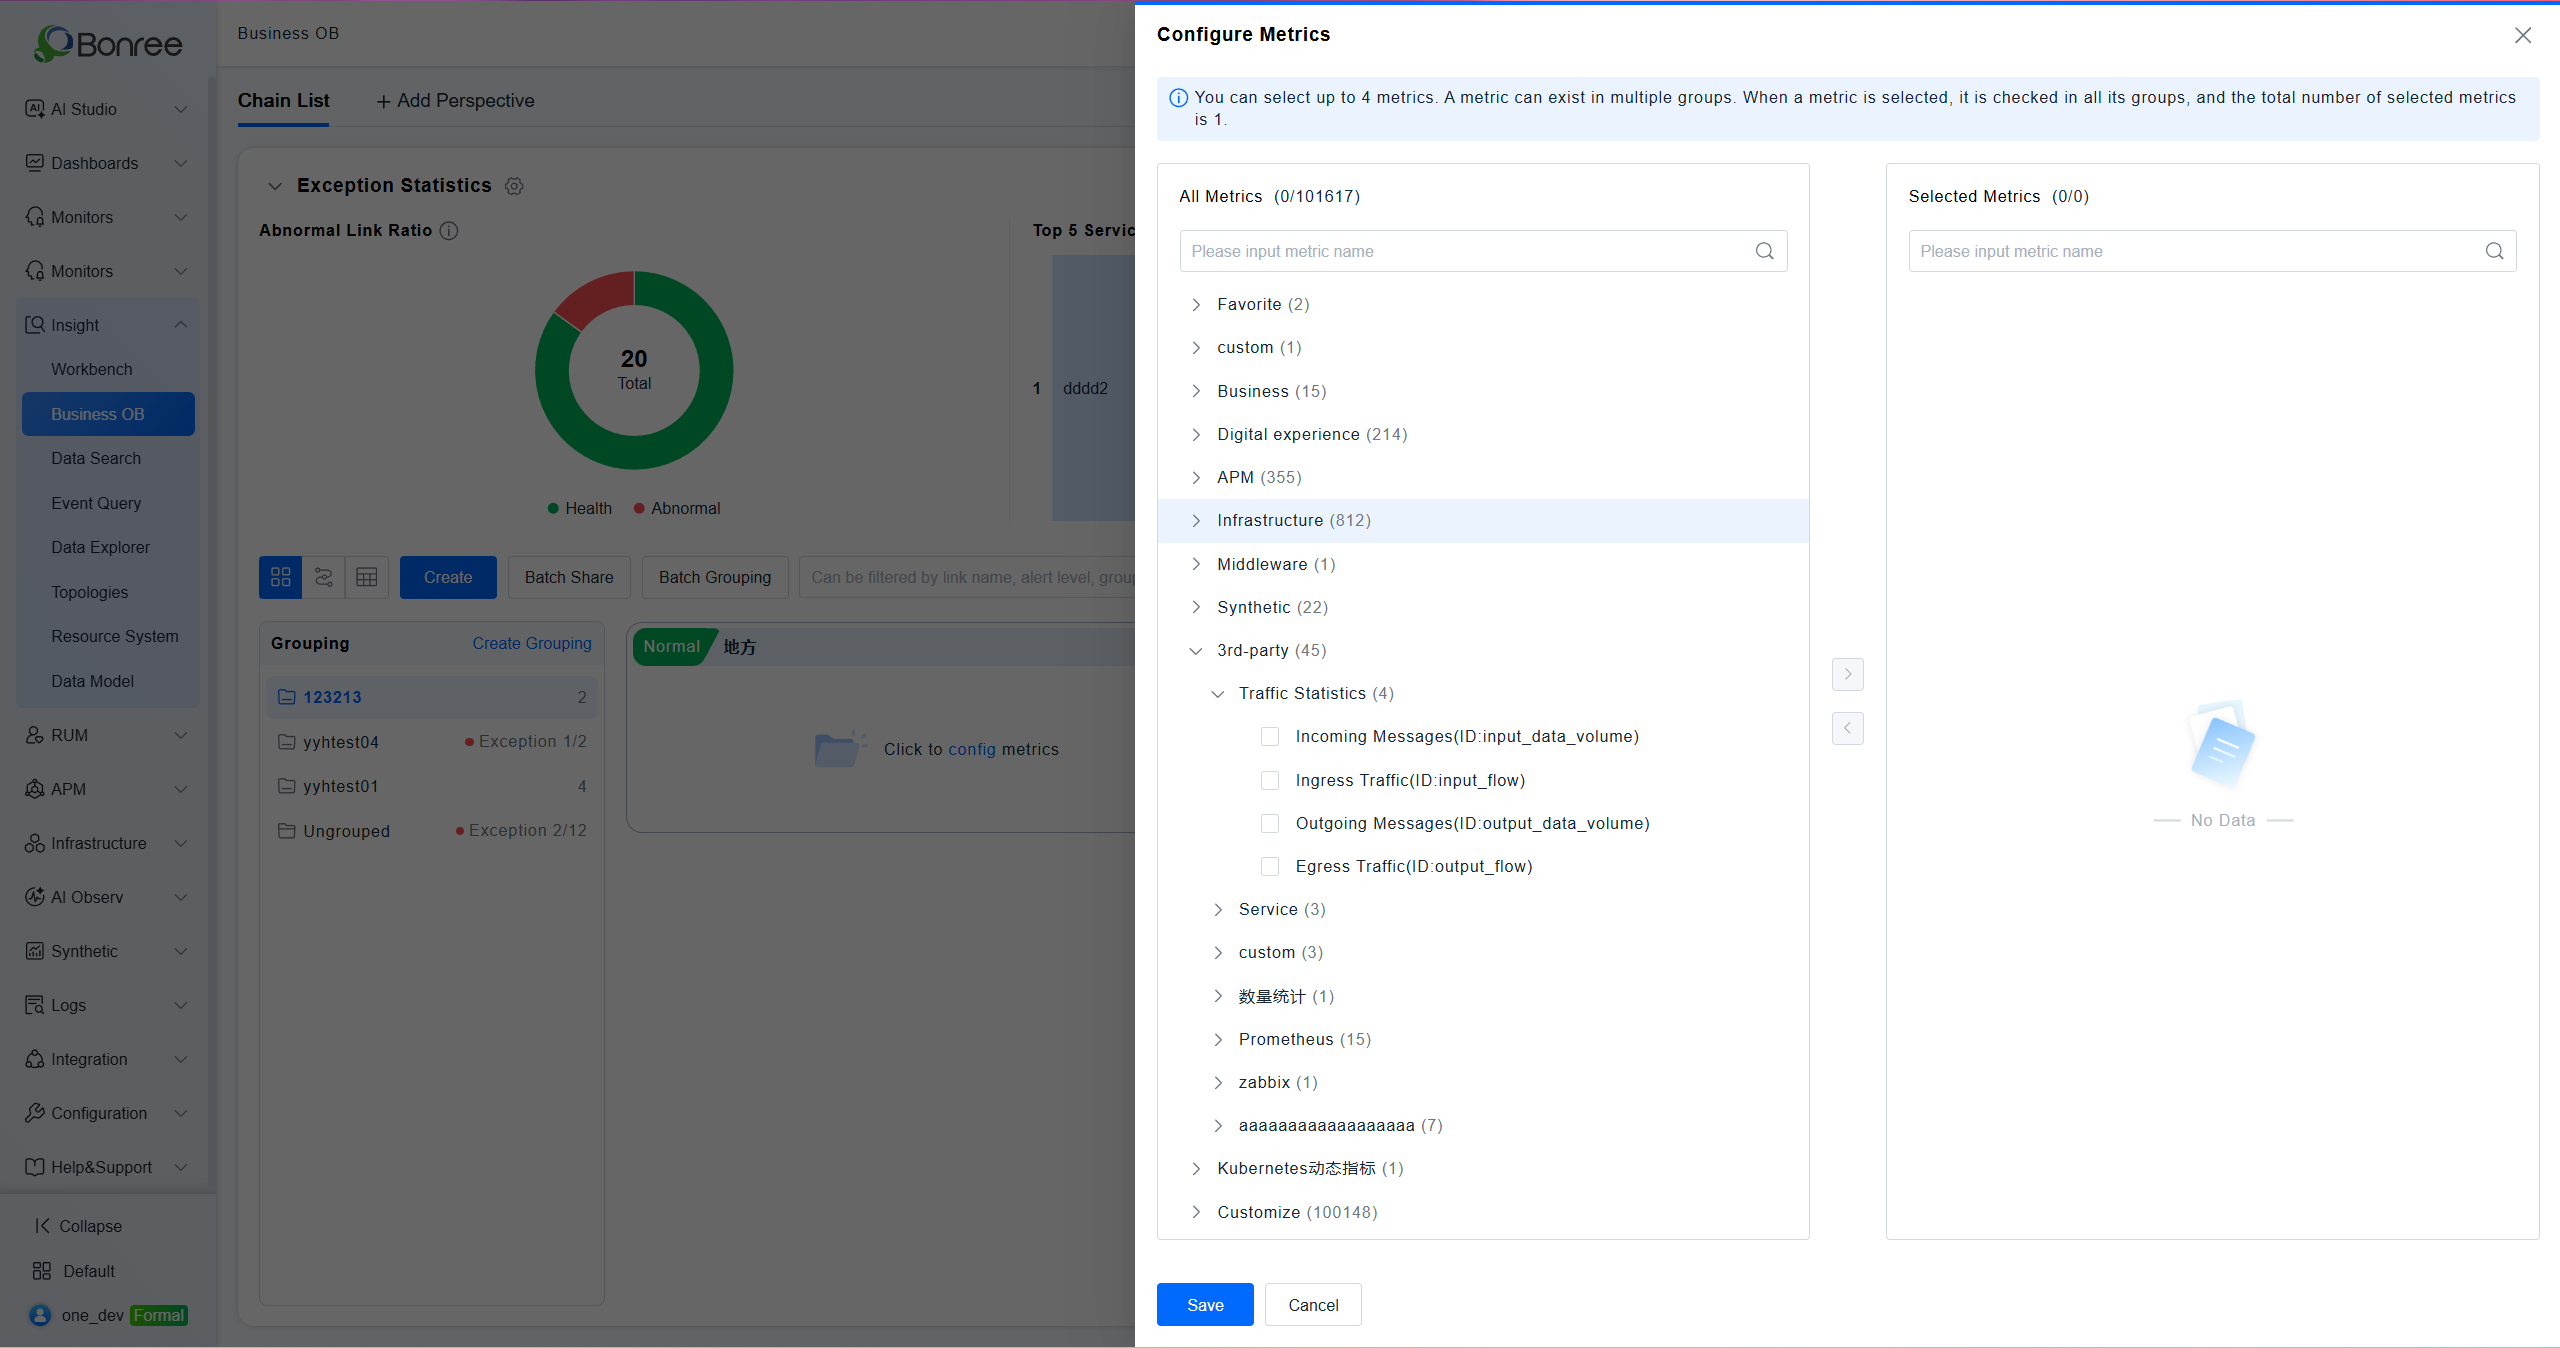
Added Card Grouping function; all cards are placed in Ungrouped by default.
-
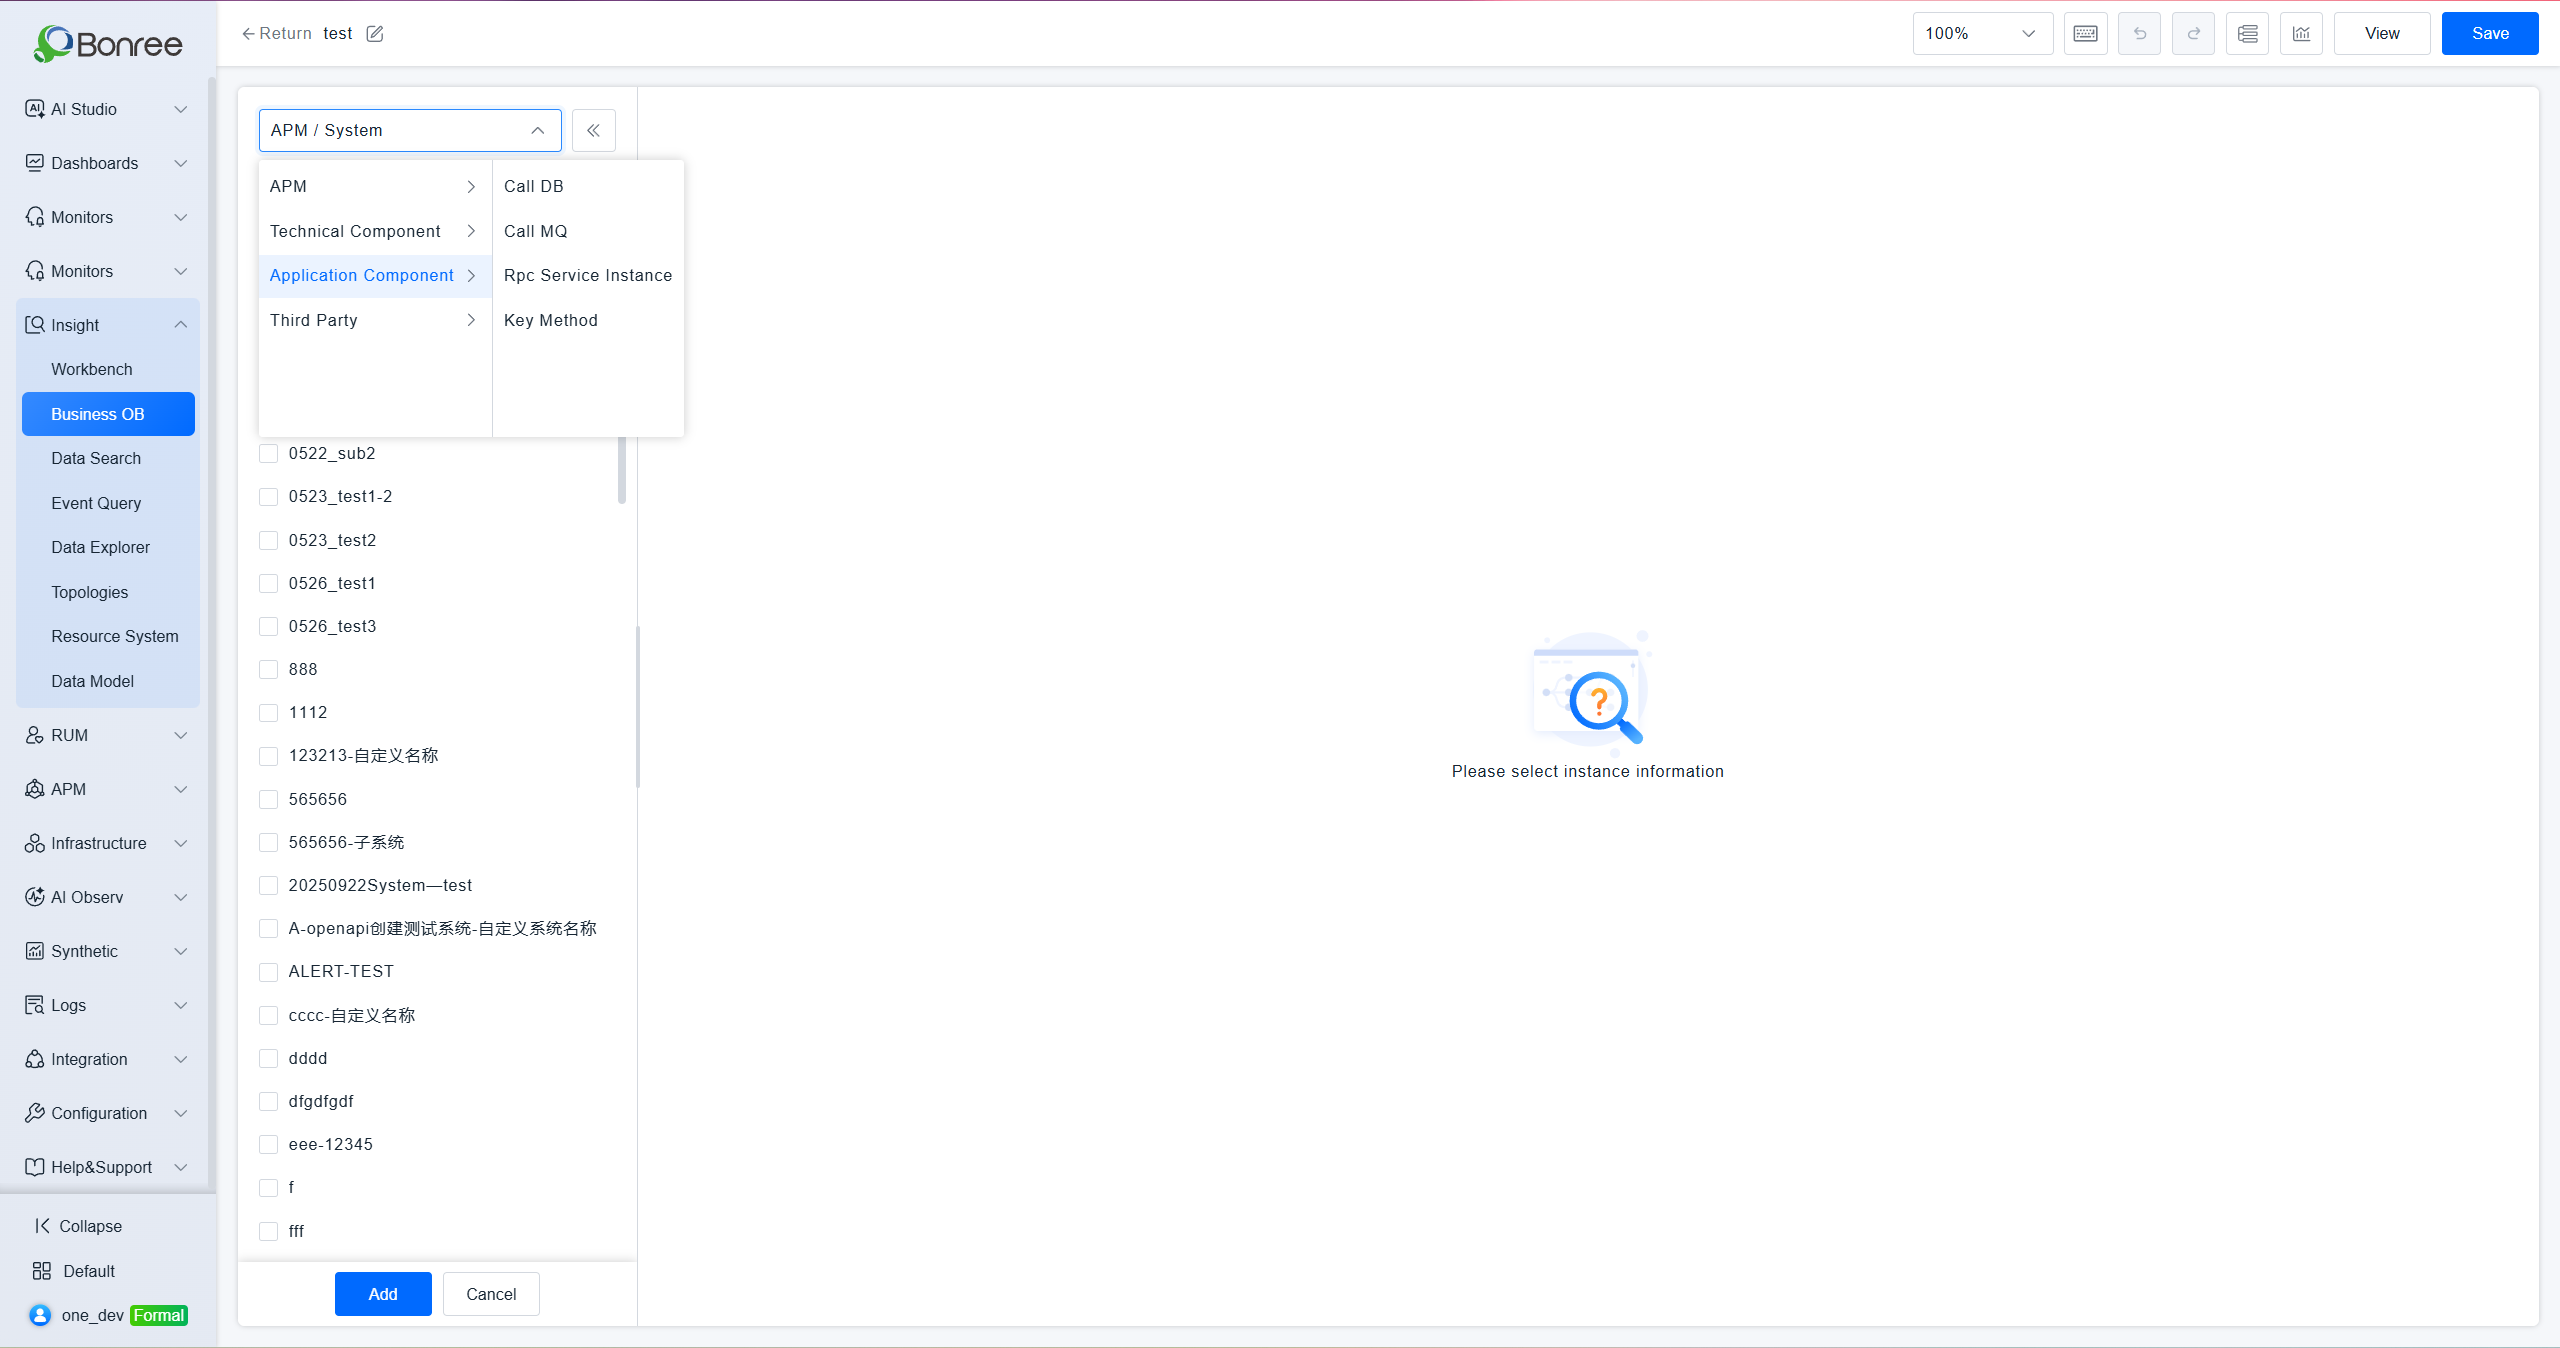
Business Observation supports selecting and configuring application component entities: database calls, message queue calls, remote service instances, and key methods.
-
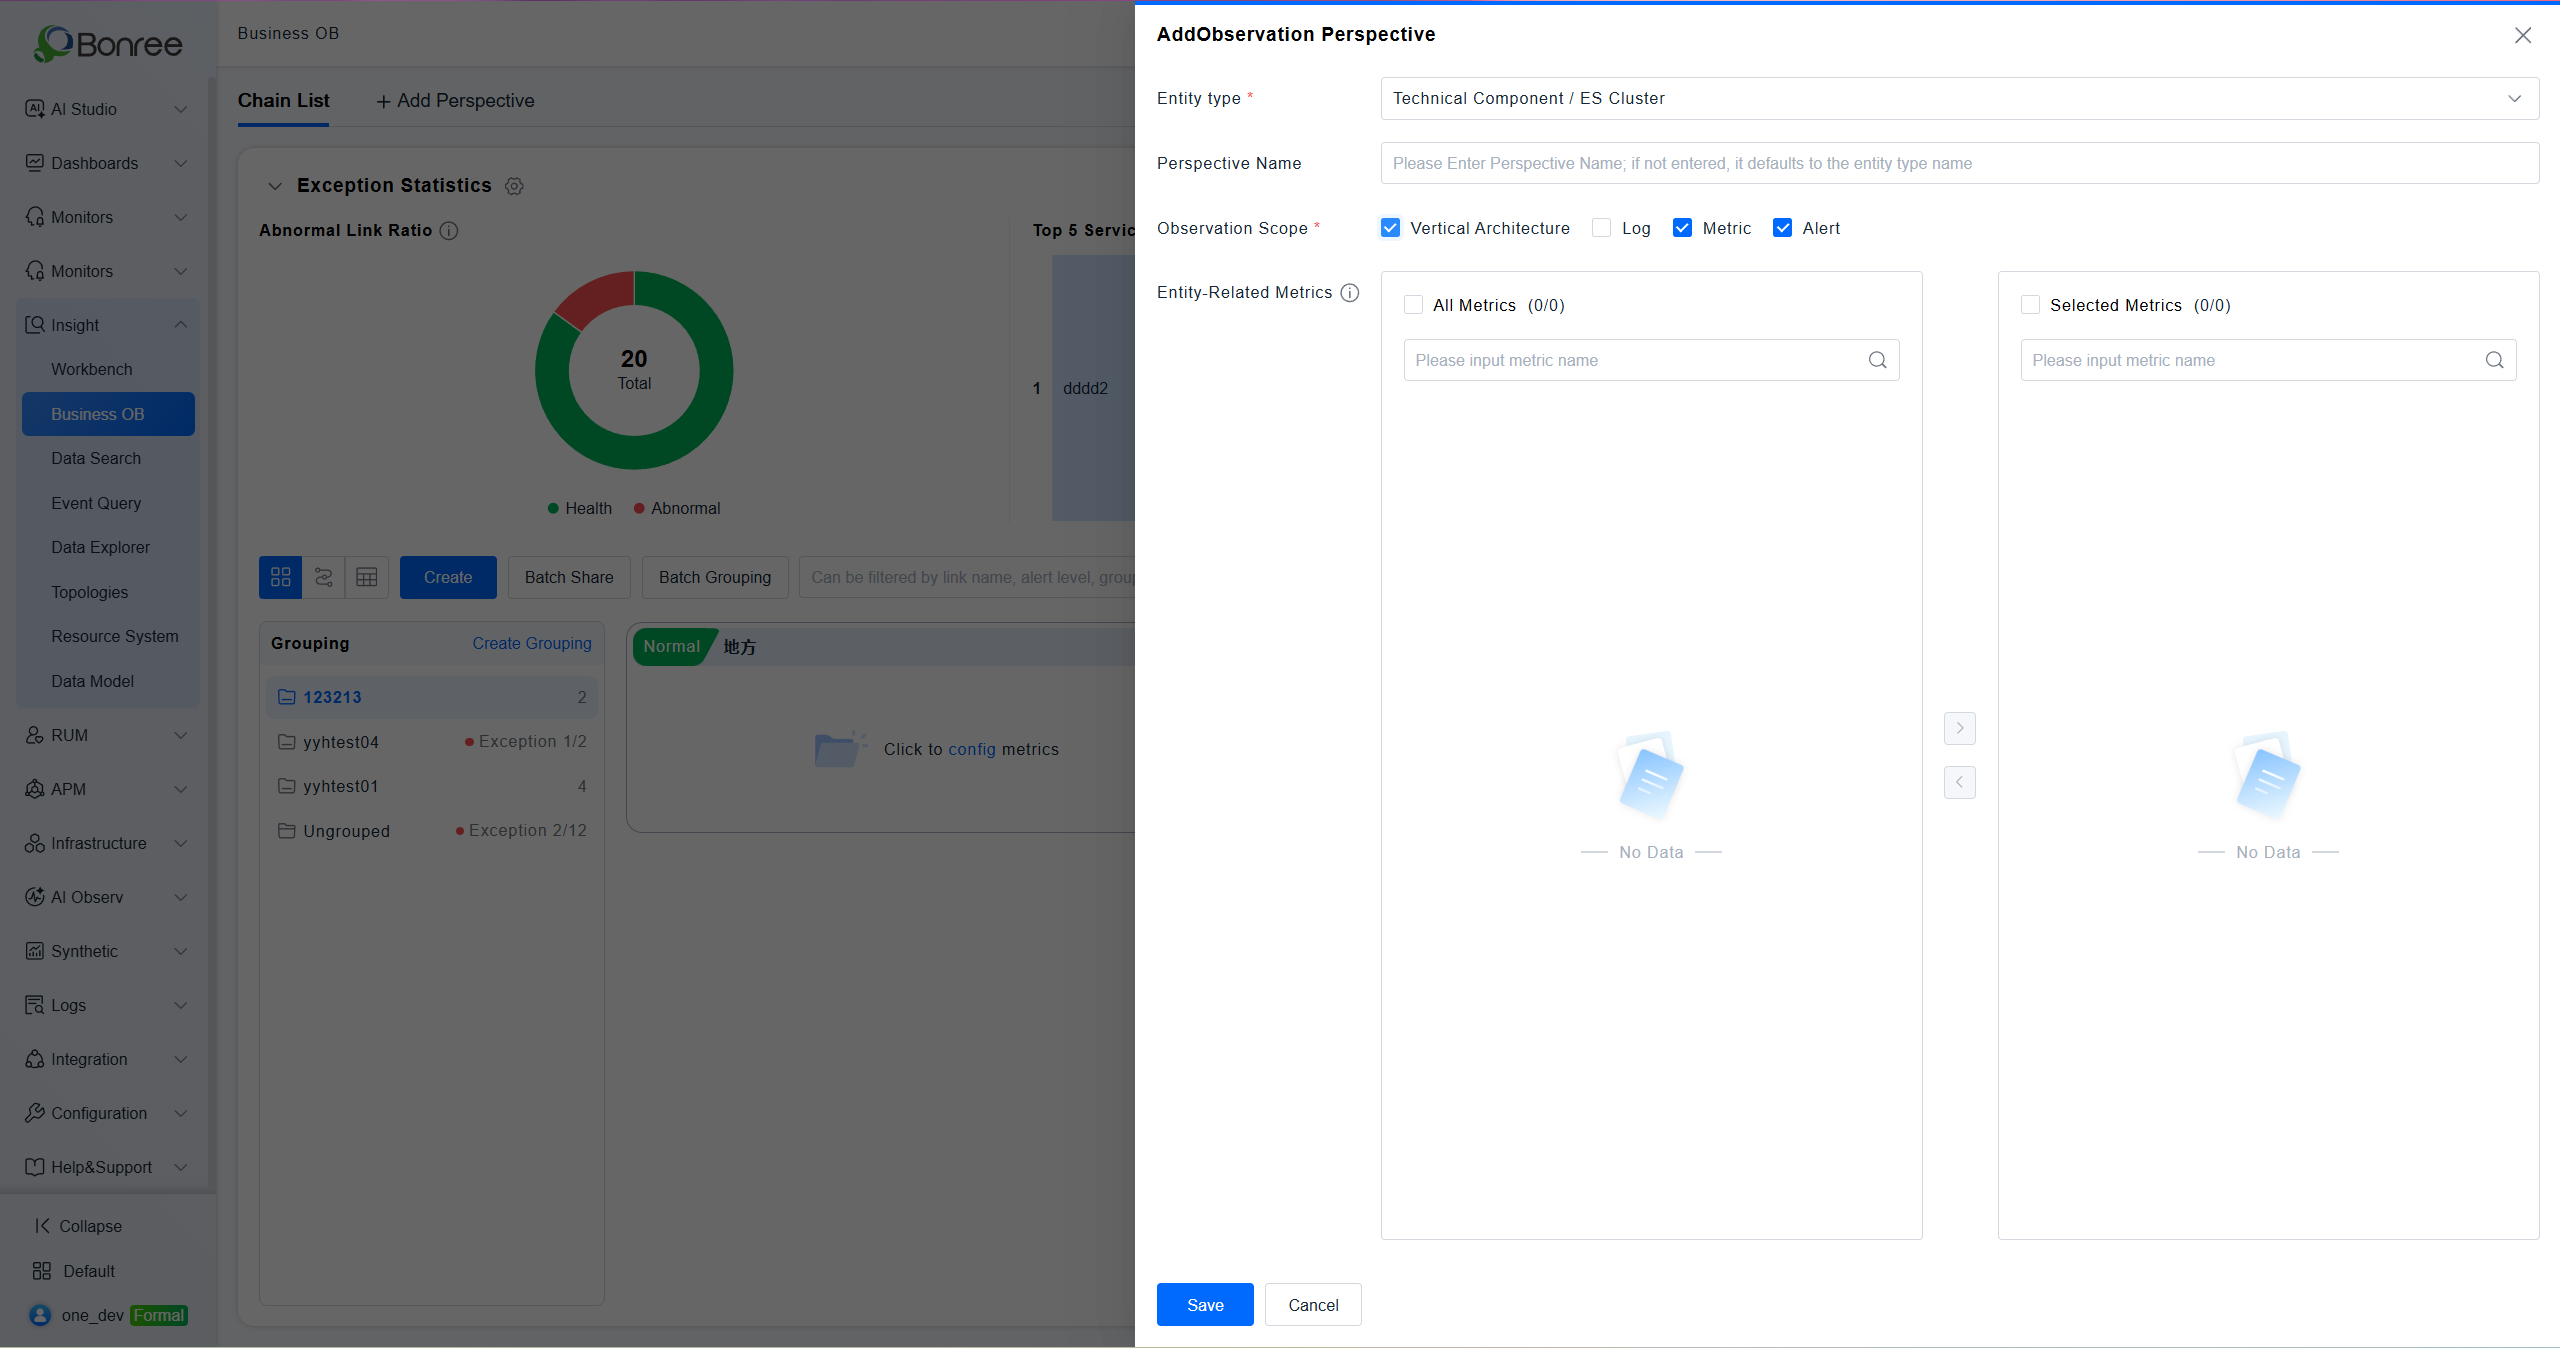
Added a new Observation Perspective module to Business Observation. Users can customize entity observation dimensions; details on supported entity scopes can be found in the documentation.
-
Full support for third-party metric selection and query adaptation is now available.
-
Alert Component Upgrade: Completed the new alert component adaptation, ensuring a smooth upgrade without impacting existing alert workflows.
-
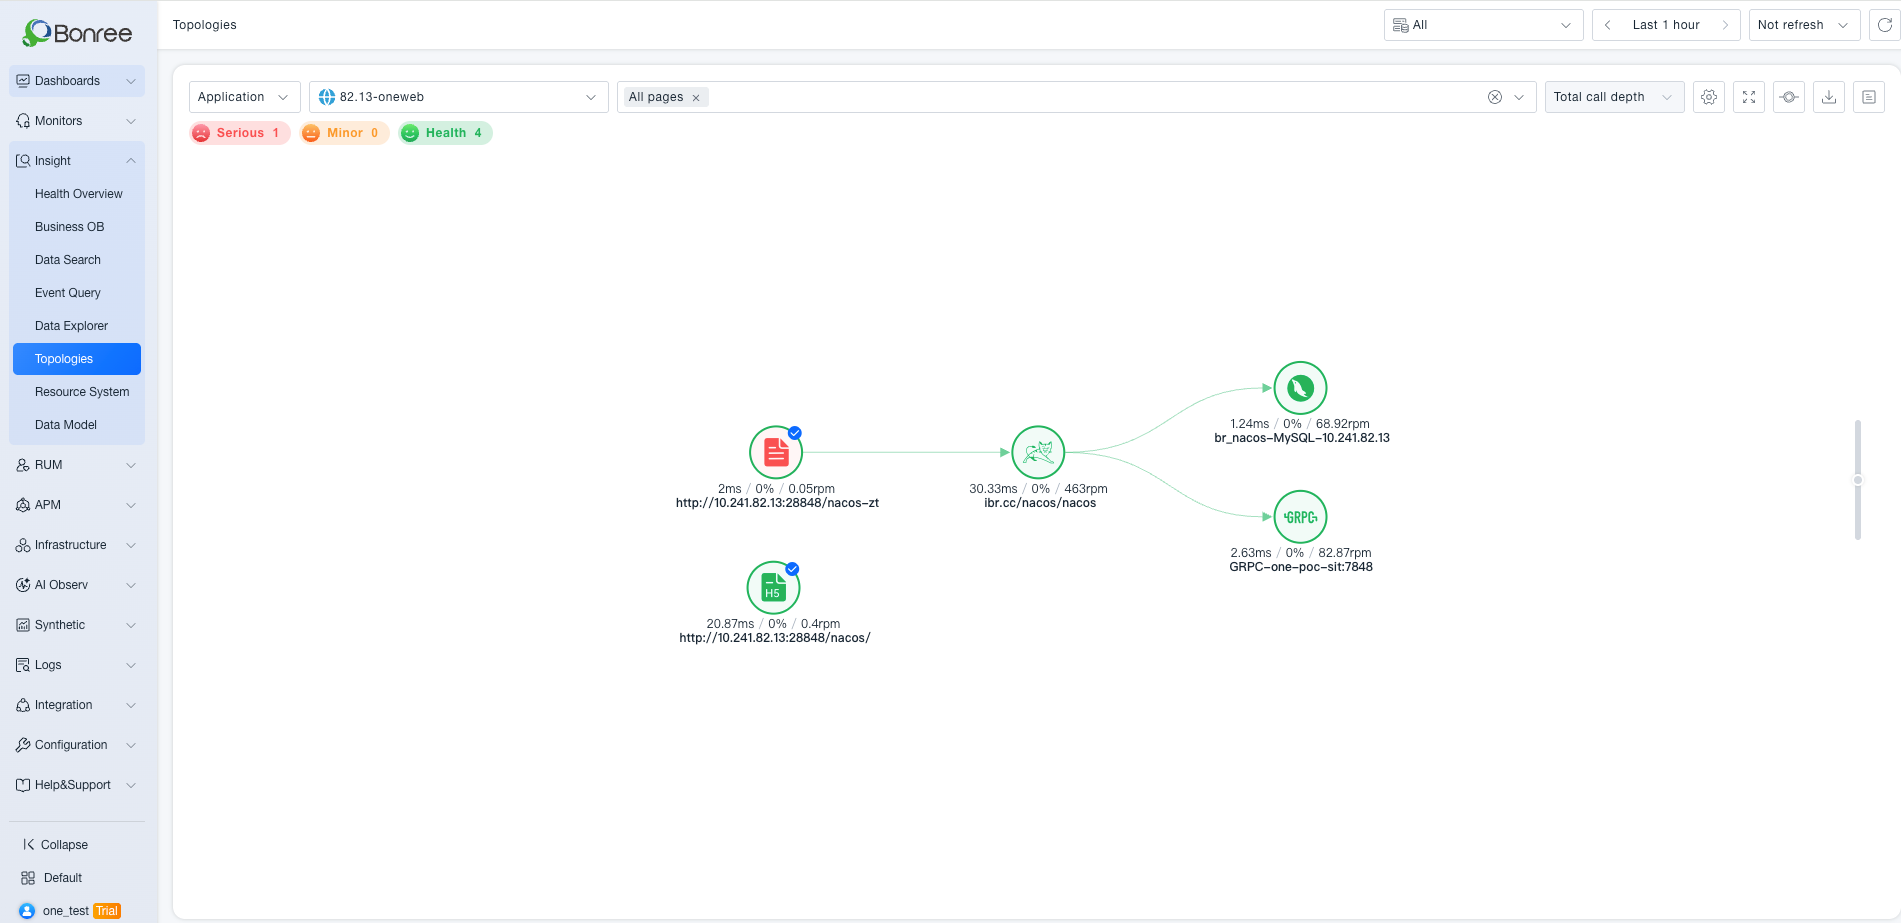
Global Topology: Page Dimension Added: Supports page-as-origin topology views to display complete front-to-back call chains, enabling full-link observability from the frontend perspective.
-
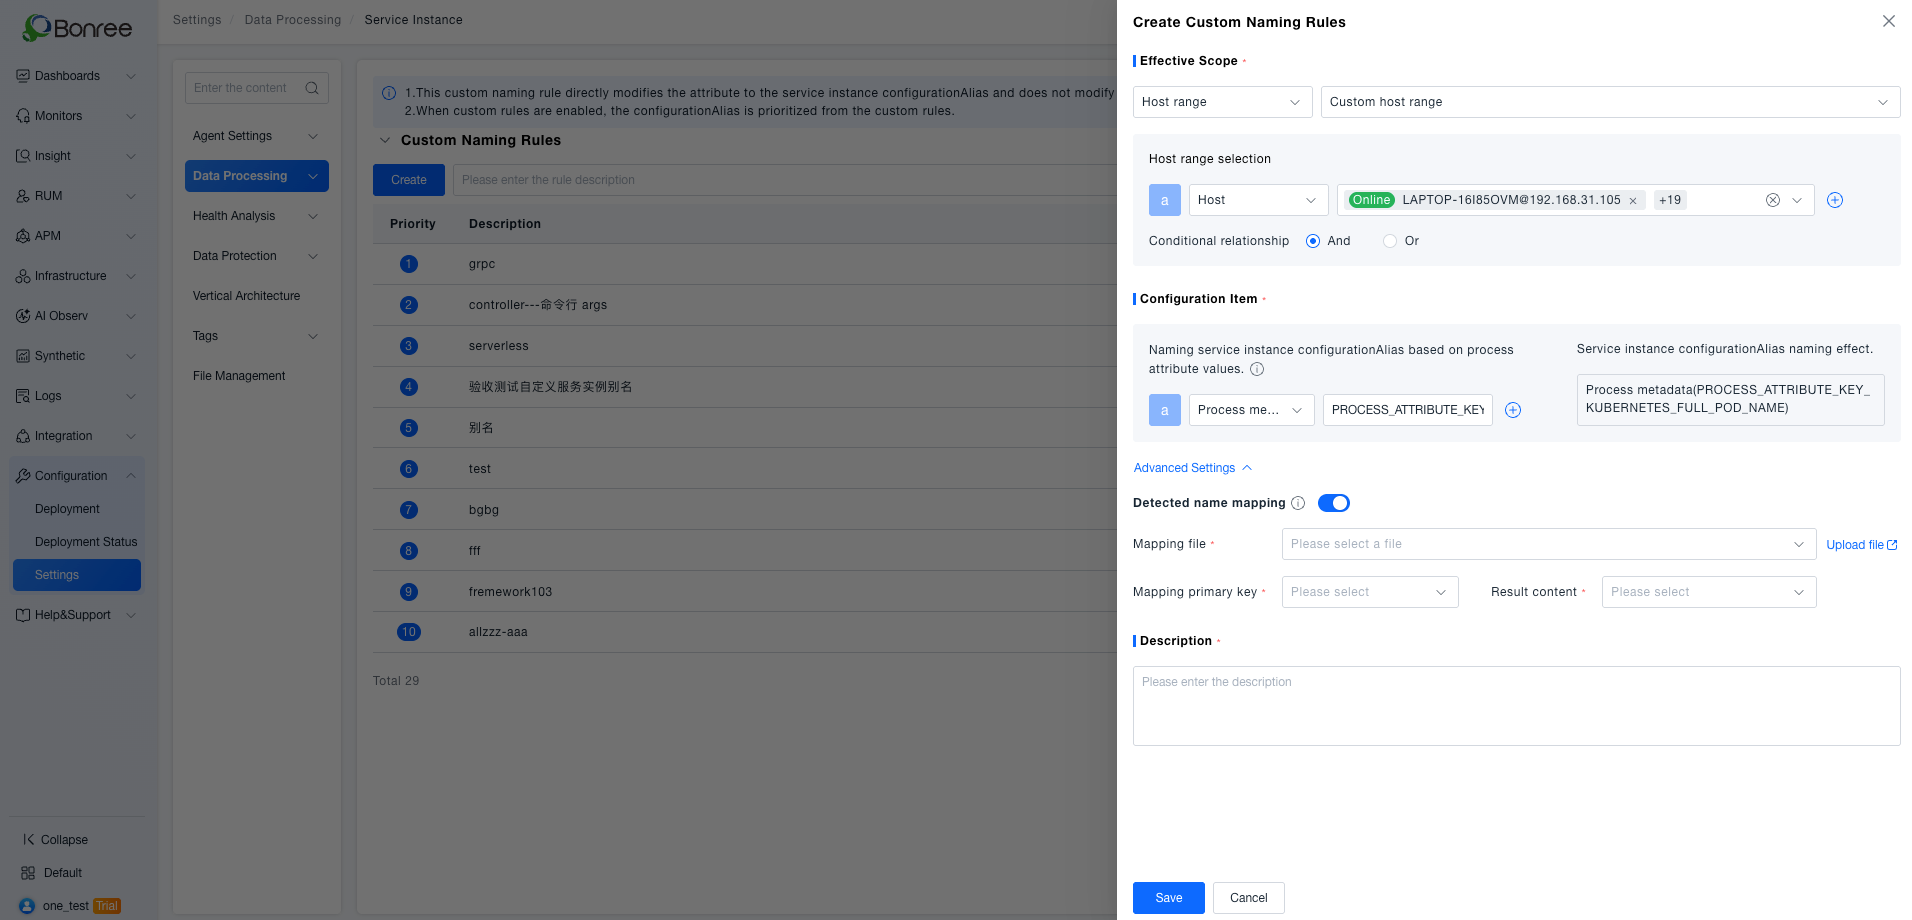
Custom Naming Rules for Service Instances: Supports configurable service instance identification naming rules, flexibly adapting to containerized deployment scenarios and improving instance recognition accuracy.
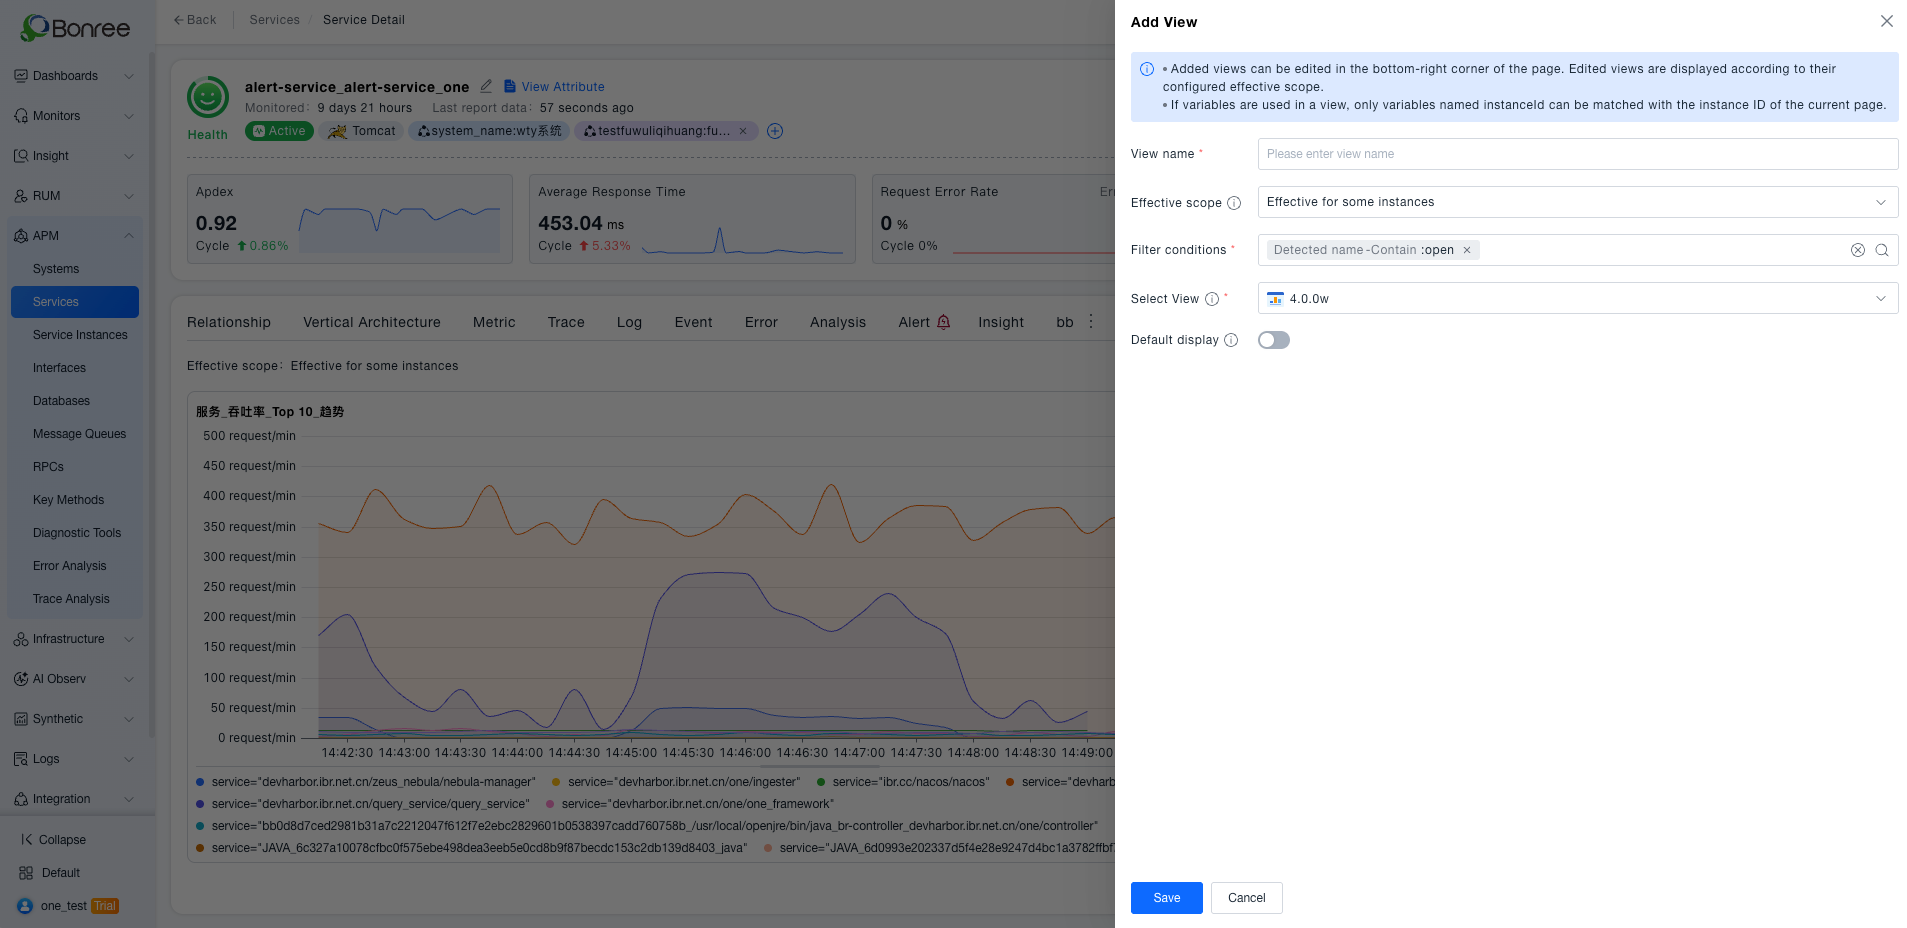
-
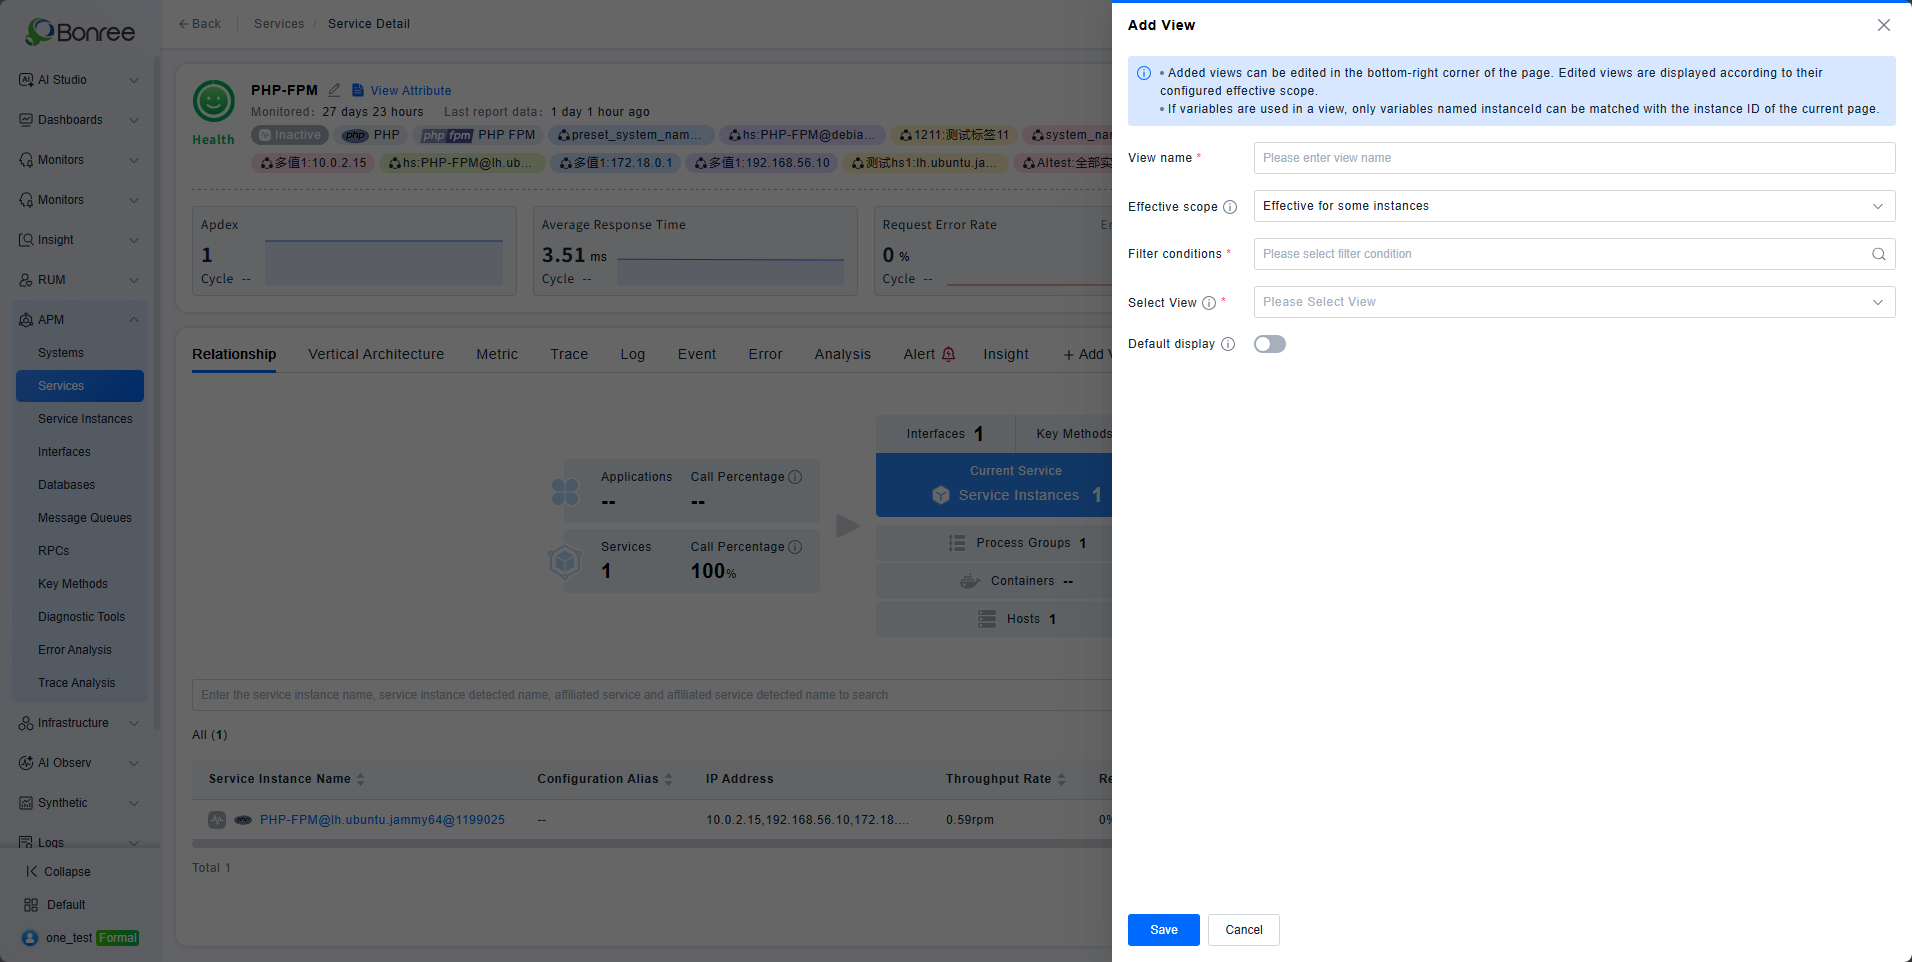
View Scope: "Partial Instance" Option Added: View configuration now supports targeting specific instances, enabling fine-grained and differentiated instance management for multi-instance group operations.
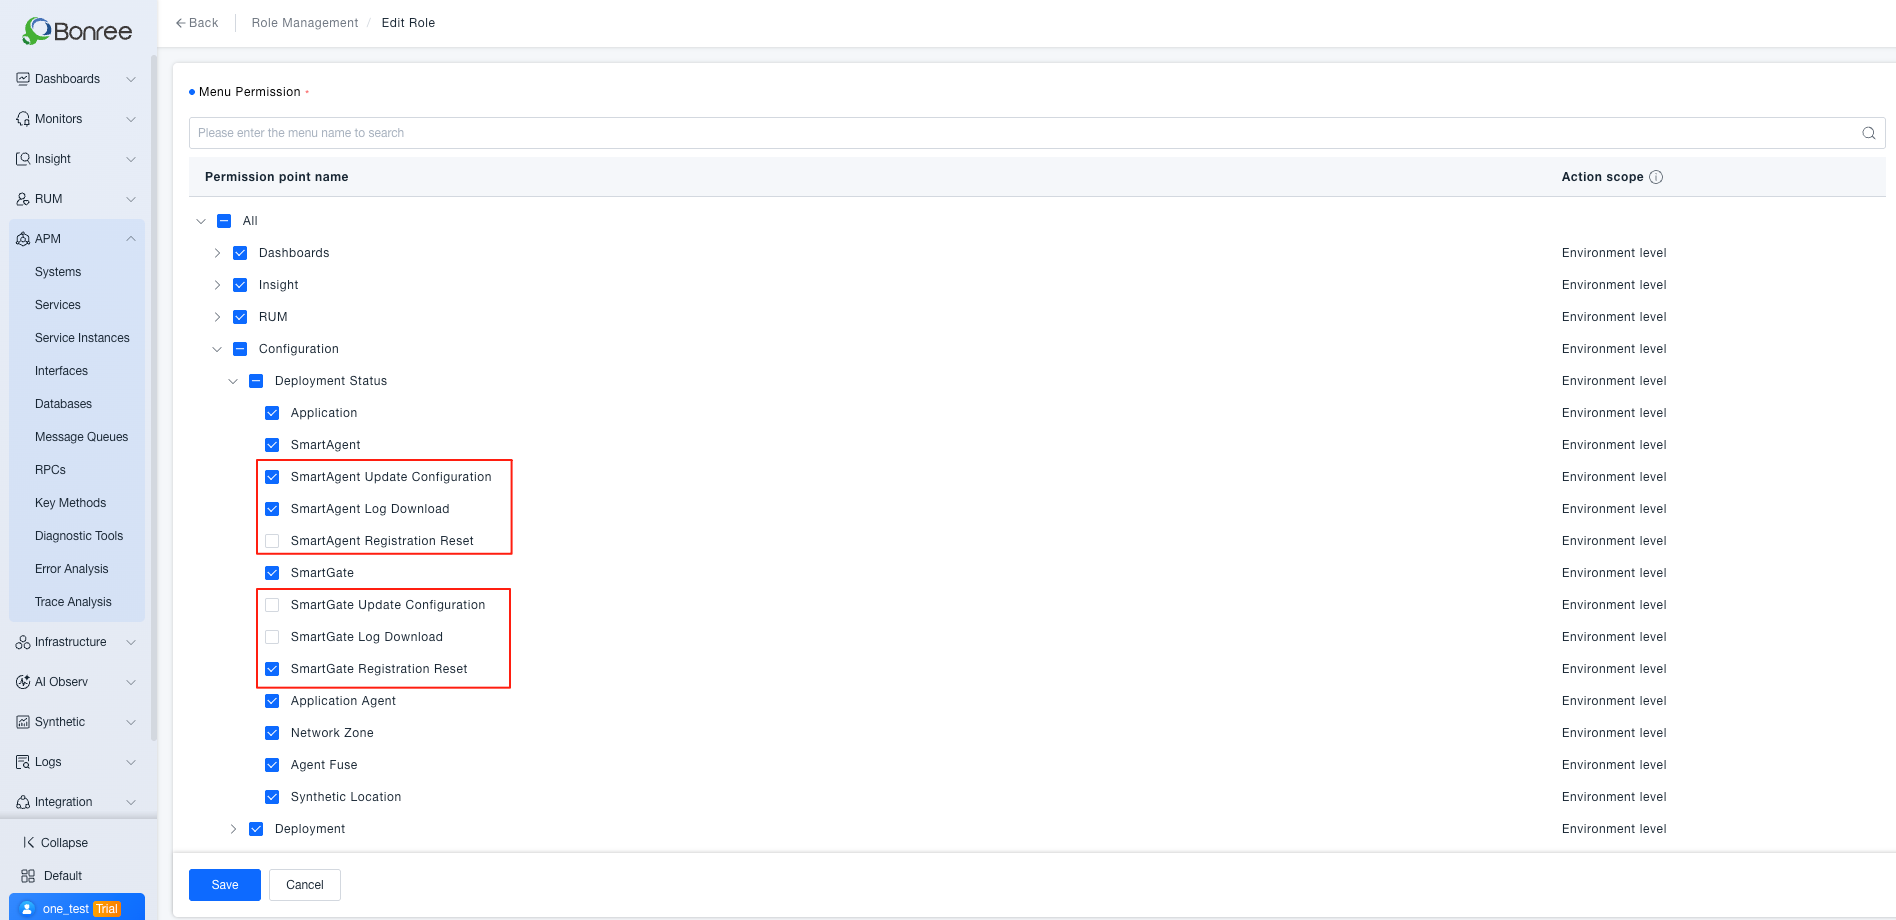
-
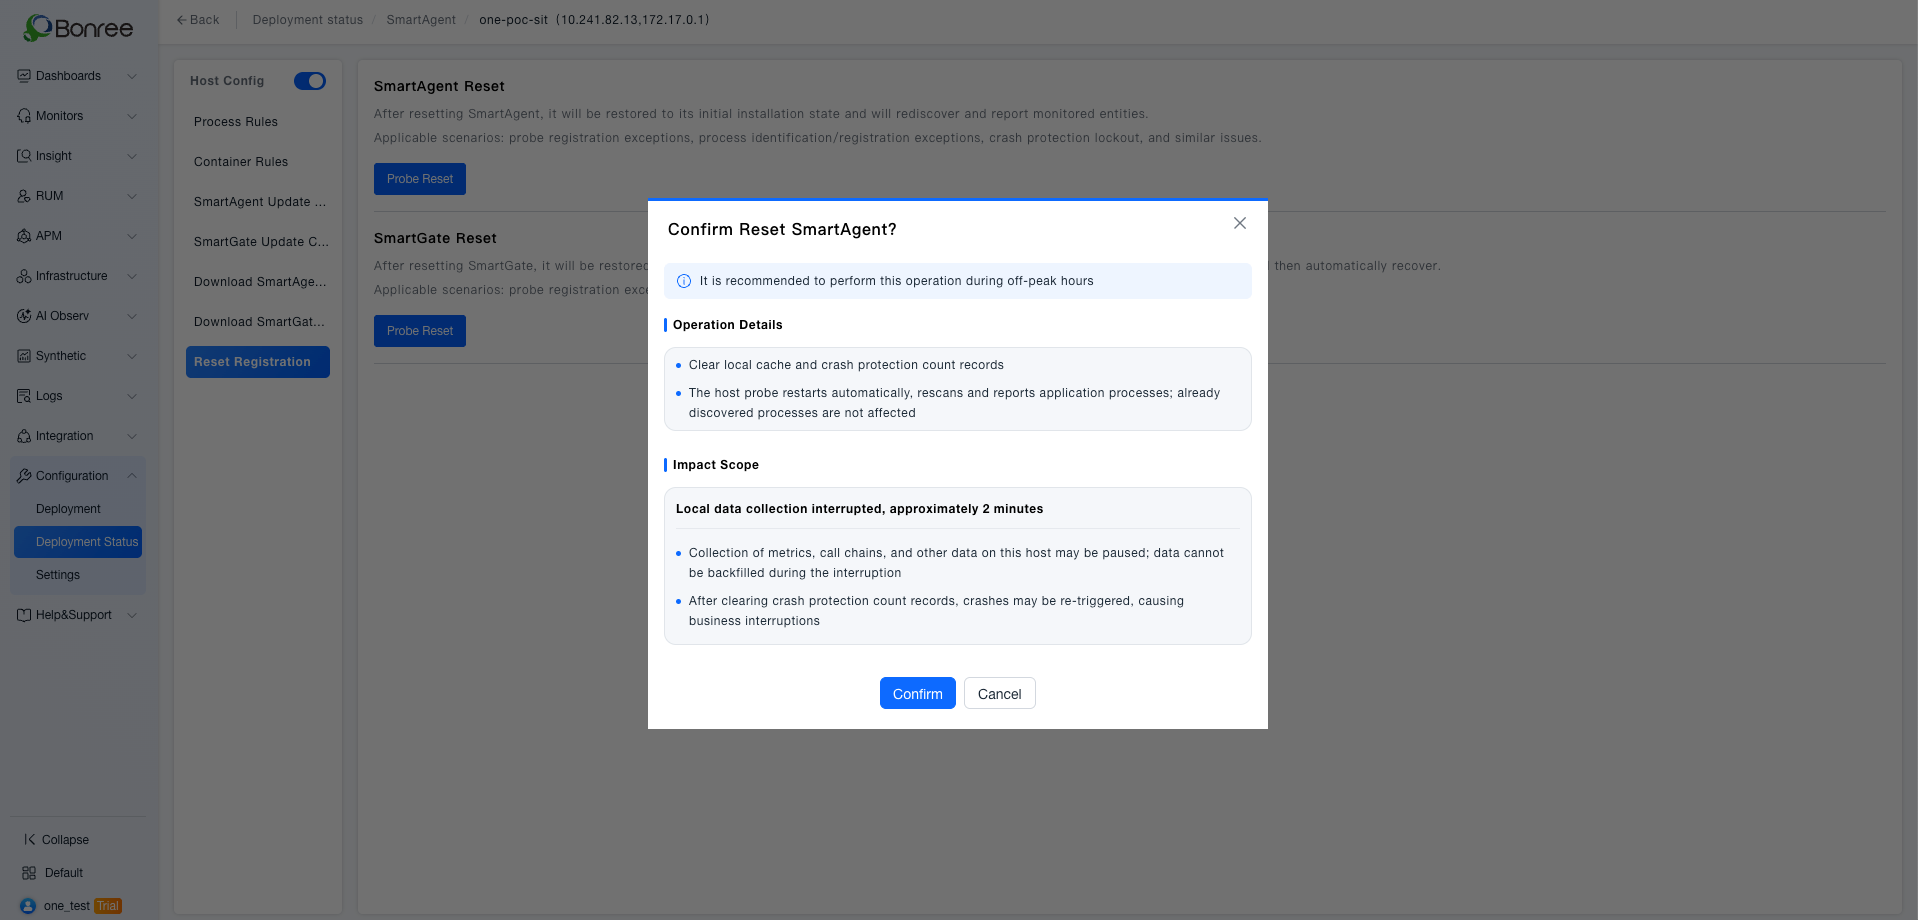
Probe Reset Permission Control: Role-based access control added for SmartAgent / SmartGate registration reset operations, preventing unauthorized actions from causing monitoring data interruptions.
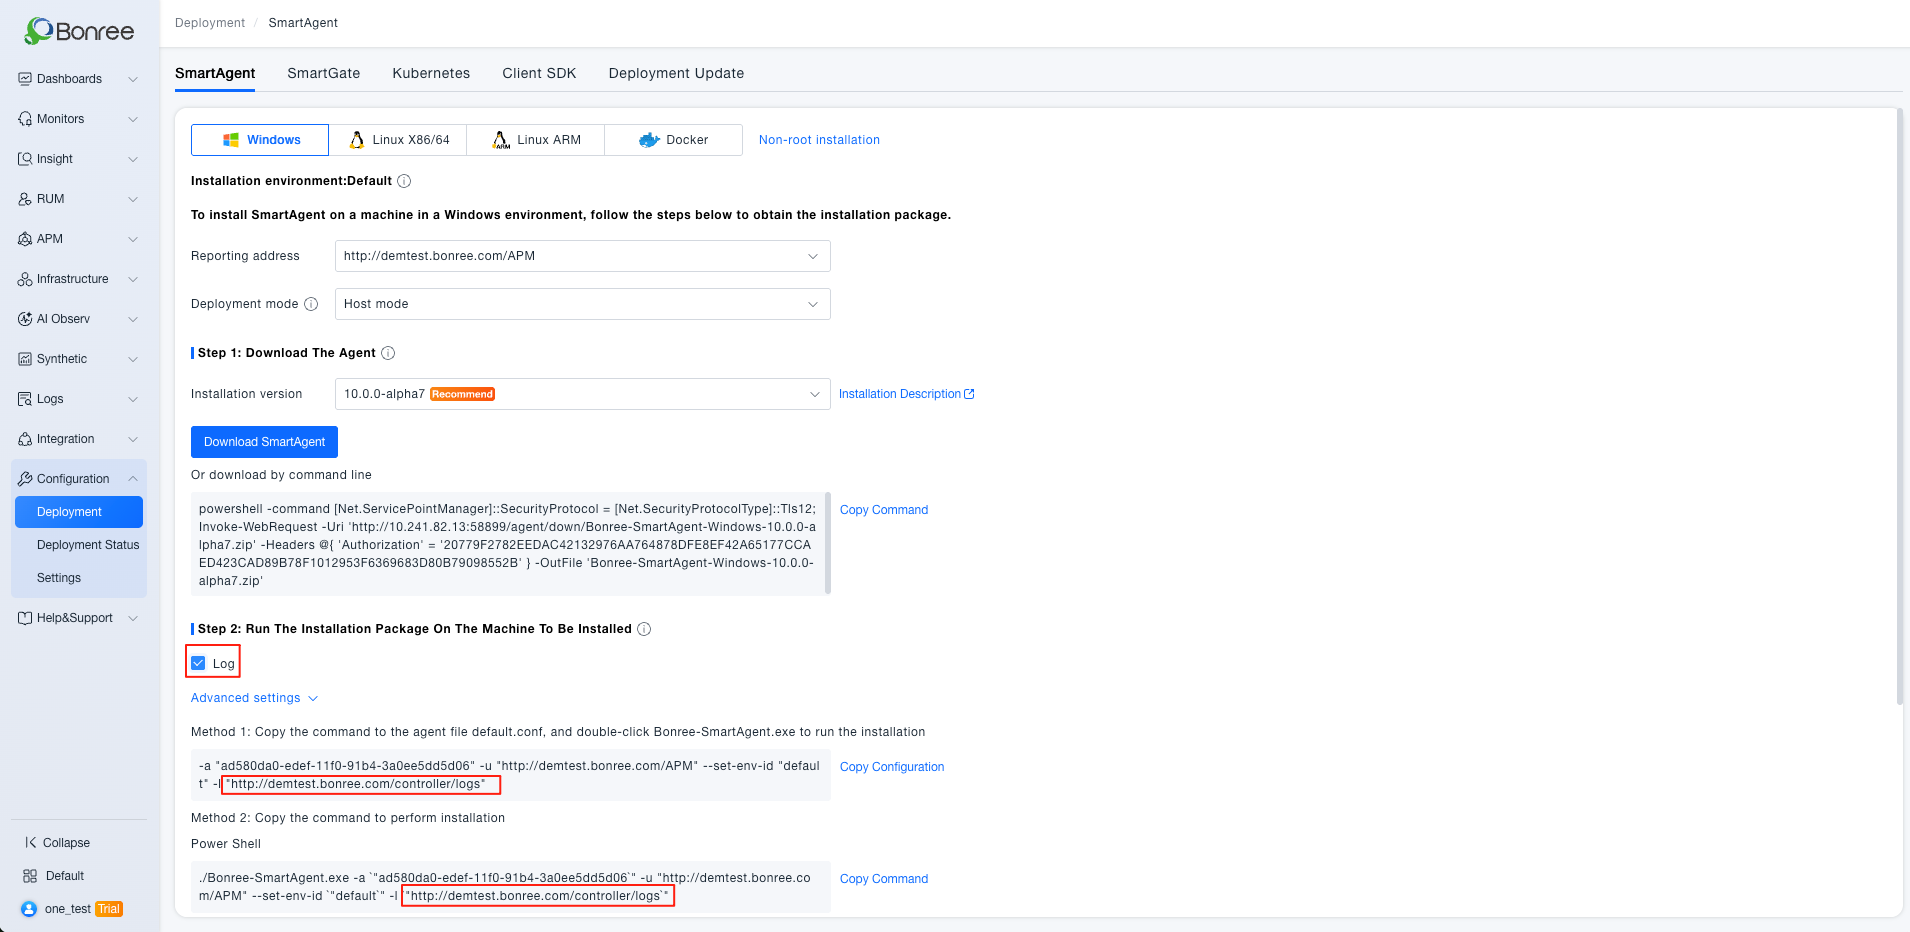
-
SmartAgent Windows Log Collection Configuration: A log collection toggle has been added to the Windows installation process, enabling convenient log ingestion in Windows environments.
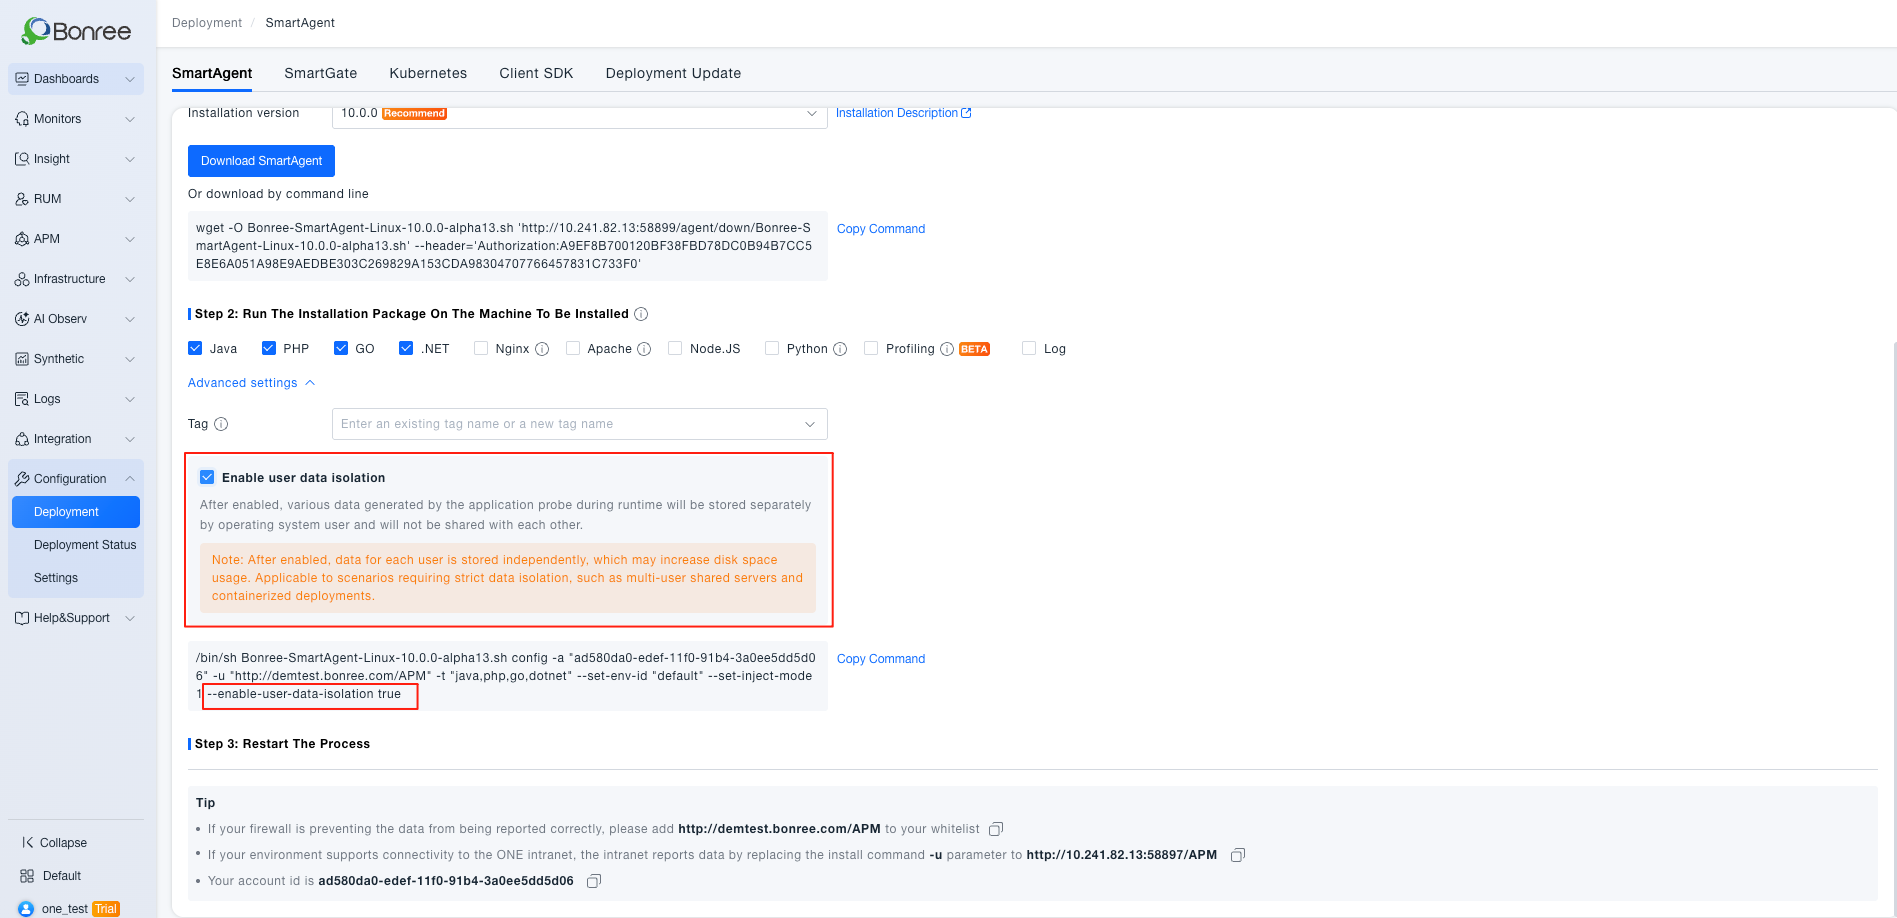
-
User Data Isolation Parameter for Probe Installation: A user data isolation startup parameter has been added to advanced settings, enabling probe runtime directory isolation for multi-user shared servers to meet data security and enterprise compliance audit requirements.
-
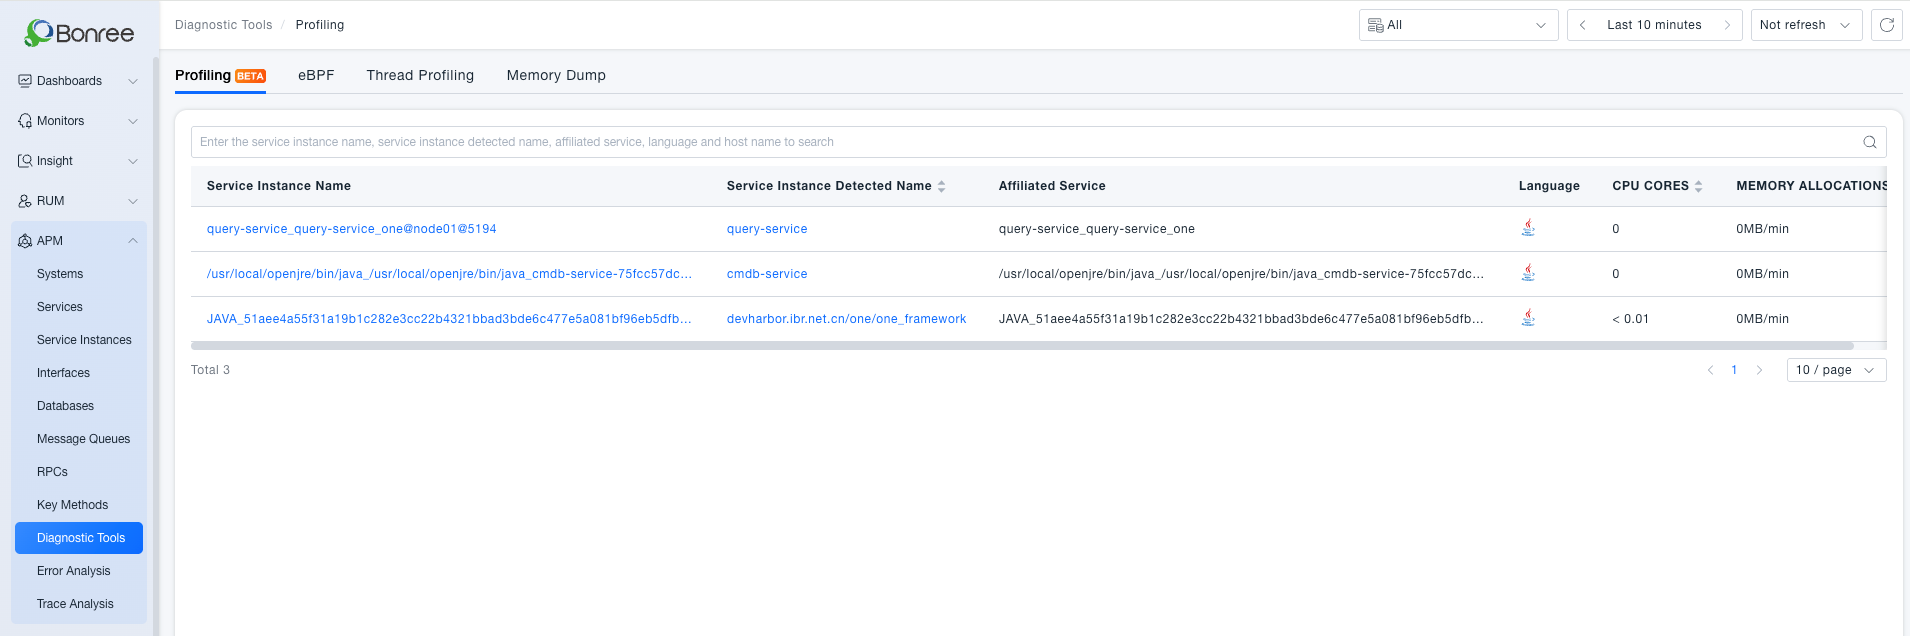
Profiling List Query Optimization: Profiling statistics upgraded to service instance level, breaking through query count limitations and improving the completeness and accuracy of performance profiling data.
-
Registration Reset Dialog Optimization: The reset dialog now includes operation instructions and risk warnings, enabling informed decision-making and reducing the risk of accidental operations.
-
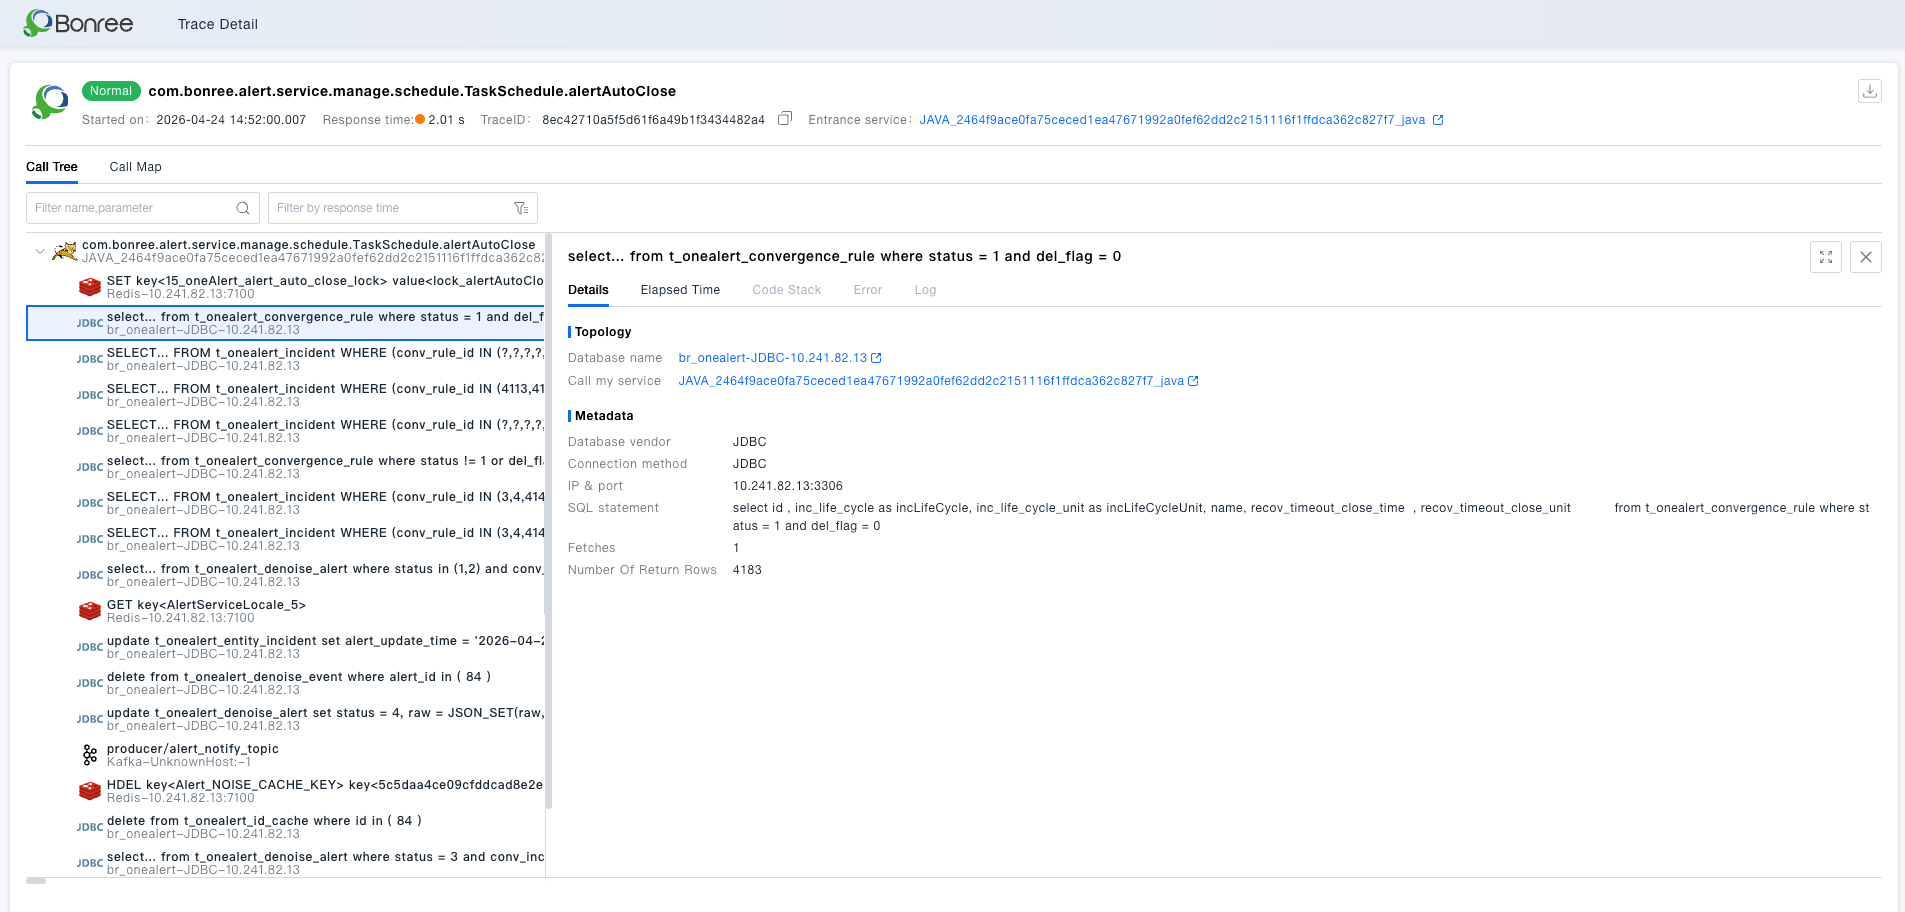
Trace Detail: SQL Return Row Info Added: Database call nodes now display return row count, Fetches, and other data, enriching SQL observability dimensions for faster identification of slow queries and abnormal access patterns.
-
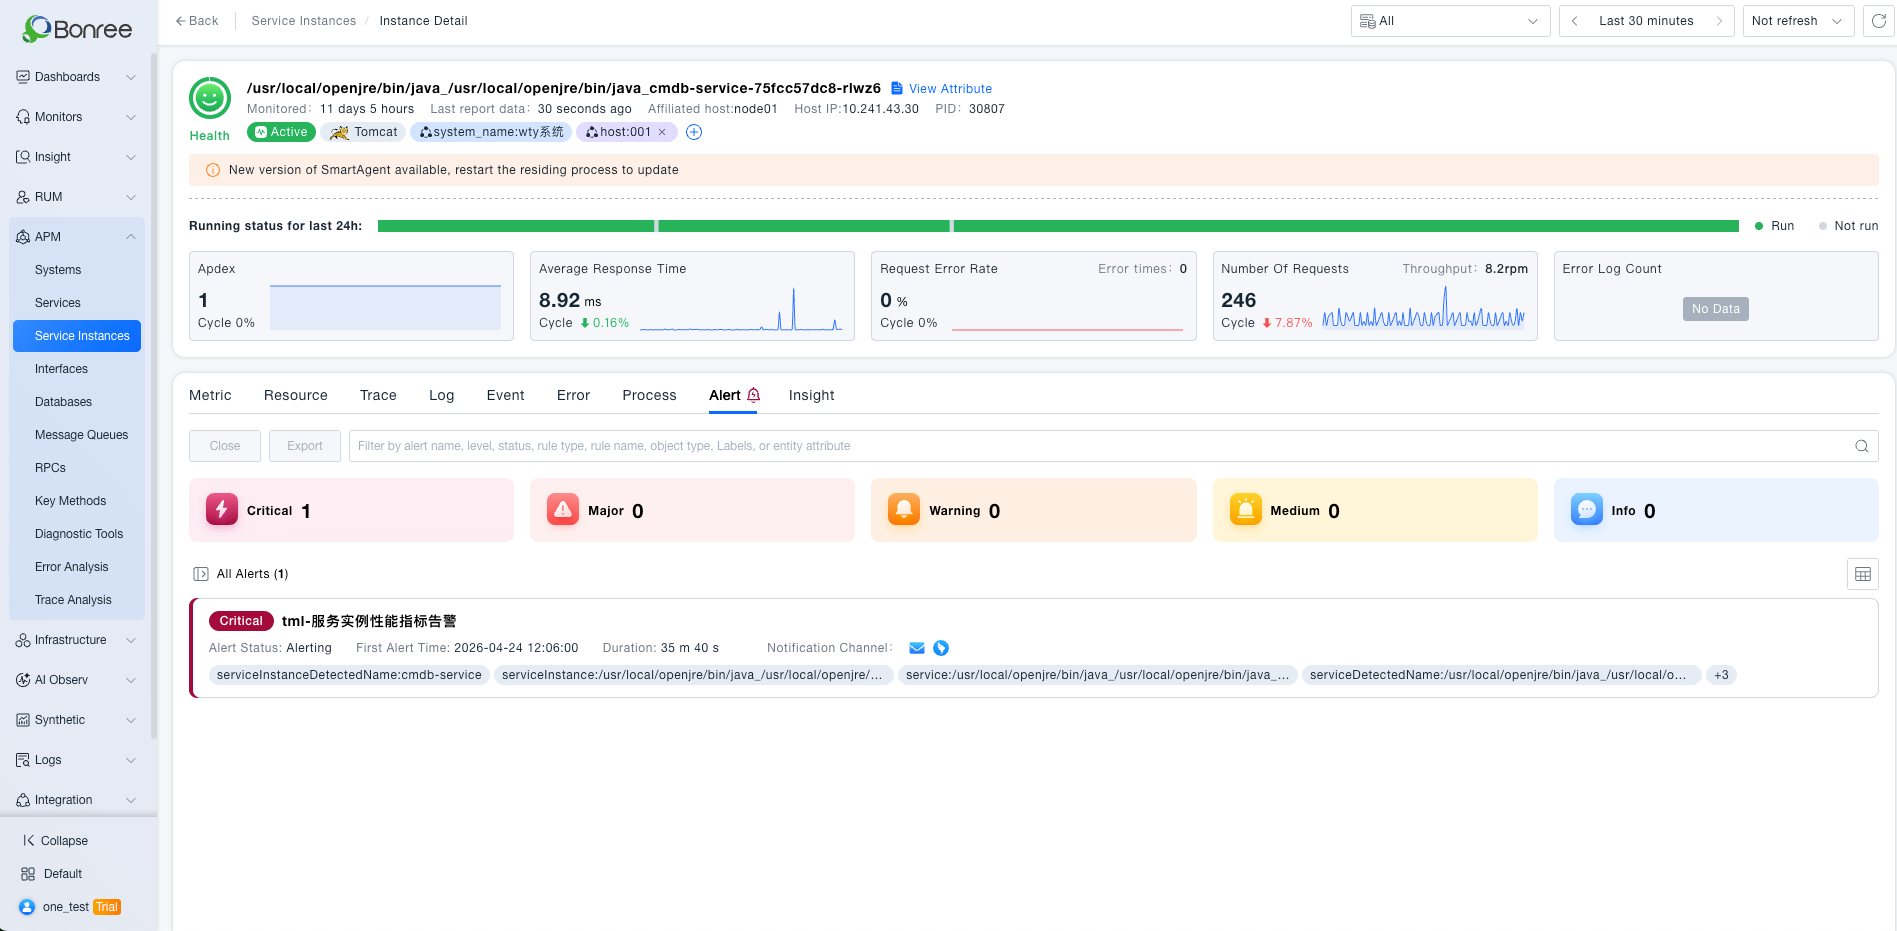
Entity Detail: Alert and Insight Tabs Separated: Alerts and insights in the entity detail page are now displayed in separate tabs, optimizing information hierarchy for a cleaner interface and improved troubleshooting efficiency.
-
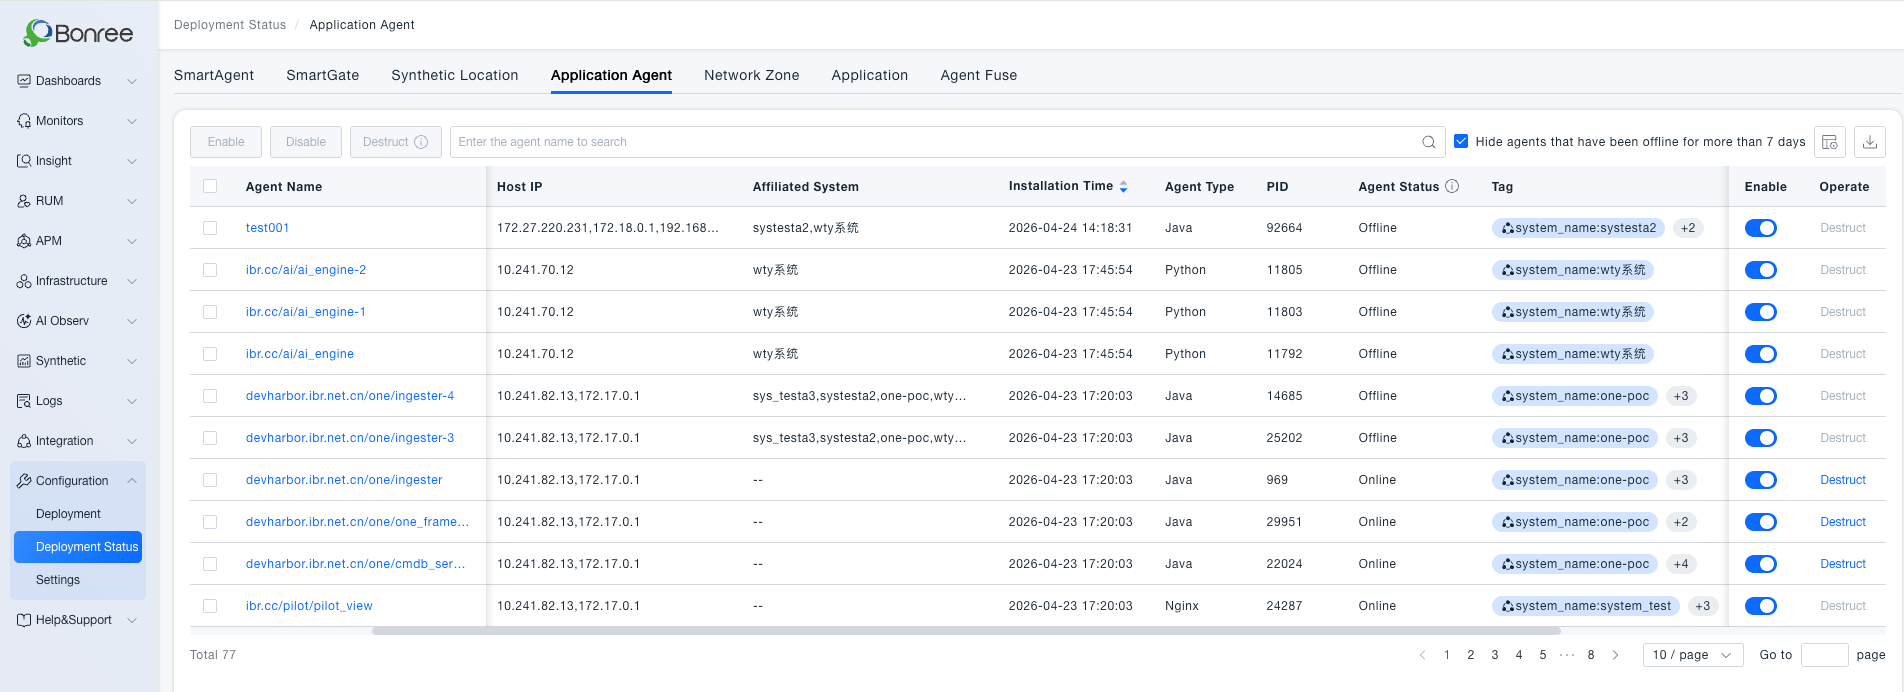
APM Probe Quota Fine-Grained Control: Optimized quota management logic and upgraded the probe management page to prevent over-limit access and improve large-scale probe management efficiency.
-
Call Chain Code Stack Depth Limit: Code stacks exceeding 500 layers are automatically truncated with a prompt, preventing excessive stack depth from causing page lag or crashes.
-
Trace Analysis Filter Async Loading: Filter entity data now loads on demand asynchronously, resolving page crashes and timeout issues in environments with massive entity volumes.
【RUM】
- Supports observing application runtime status from a page perspective.
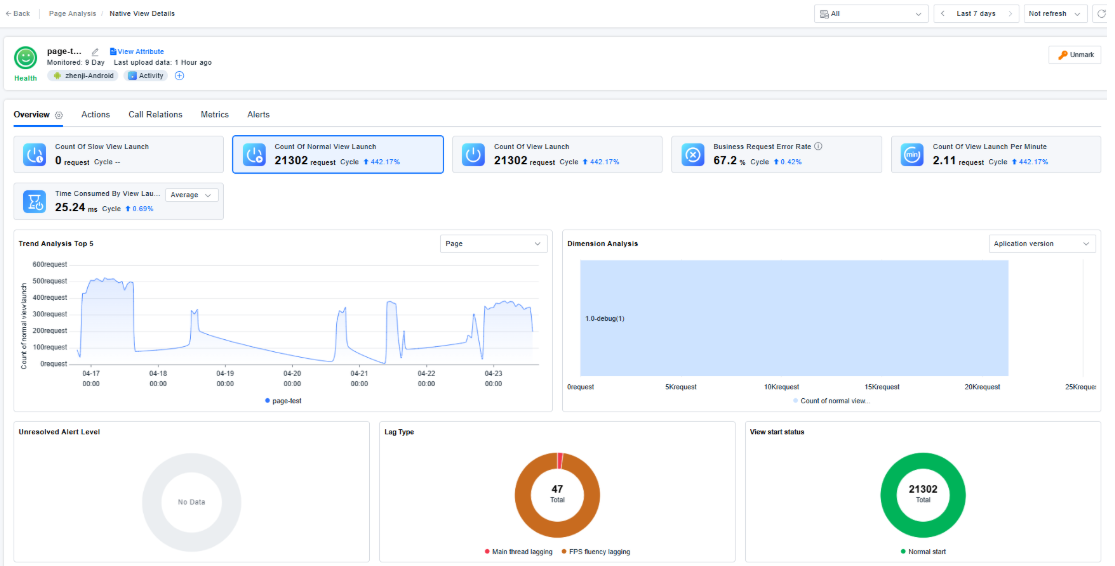
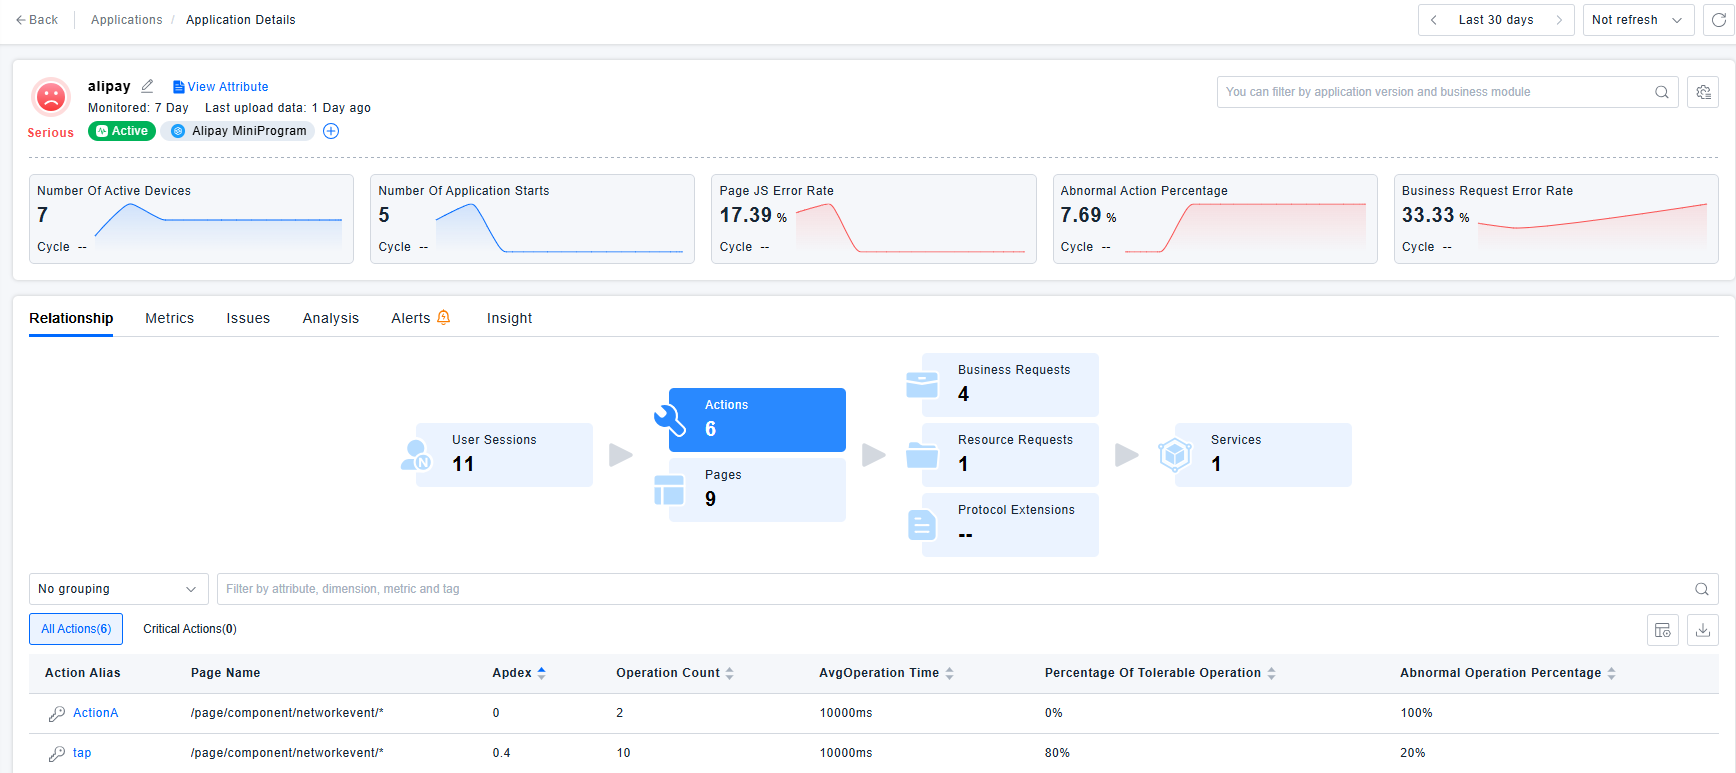
- Added observability capabilities for Alipay Mini Programs.
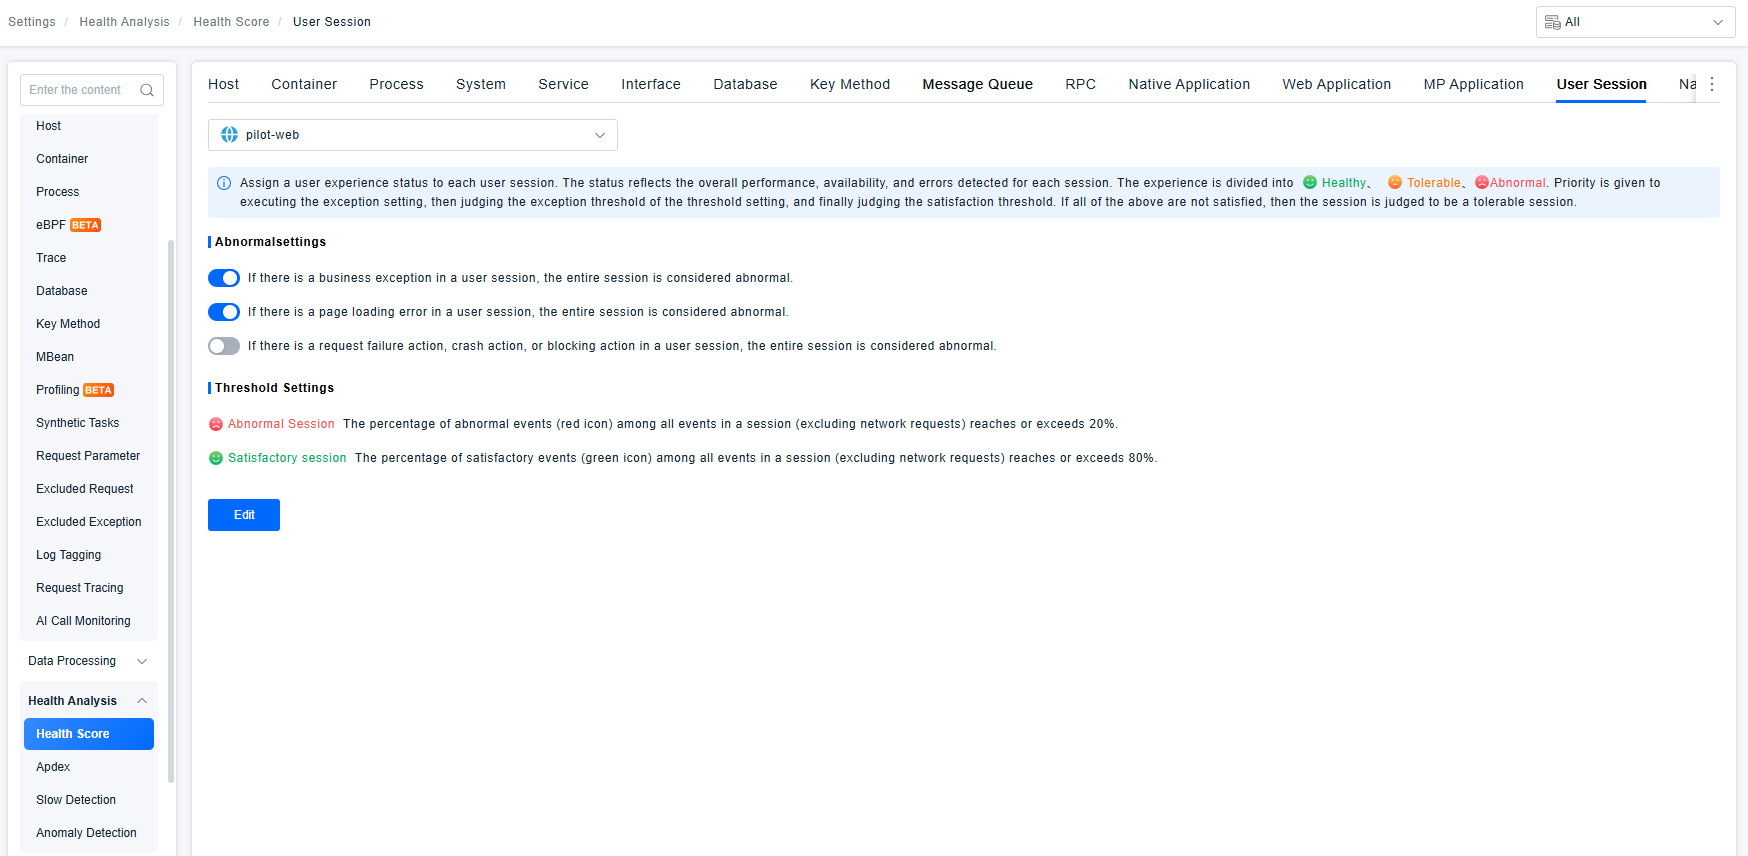
- Health score rules for web applications, native applications, mini-program applications, user sessions, pages, and views are now bound to the endpoint application. Entity recognition rules for business modules and user actions also support binding to the endpoint application, enabling configuration isolation per application.
- Metrics under the "Request Classification" category have been split into business requests and resource requests. The original request classification metrics are now hidden and can no longer be selected in dashboards or alerts. To ensure that previously configured request classification metrics can still query data correctly, the system automatically maps them to query only the values of business requests.
- HarmonyOS NEXT applications now support uploading multiple map symbol files and resolving stack traces.
- The RUM agents for Android, HarmonyOS NEXT, and iOS have added three new session creation logics: create a new session when an API is called; create a new session when no events occur for a default duration (10 minutes); automatically create a new session when the session duration exceeds the default maximum (8 hours). Nacos provides corresponding configurations: enabling/disabling the logics for "new session on no events for a certain duration" and "new session on exceeding max session duration" (both enabled by default); modifying the default values for the idle timeout and maximum session duration; and specifying specific applications to which these two logics do not apply.
- The auto-instrumentation wizard now supports the English version.
- Added dark theme.
- Refined menu permission control.
- Overall performance optimization.
- Corresponding adaptations made for dashboard sharing functionality.
- Completed adaptation for the new alerting component.
- Adapted disaster recovery solution: added support for hot configuration updates in the secondary center; the secondary center service is read-only for the MariaDB database.
- Fixed the issue where after adding
zt:1for an application in the "All Resource Domains" view, the application could not be seen immediately after switching to the "zt" resource domain; the related cache time has been reduced from 5 minutes to 3 minutes. - Fixed the definition text for user session health scores across various application types.
- In slow detection for application startup, view startup, page load, user action / slow action, and network requests, the original term "tolerable threshold" has been uniformly changed to "slow detection".
- For manually instrumented applications, modifying the configuration changes the instrumentation script; a re-instrumentation prompt has been added.
- Self‑requests are now explicitly noted to apply only to business requests and resource requests.
- Added a hint for page entity recognition: only takes effect for page addresses starting with the
http(s)://orfile://protocol. - Added a hint for network request entity recognition: only takes effect for business requests and resource requests.
- Fixed known vulnerabilities in open‑source components and third‑party dependency libraries.
- Fixed the issue where searching by user additional information in "Query Center – User Session" did not work.
- Fixed the issue where a TraceID empty string was displayed as a space in the network request record list.
- Fixed an error that occurred when searching on the user management page.
- Fixed the issue where, in the crash snapshot, the thread name displayed in the first line of the resolved stack trace did not match the original stack trace.
- Fixed the issue where, in session analysis – session details, the exported file name was displayed in English under Chinese mode.
【Alert】
-
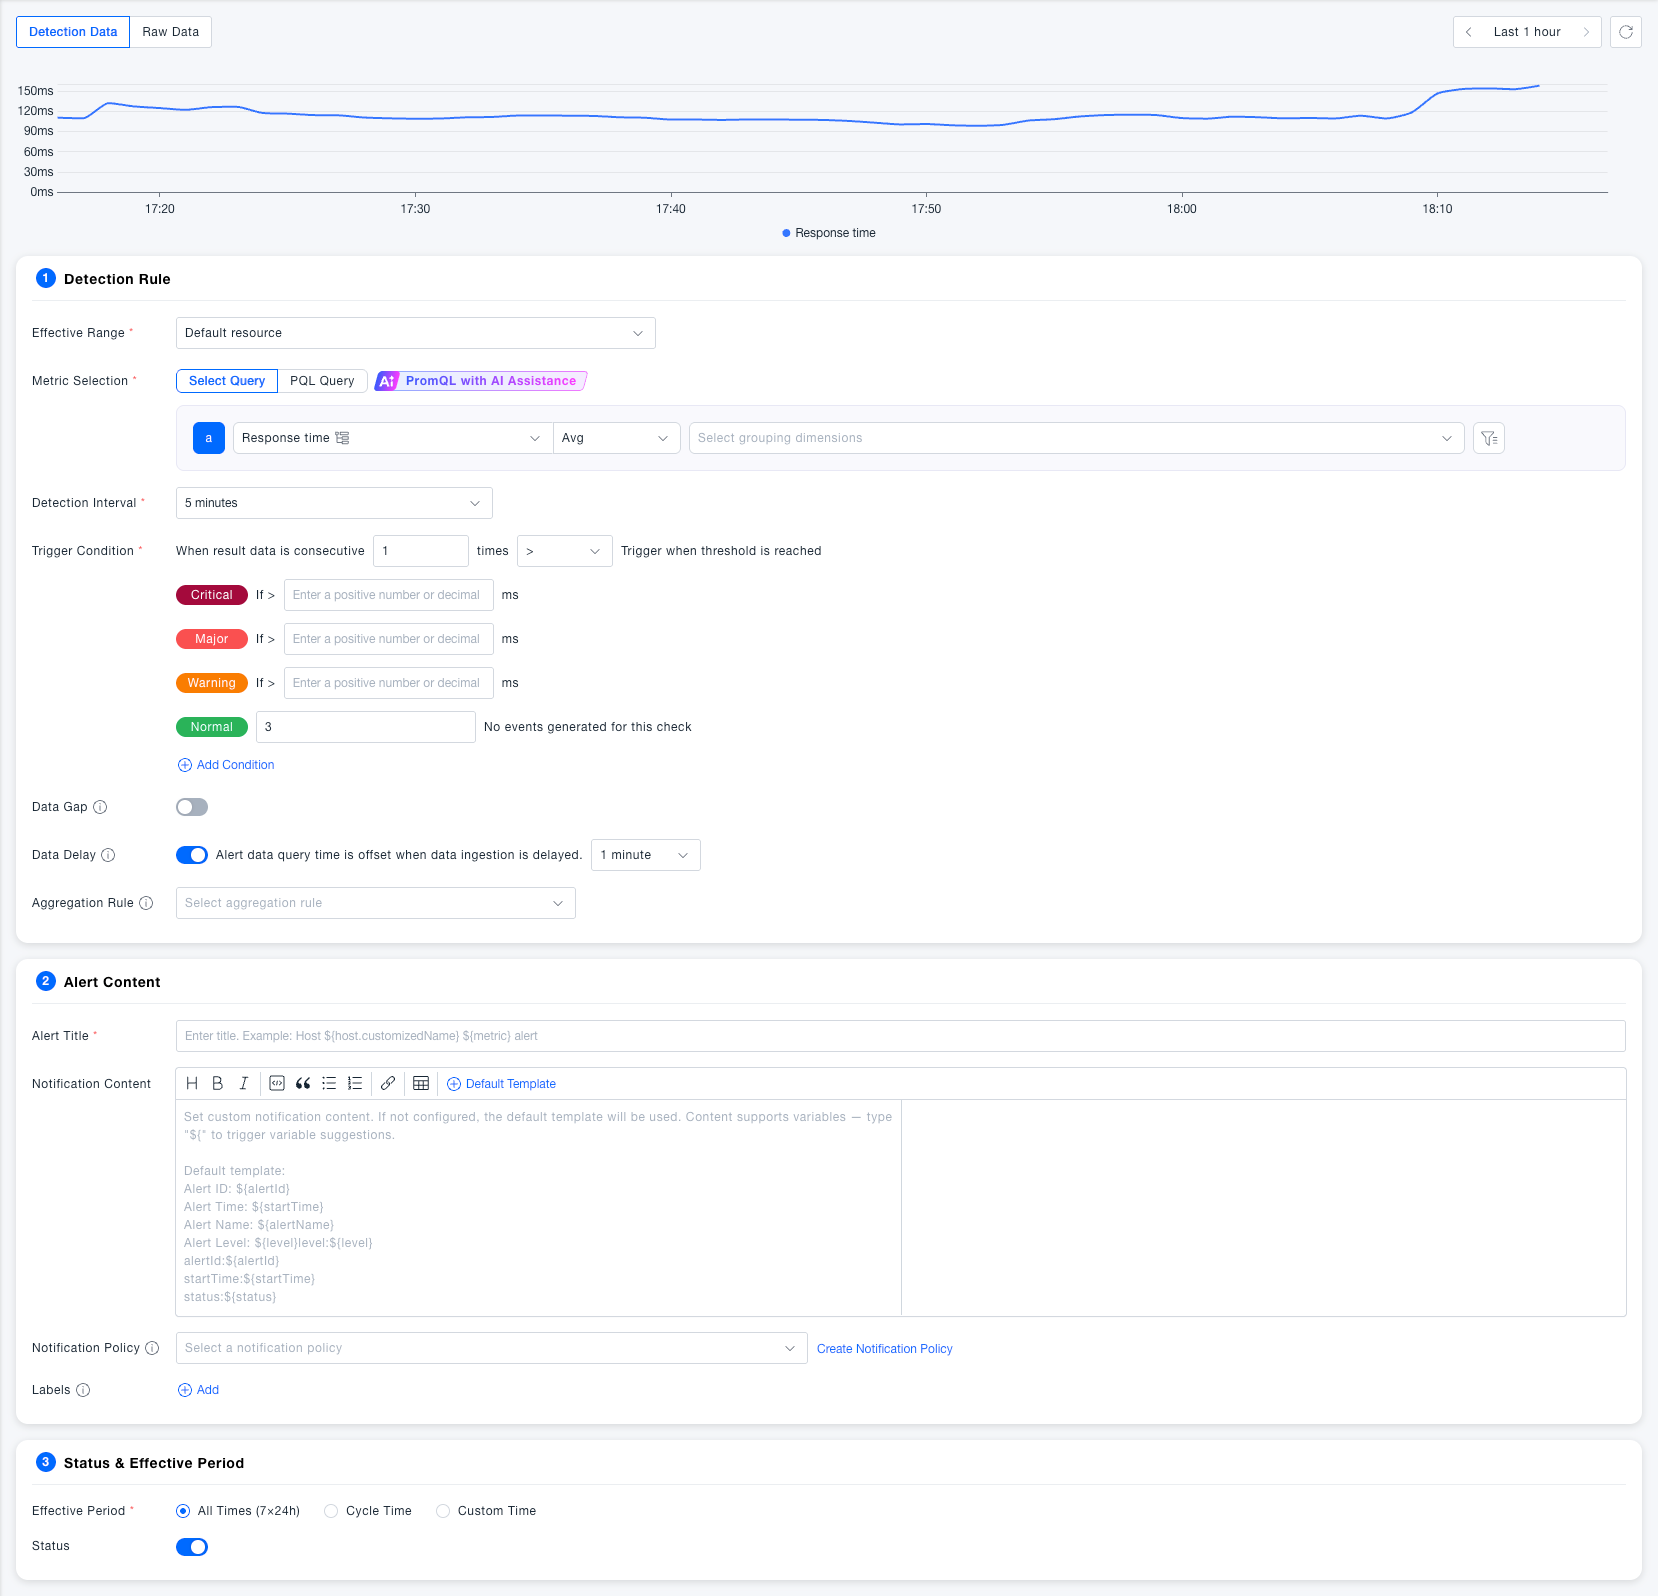
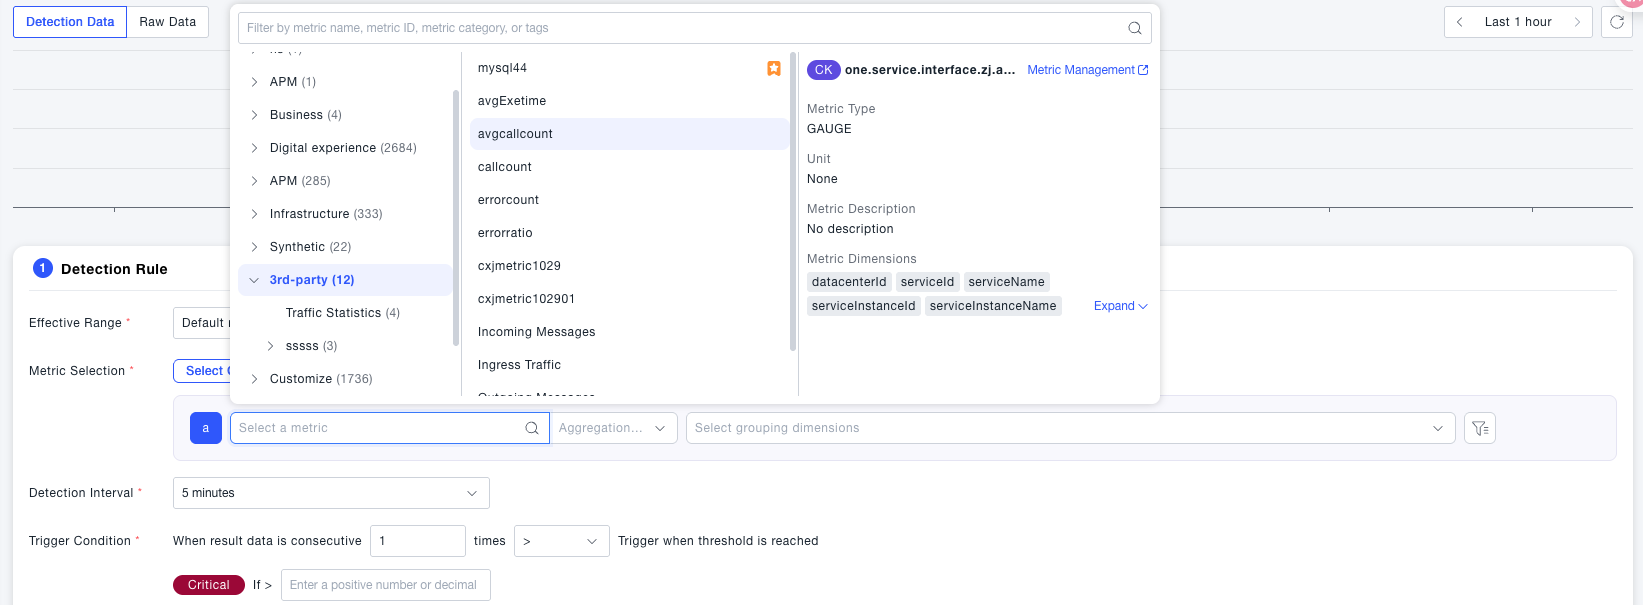
Brand-new interaction experience upgrade, simplifying the alert configuration process.
-
Adapted to the new query engine Titan, metric selection ignores data discrepancies, with full compatibility for CK and VM metric models.
-
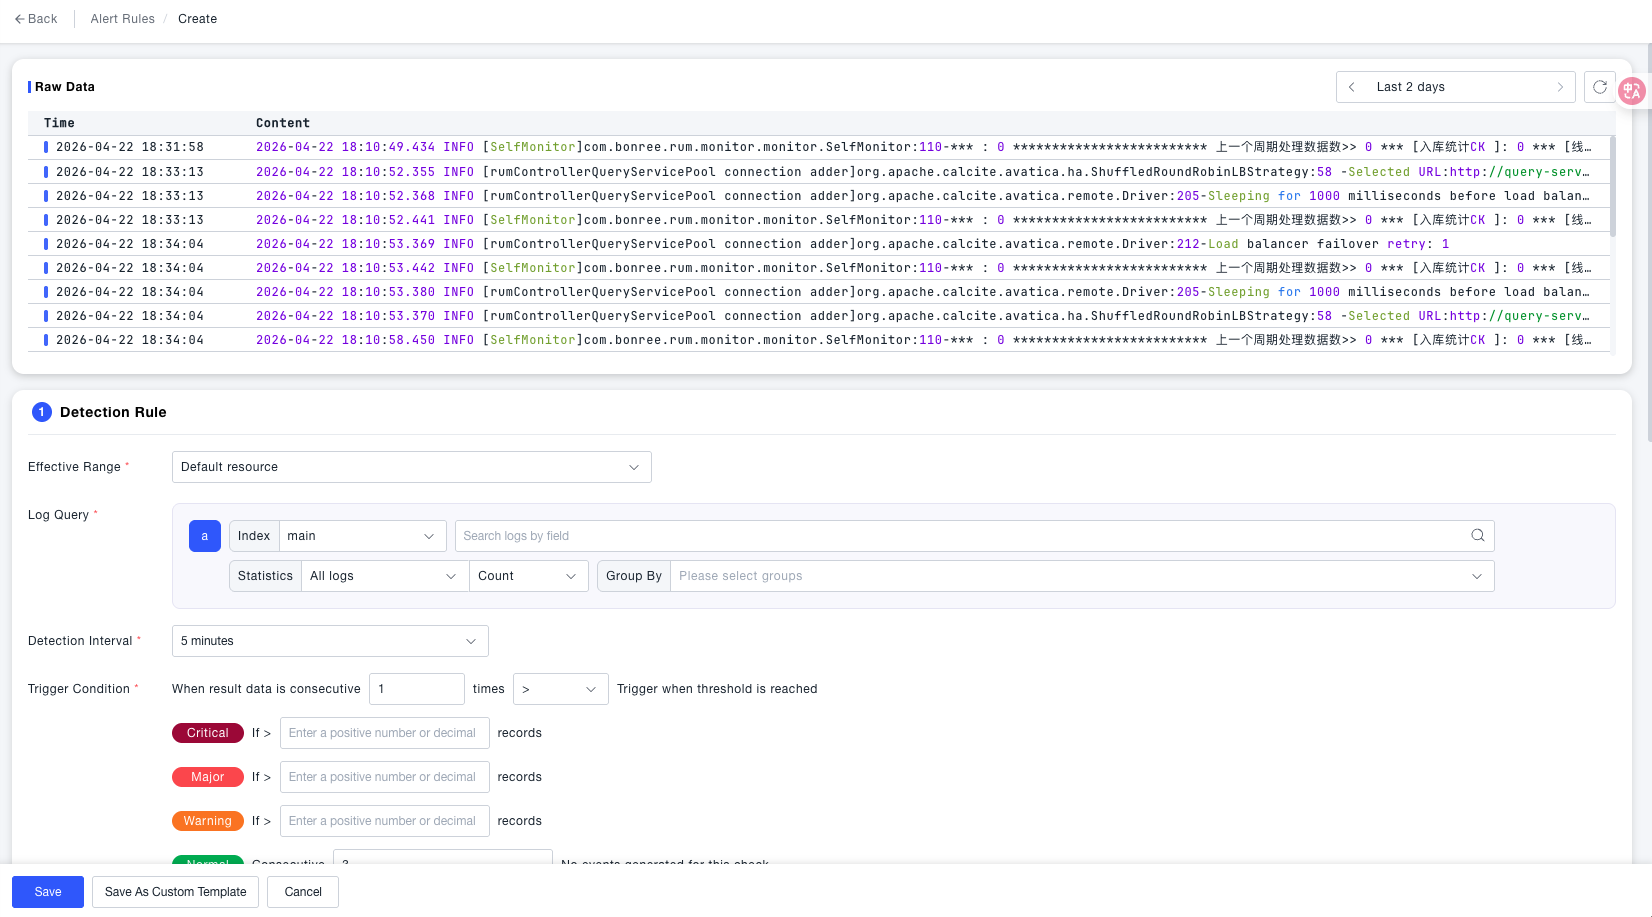
Log-based alerting now supported — trigger alerts by matching specified logs through log detection rules.
-
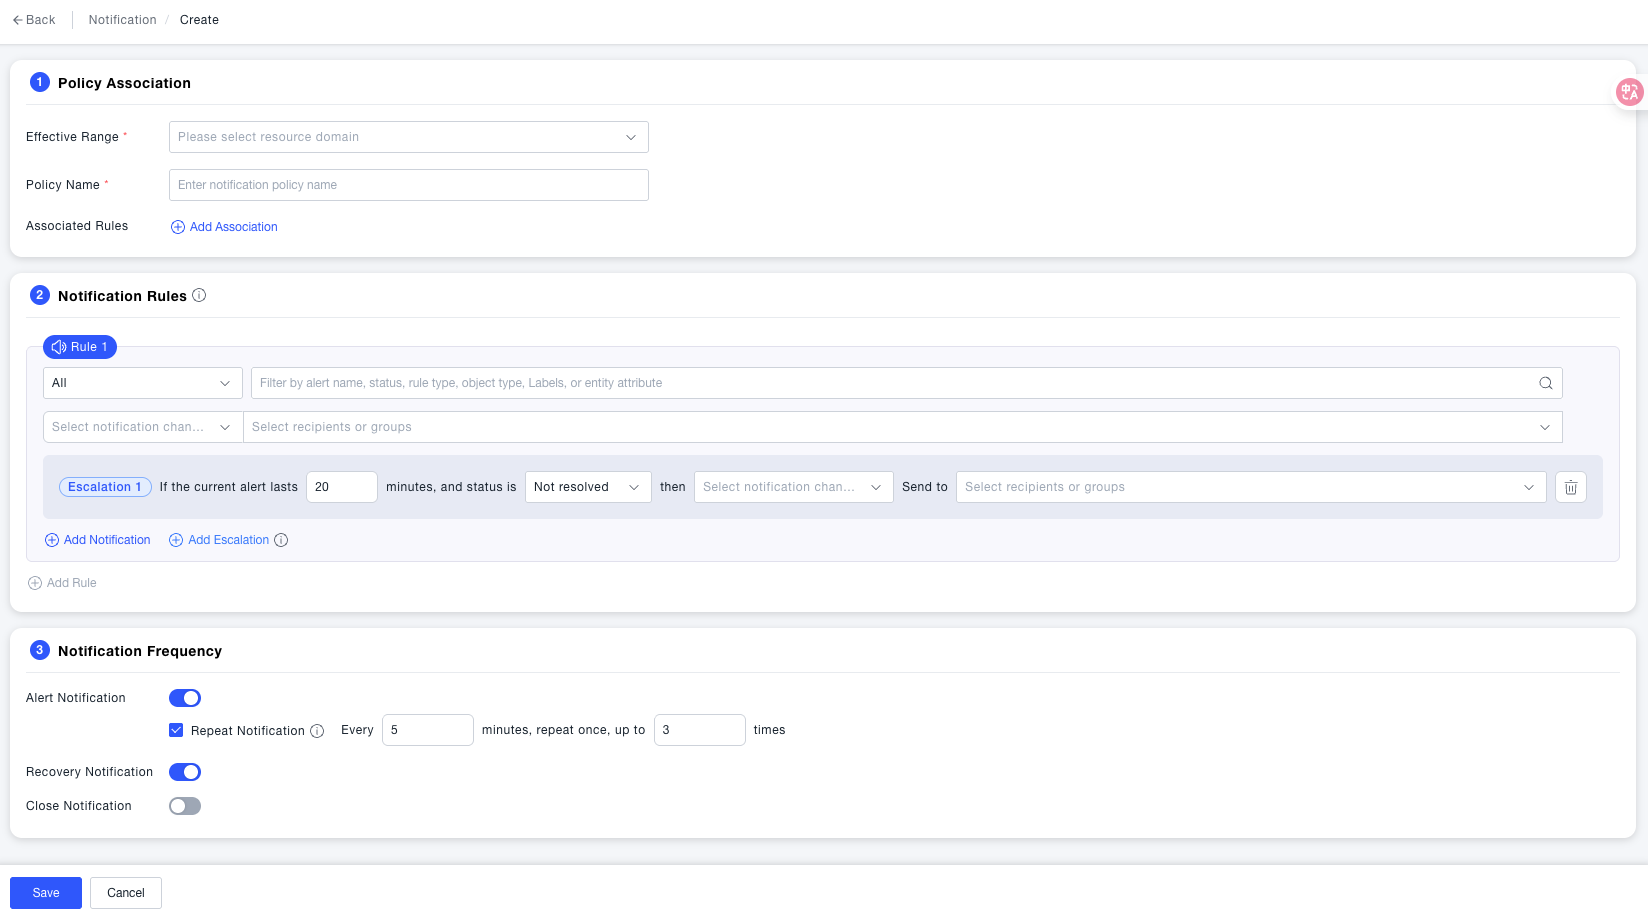
Notification policy redesigned, supporting dispatch by severity level and matching conditions. Escalation policy configuration is also supported.
-
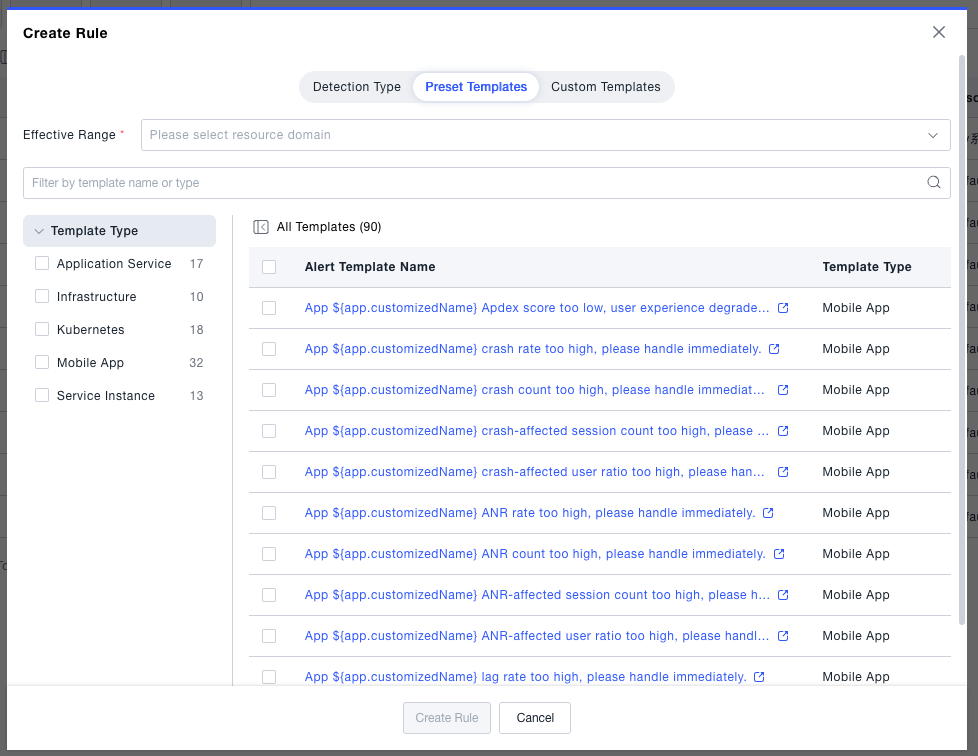
Preset templates available out of the box; custom templates make it faster to establish O&M standards.
【ANALYSIS】
- Metric, entity, and event queries have been migrated to Titan. All metrics now support querying via PQL.
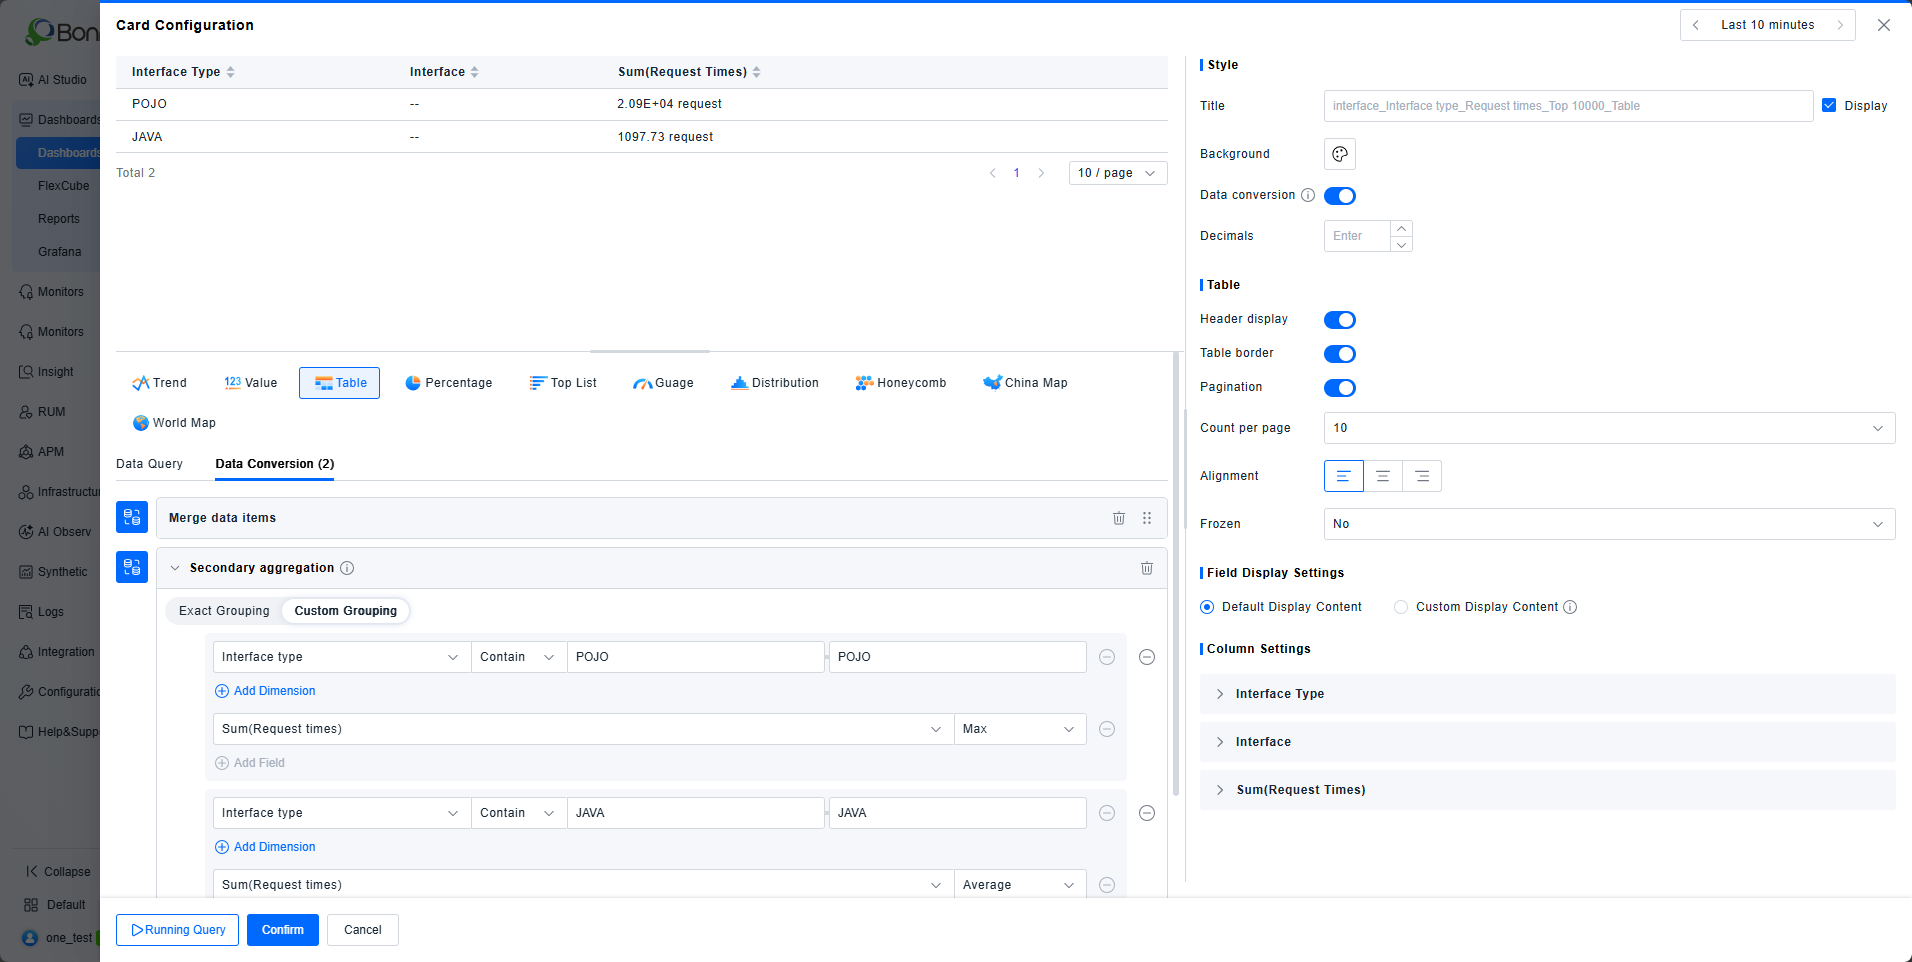
- Added post-aggregation support, enabling secondary grouping and calculation on query results by specifying dimensions or conditions.
- Added dark theme support for the One platform.
- View components now support scoping to selected instances, in addition to global and single-instance levels.
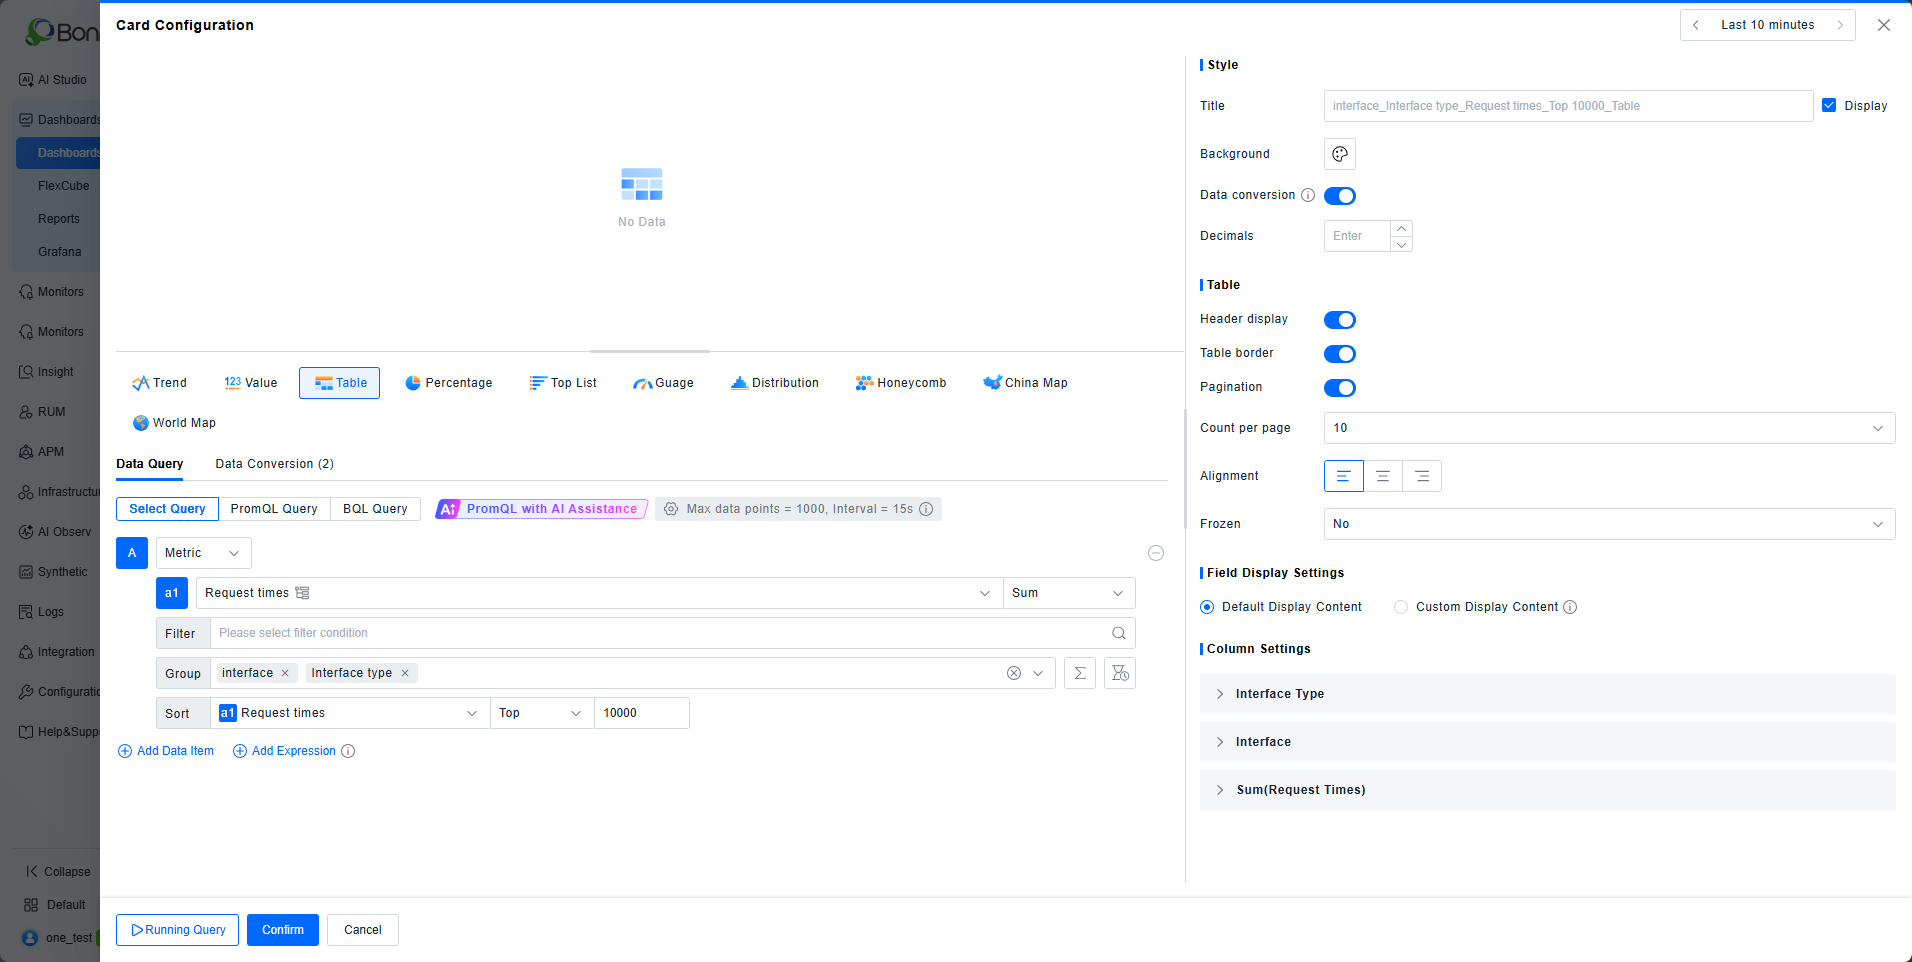
- List cards now default to querying the top 10,000 records, displaying the full query result set.
- The metric common component now determines the metric scope based on the primary entity and adapts to the metric system in effect for the current resource domain.
- Filter inputs now support inline suggestions for quick selection; data queries in dropdown lists no longer interfere with custom option selection.
- Workbench now supports Alipay Mini Program icons.
- Automated report configuration has been updated to support users and user groups.
- Unavailable interactions in default interaction mode are now hidden.
- DataCube pages configured as external pages will now reload the configured URL when re-selected from the DataCube menu.
- Fixed an issue where the modified time and refresh interval of dashboards shared with sub-accounts were not saved.
- Fixed an issue where sharing a dashboard or DataCube with both a specific user and "All Groups" caused individual user permissions to be overridden.
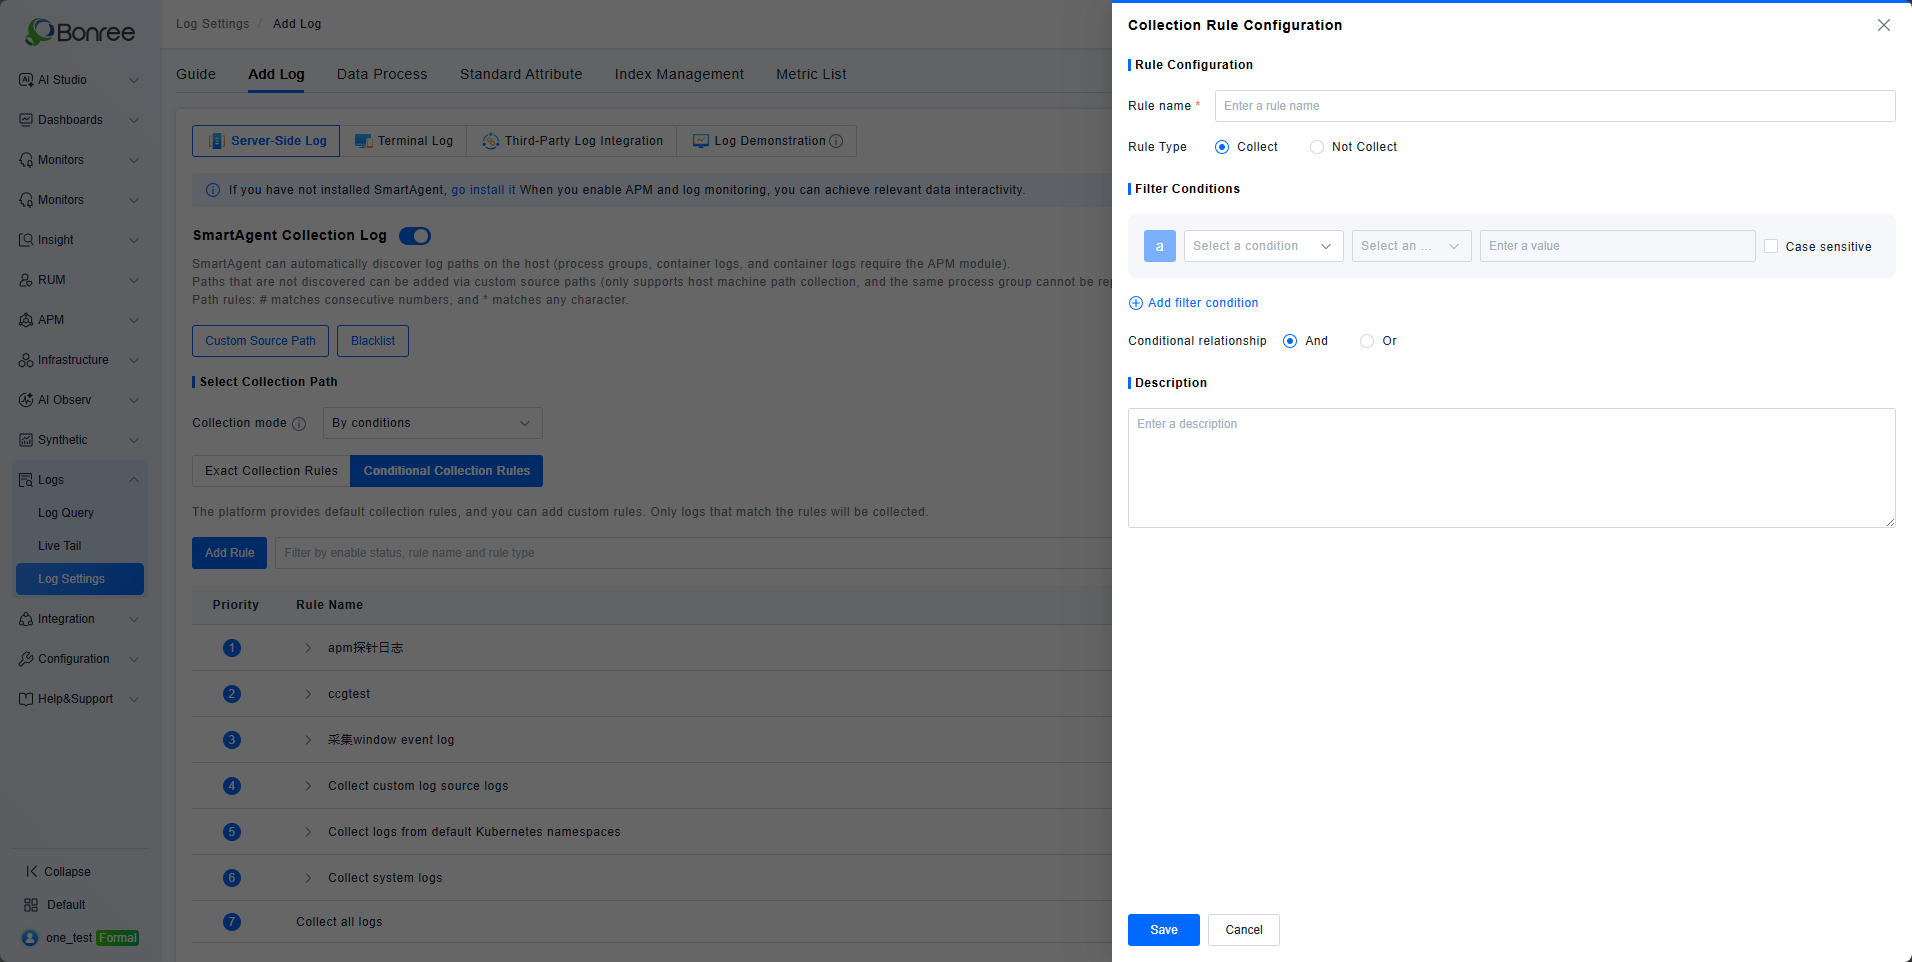
【LOG】
- Added support for disaster recovery architecture adaptation. Added log collection support for Windows probes.
- Introduced conditional collection mode, where only paths matching user-defined configuration rules will be collected.
- Added dark theme support for the platform.
- Added support for a new billing type based on daily log ingestion volume.
- The maximum display row count configuration is now persisted, eliminating the need to reconfigure after each modification.
- The query button has been removed; queries are now automatically triggered whenever filter conditions are modified.
- Fixed an issue where custom source path association with process groups did not support container stdout log association with process groups.
- Fixed an issue where the blocklist configuration option was set to process name but was actually applied based on executable name.
【ETL】
- Added dark theme support for the One platform.
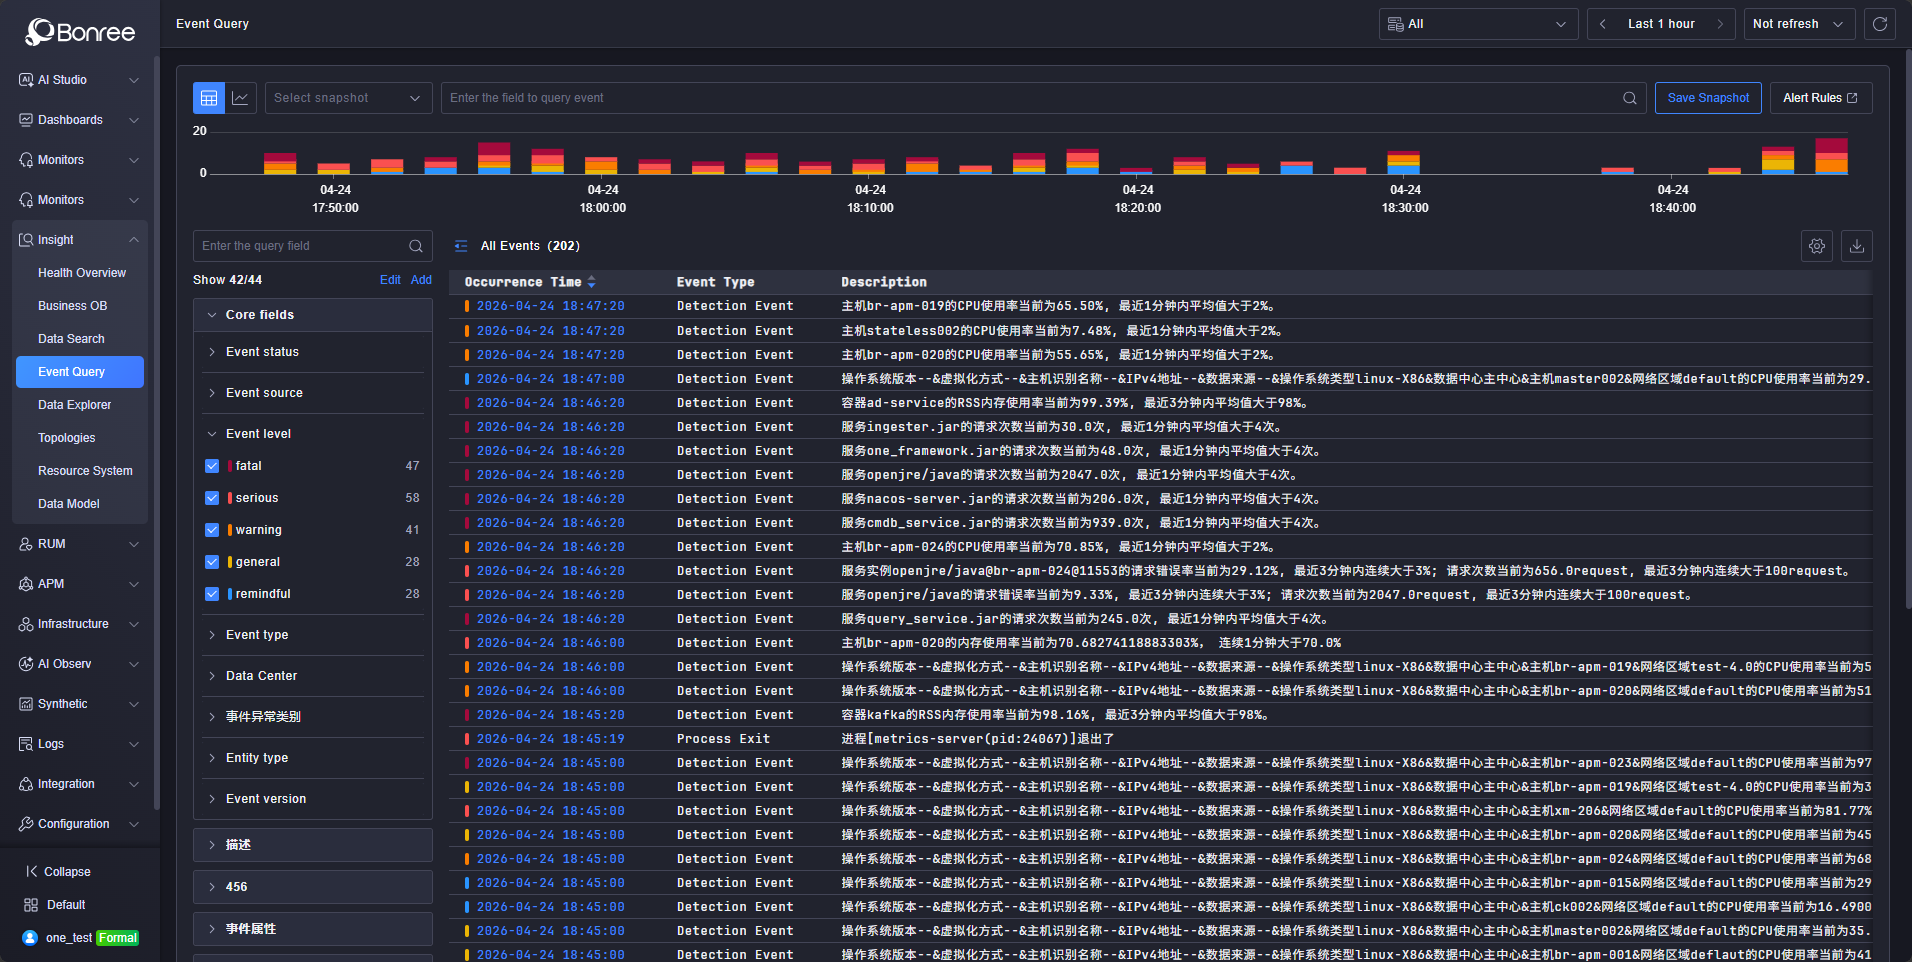
- Adjusted the snapshot layout in the Event Center.
- When an event attribute value is empty, quick filter now automatically applies "is empty" / "is not empty" conditions.
- Event Center interactions have been updated to support the new alerting system, with navigation redirecting to the corresponding rule page.
- Fixed an issue where query interface errors still returned HTTP status code 200.
- Fixed duplicate entries appearing in condition quick filter options.
- Fixed a data center field display issue where the data center condition was shared between event attributes and card-level filters, causing conflicts.
【STM】
- Performance optimization
- Adapted dark theme support
- Adapted disaster recovery solution
- Incremental scripts corrected according to CMDB specifications
【IAM】
- Added new billing item logic
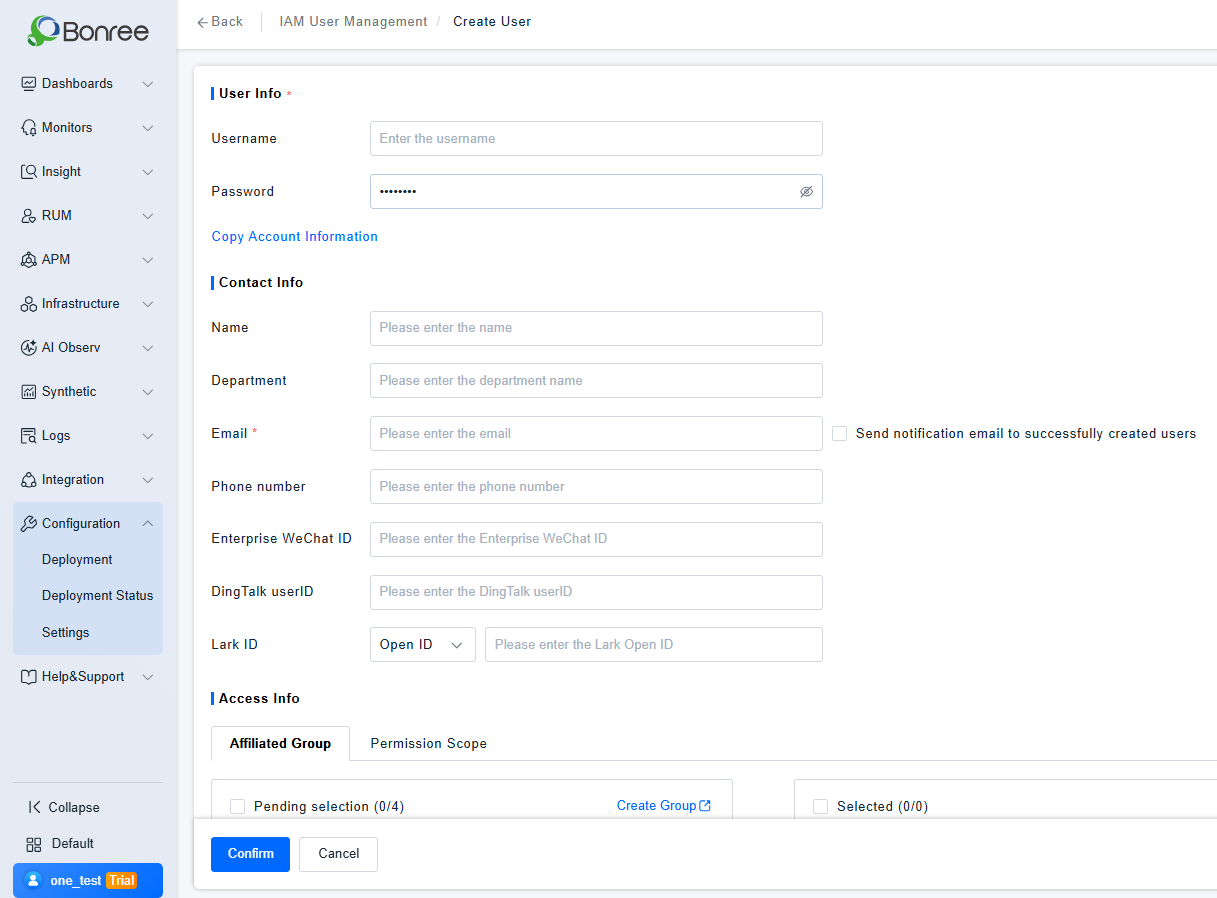
- Recipient capabilities merged into primary account and IAM user management; receiving group capabilities merged into IAM group management; added WeChat Work ID, DingTalk user ID, and Feishu ID to primary account and IAM users.
- License types displayed on ONE platform: Normal, Trial.
- Differentiated access URLs: URLs that display only IAM user login, URLs that display only primary account login, URLs that display only SSO login, and URLs that support login switching between IAM users and primary account.
- Added Alipay Mini Program to client agent management.
- Adapted dark theme support.
- Adapted disaster recovery solution: ONE platform disaster recovery is governed by a single license; at any given time, only one of the active or standby instances can be active.
- Billing item units now support dynamic conversion.
- Billing items belonging to the same module are displayed adjacently.
- Optimized the interaction between license status and billing item status.
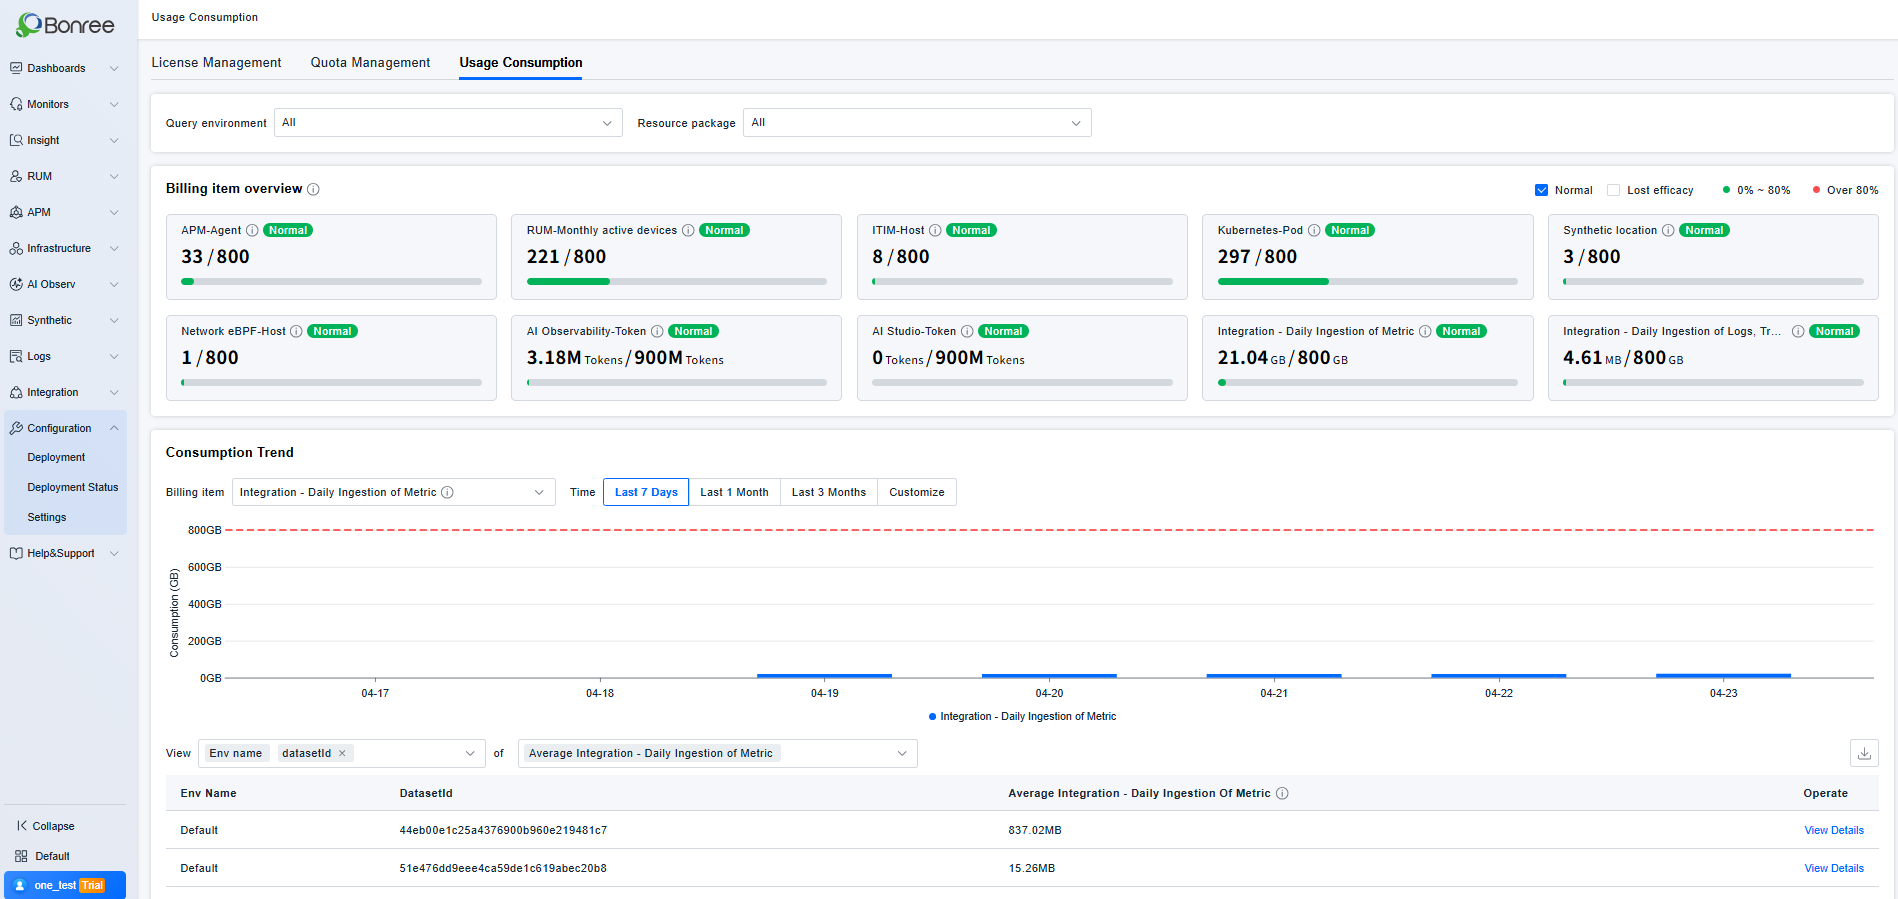
- Usage consumption: Added identification for normally used licenses.
- Fixed the inconsistency between the billing item overview and the consumption list.
- Fixed the inconsistency in the number of displayed node name entries.
- Corrected the usage consumption copy for the admin account.
【SmartAgent】
【SmartGate】
【SDK】
- HarmonyOS NEXT applications now support uploading multiple map symbol files and resolving stack traces.
- The RUM agents for Android, HarmonyOS NEXT, and iOS have added three new session creation logics: create a new session when an API is called; create a new session when no events occur for a default duration (10 minutes); automatically create a new session when the session duration exceeds the default maximum (8 hours). Nacos provides corresponding configurations: enabling/disabling the logics for "new session on no events for a certain duration" and "new session on exceeding max session duration" (both enabled by default); modifying the default values for the idle timeout and maximum session duration; and specifying specific applications to which these two logics do not apply.
- The auto-instrumentation wizard now supports the English version.
- Android SDK: adapted for Kotlin lambda.
- Android SDK: compatibility adaptation with Ruishu security SDK.
- Web application instrumentation: supports npm import.
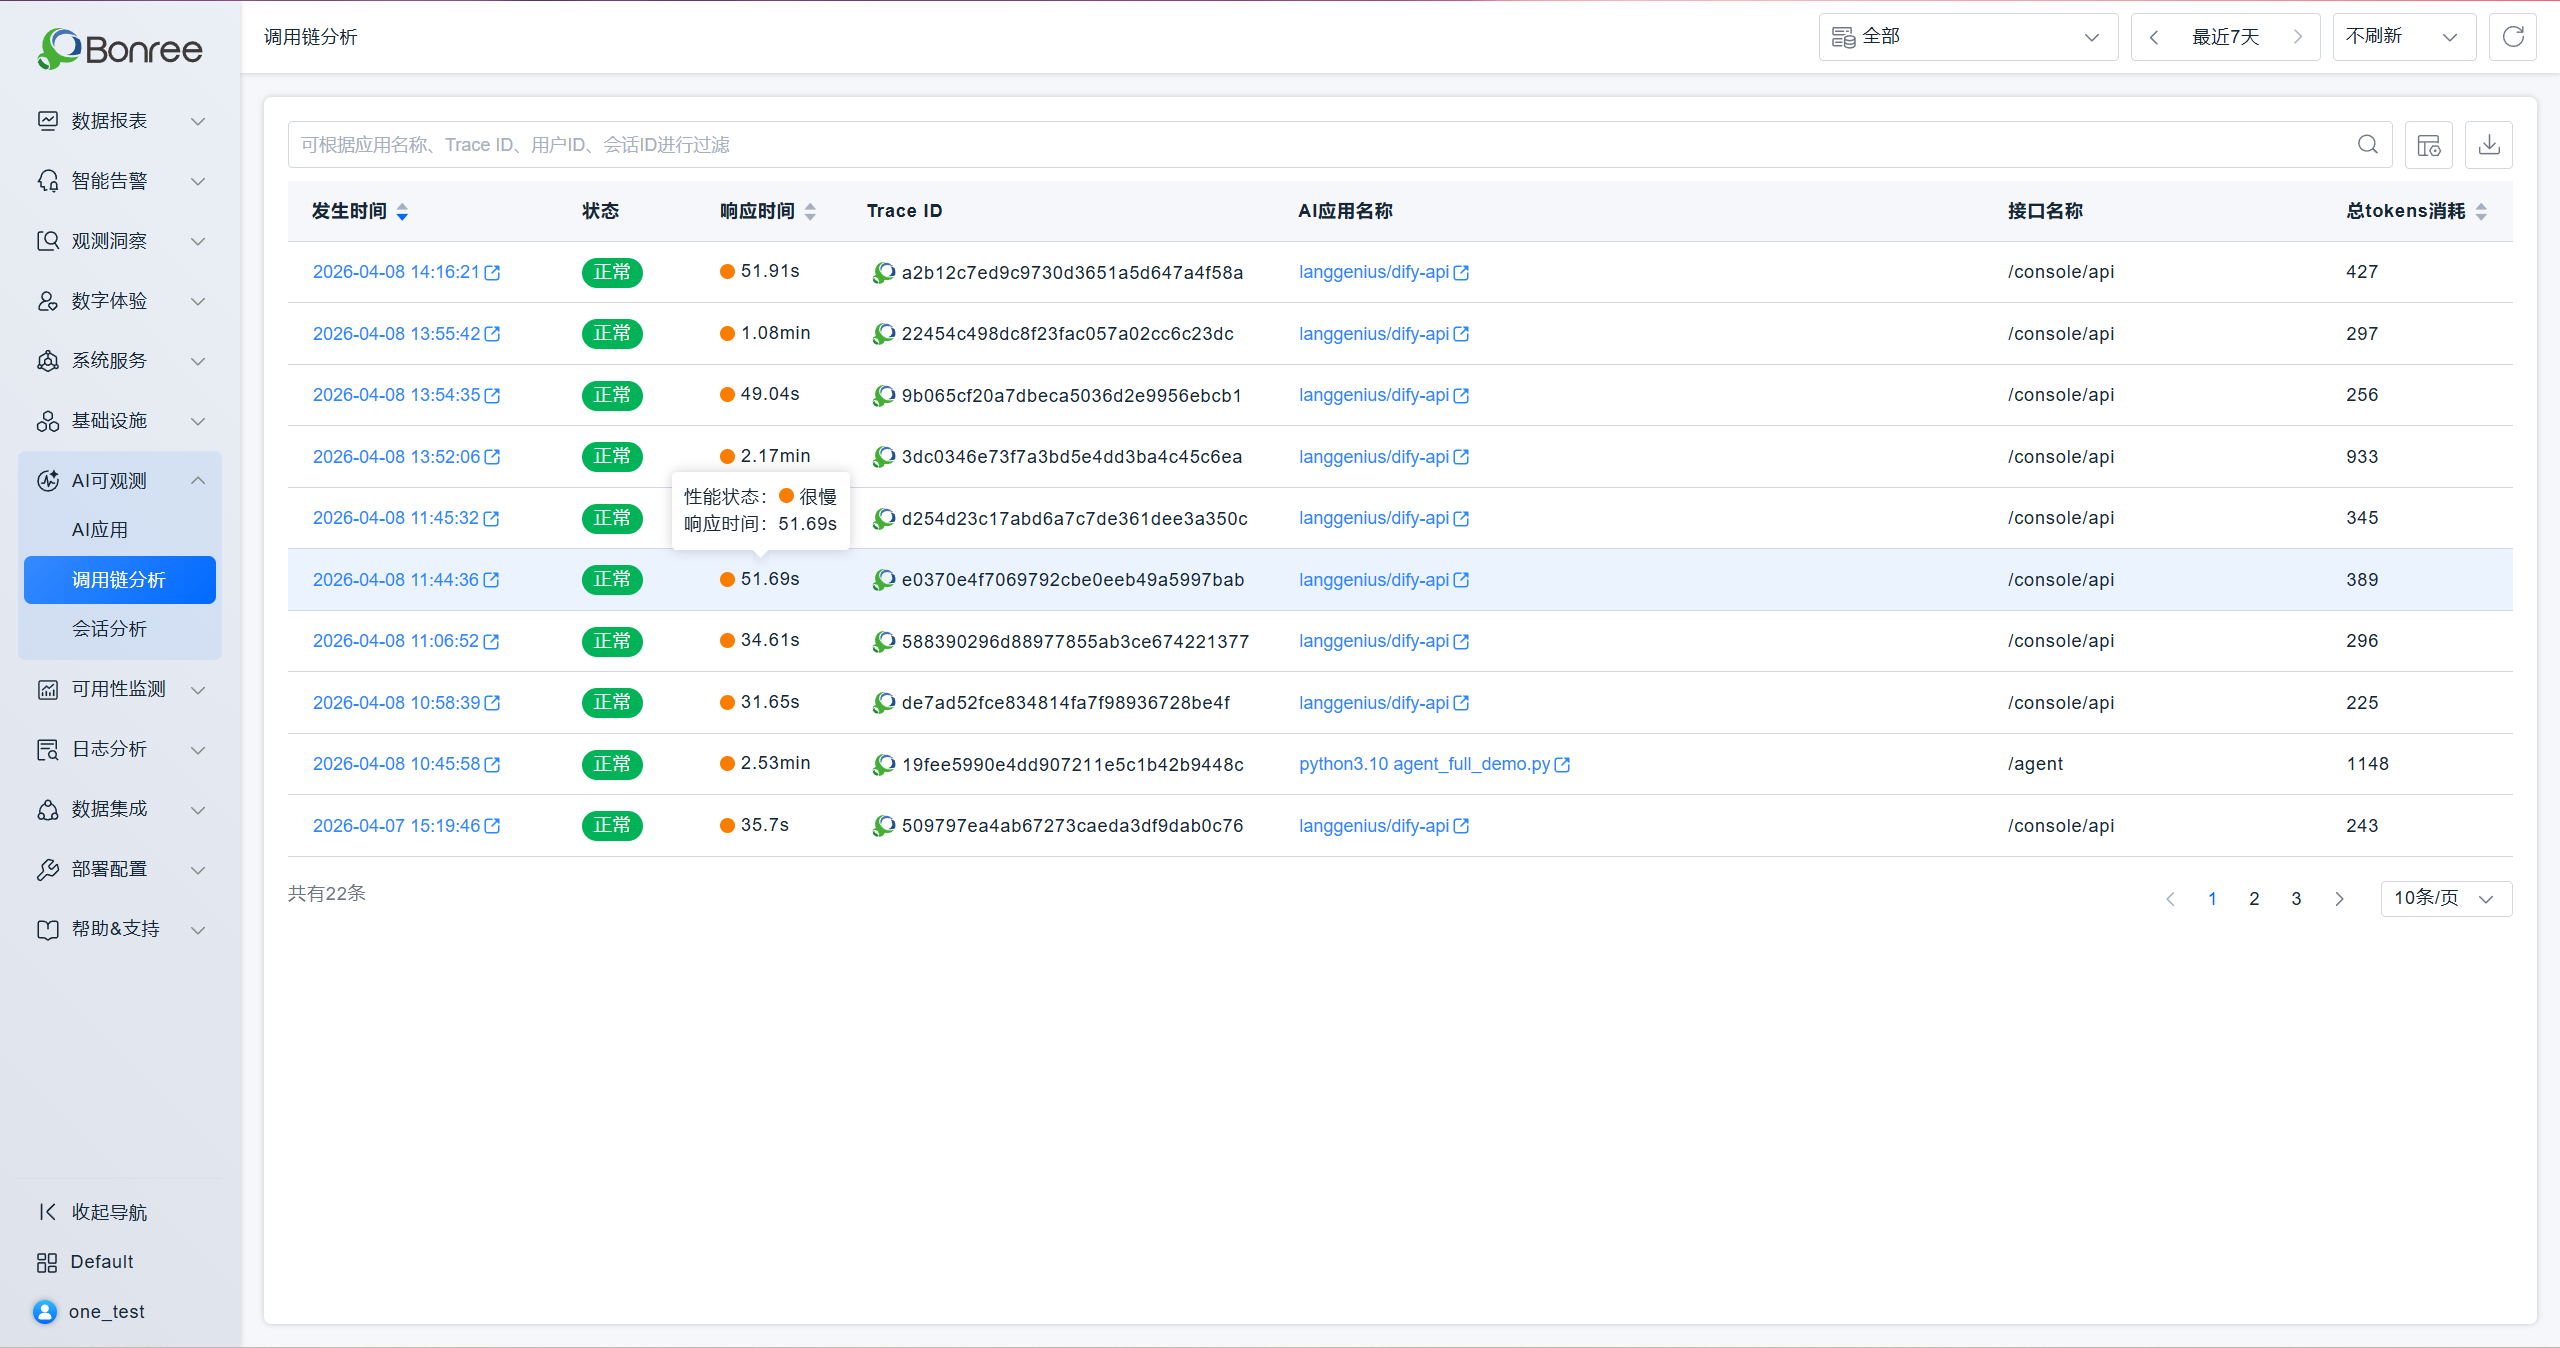
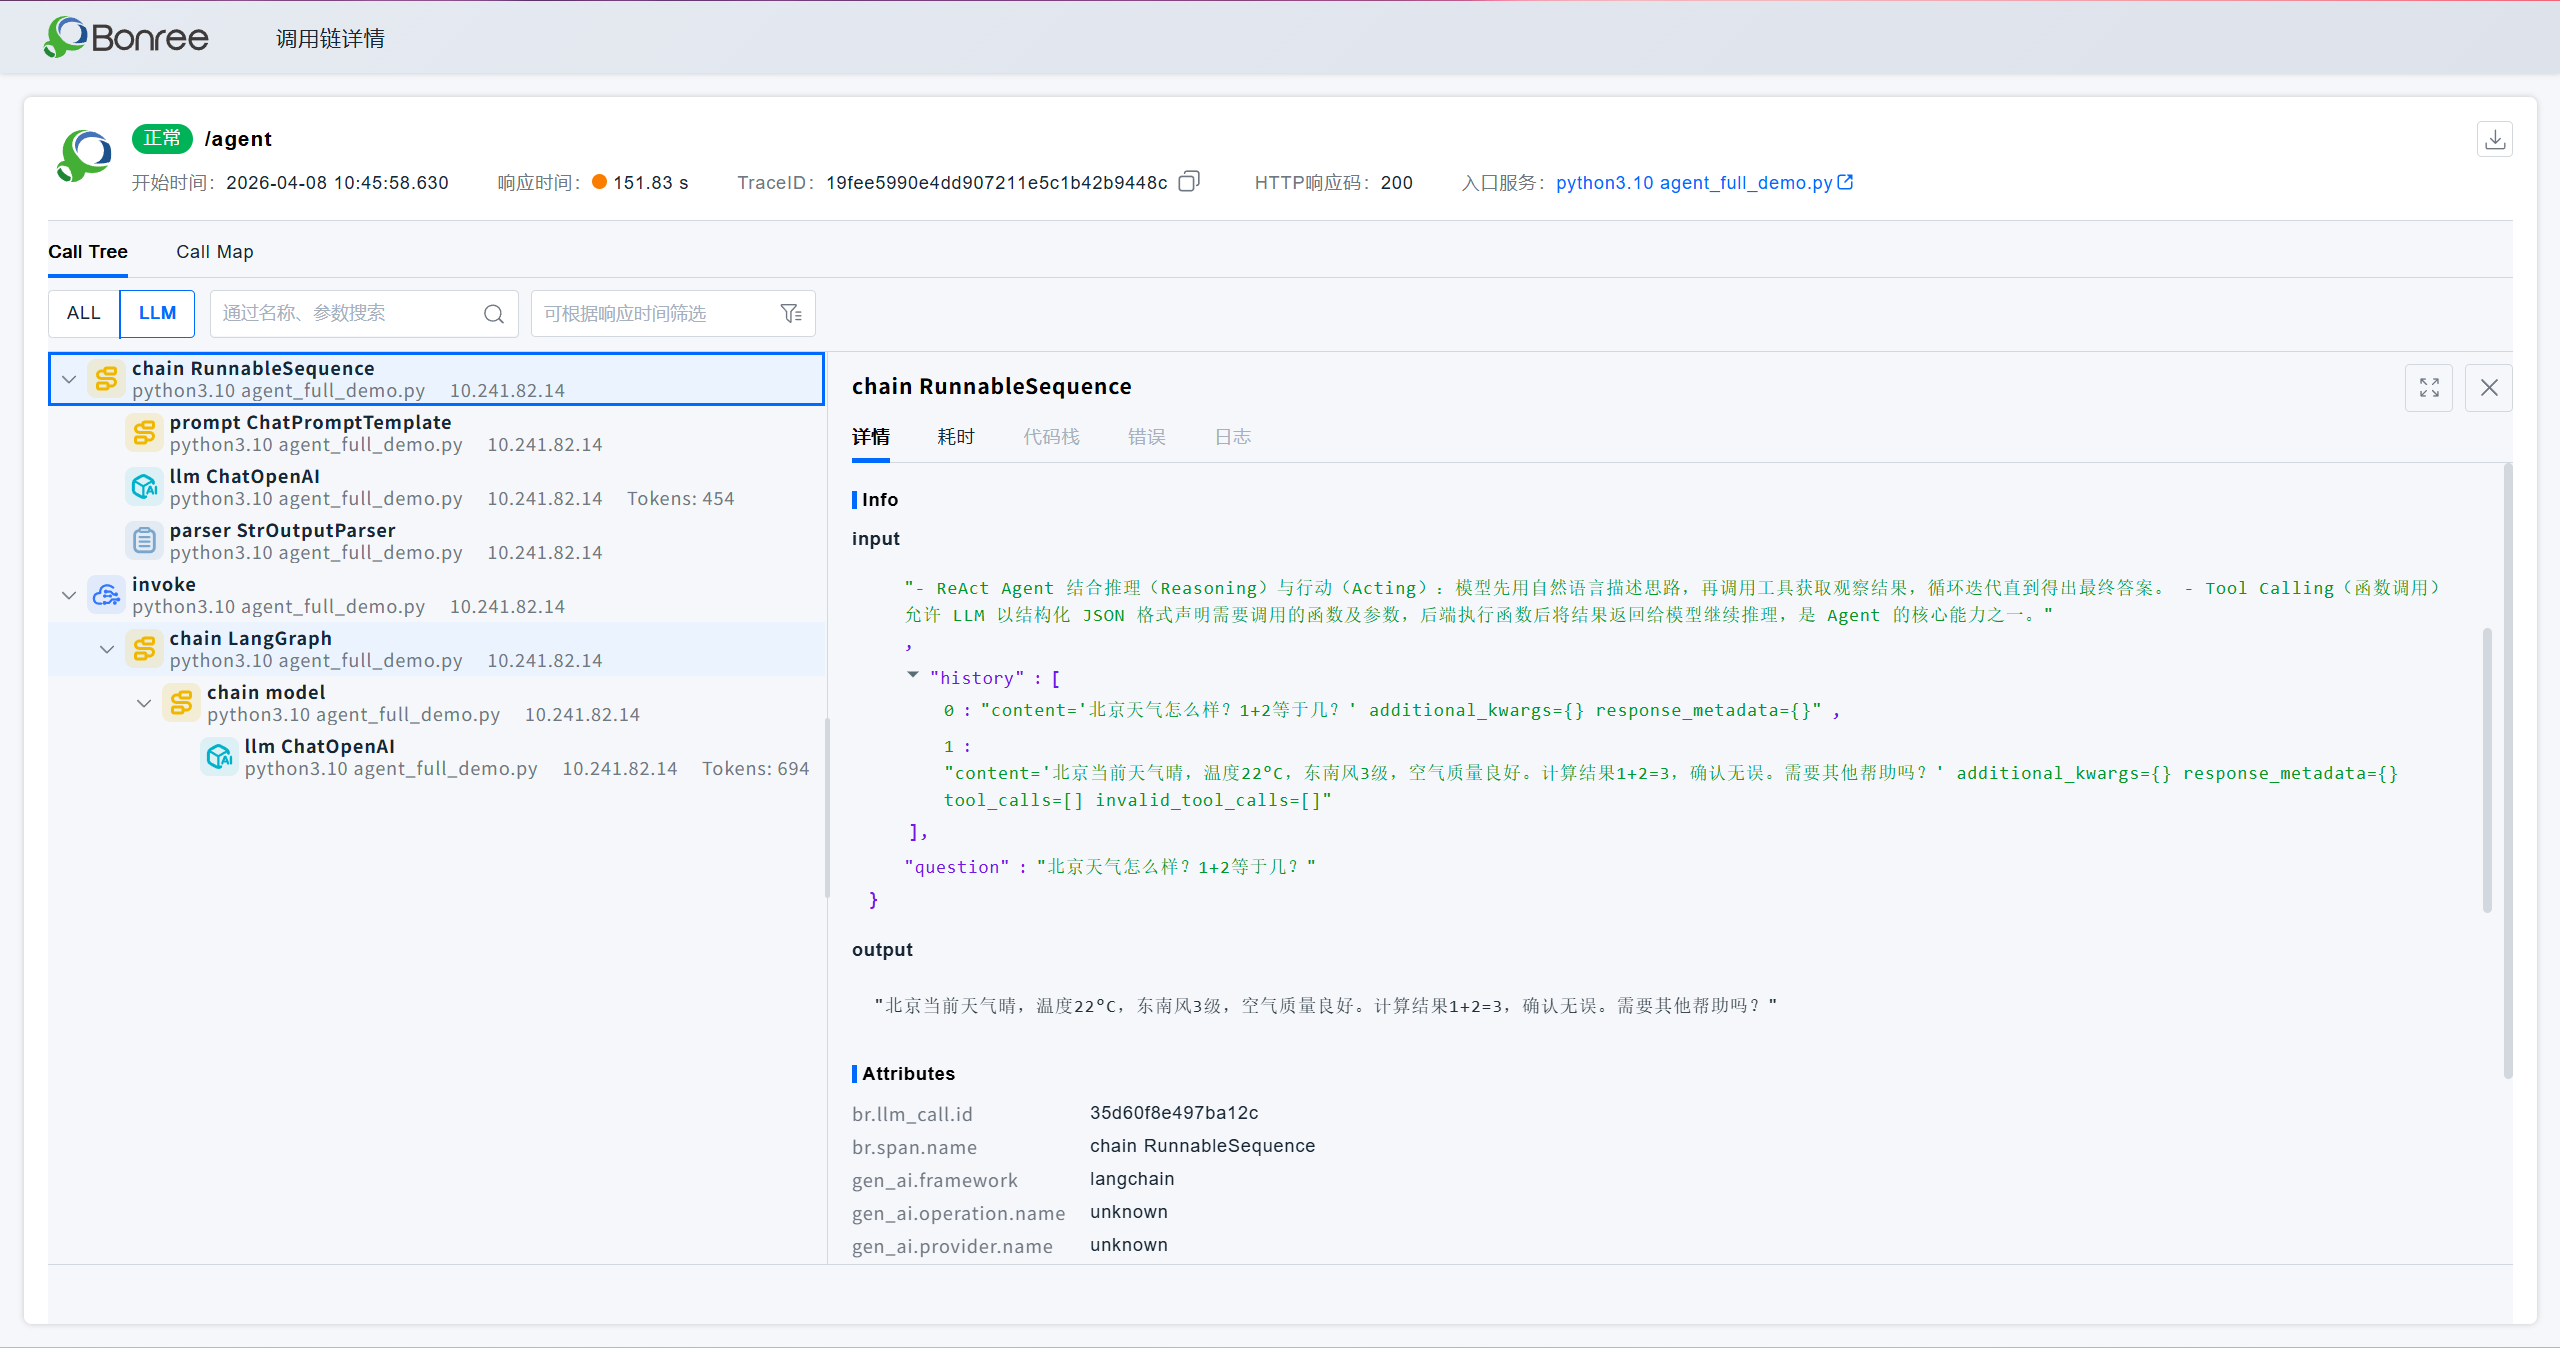
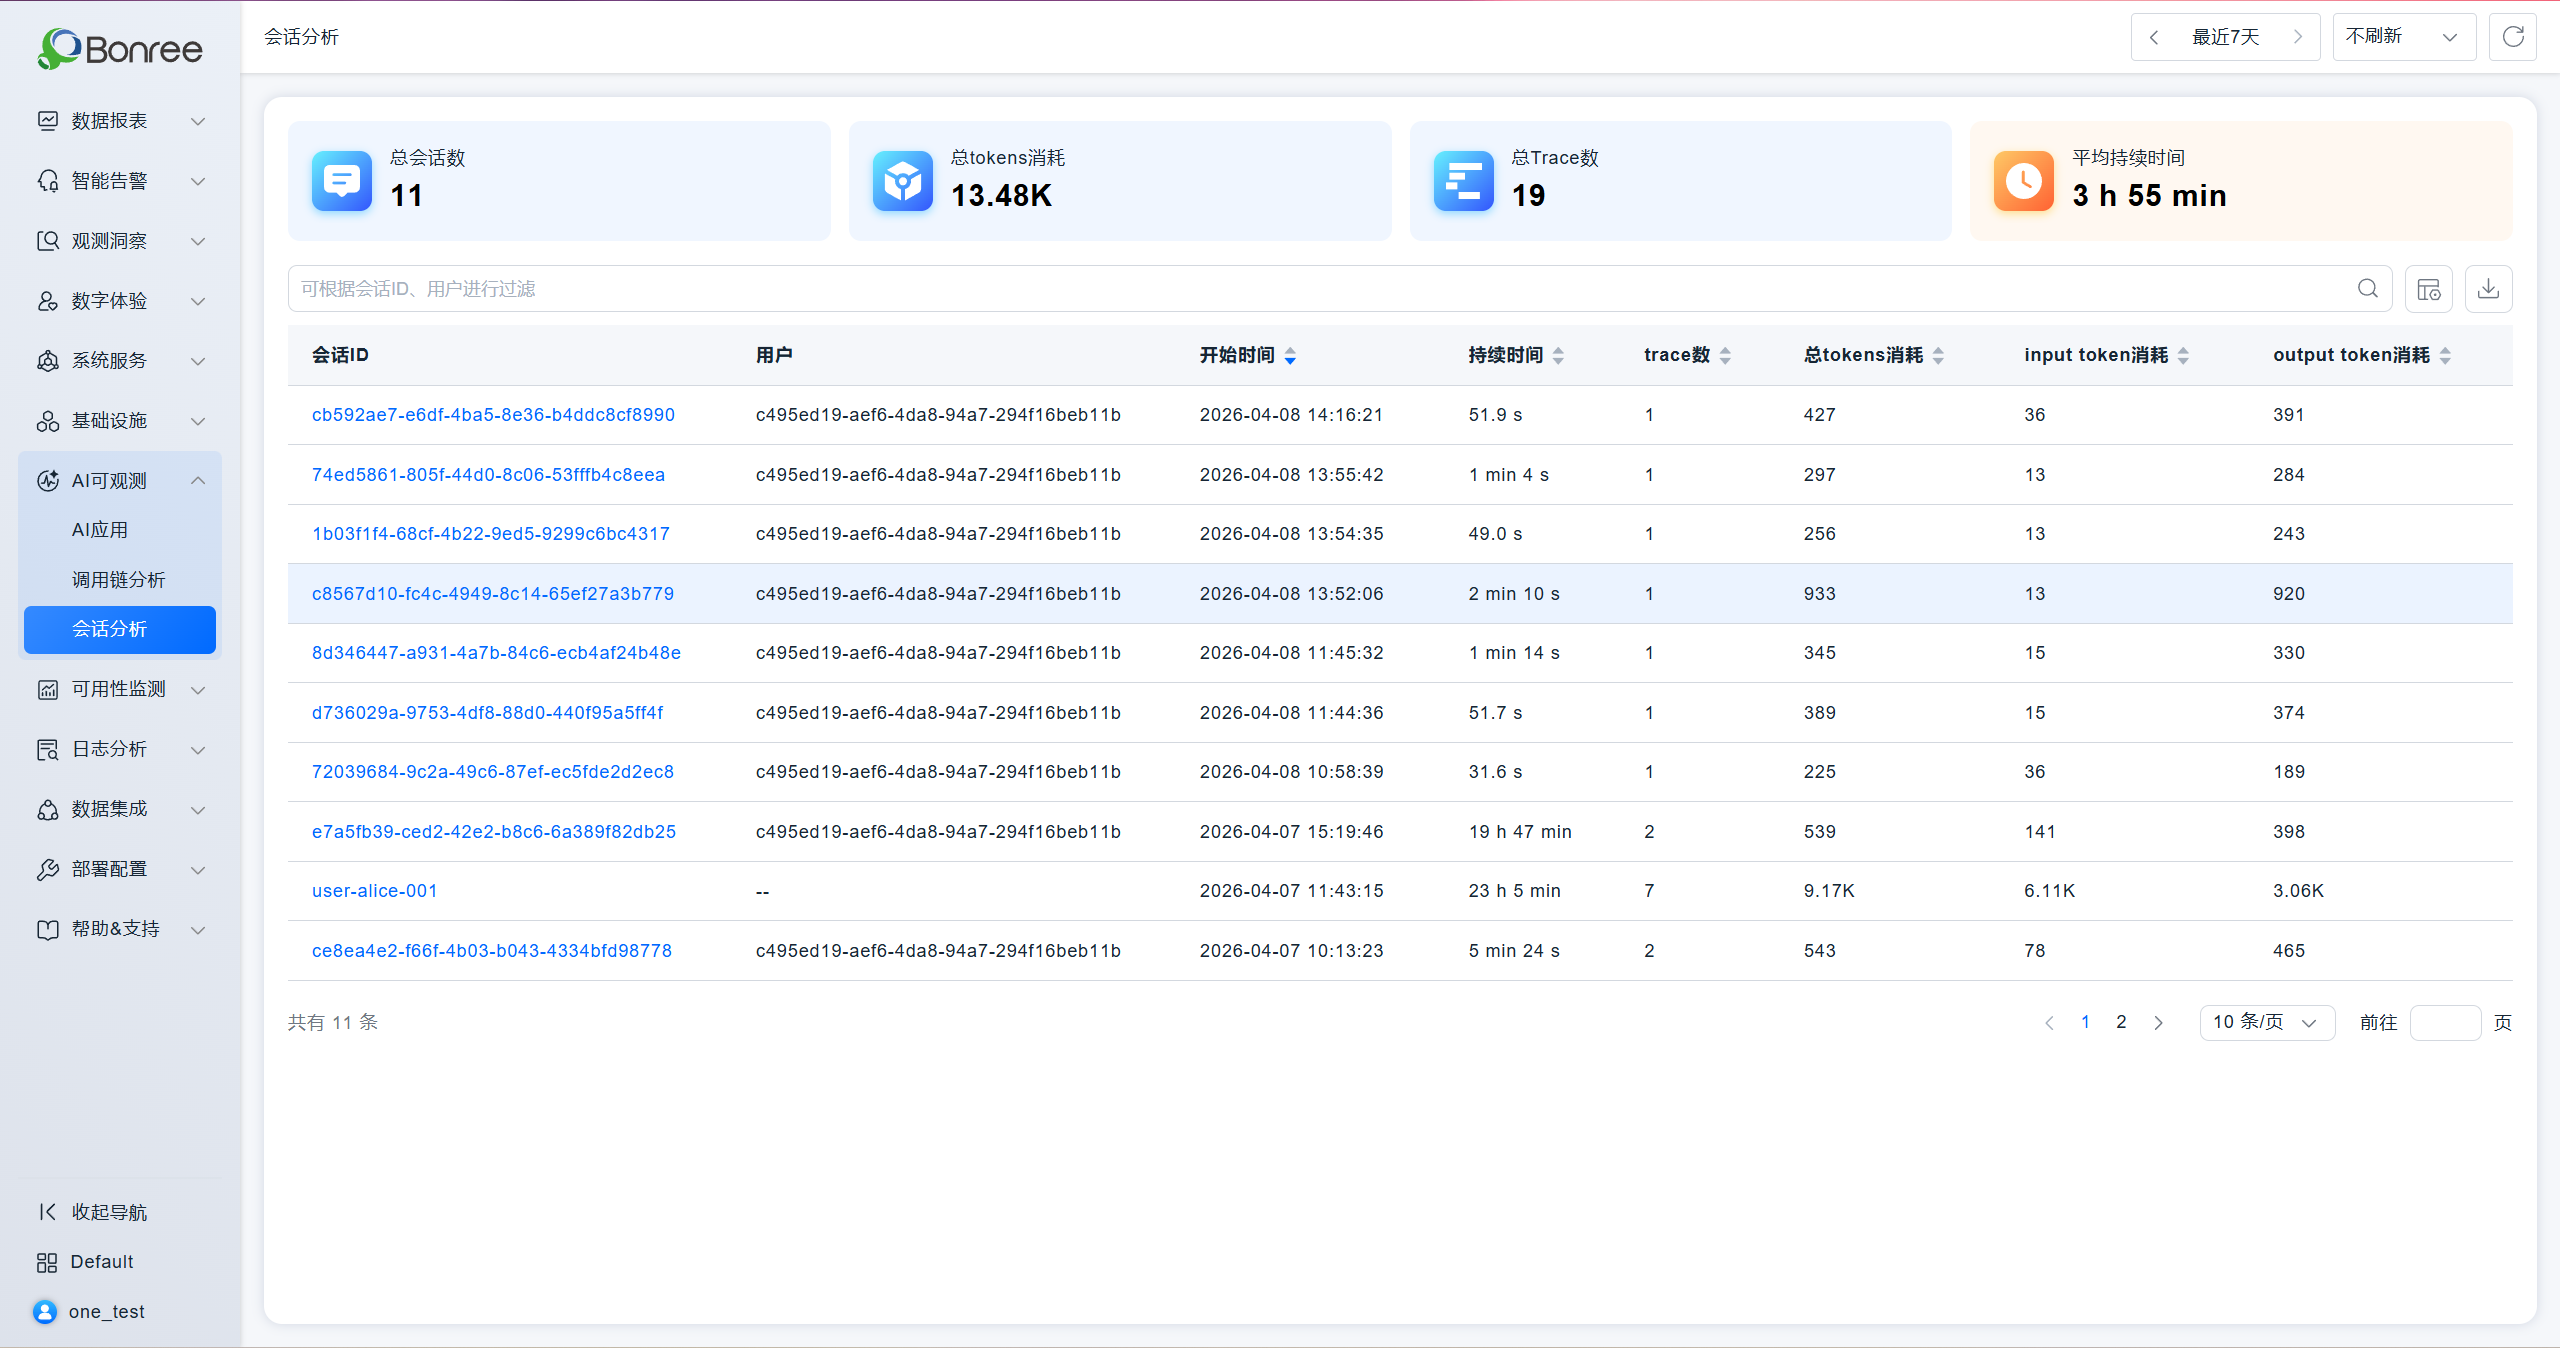
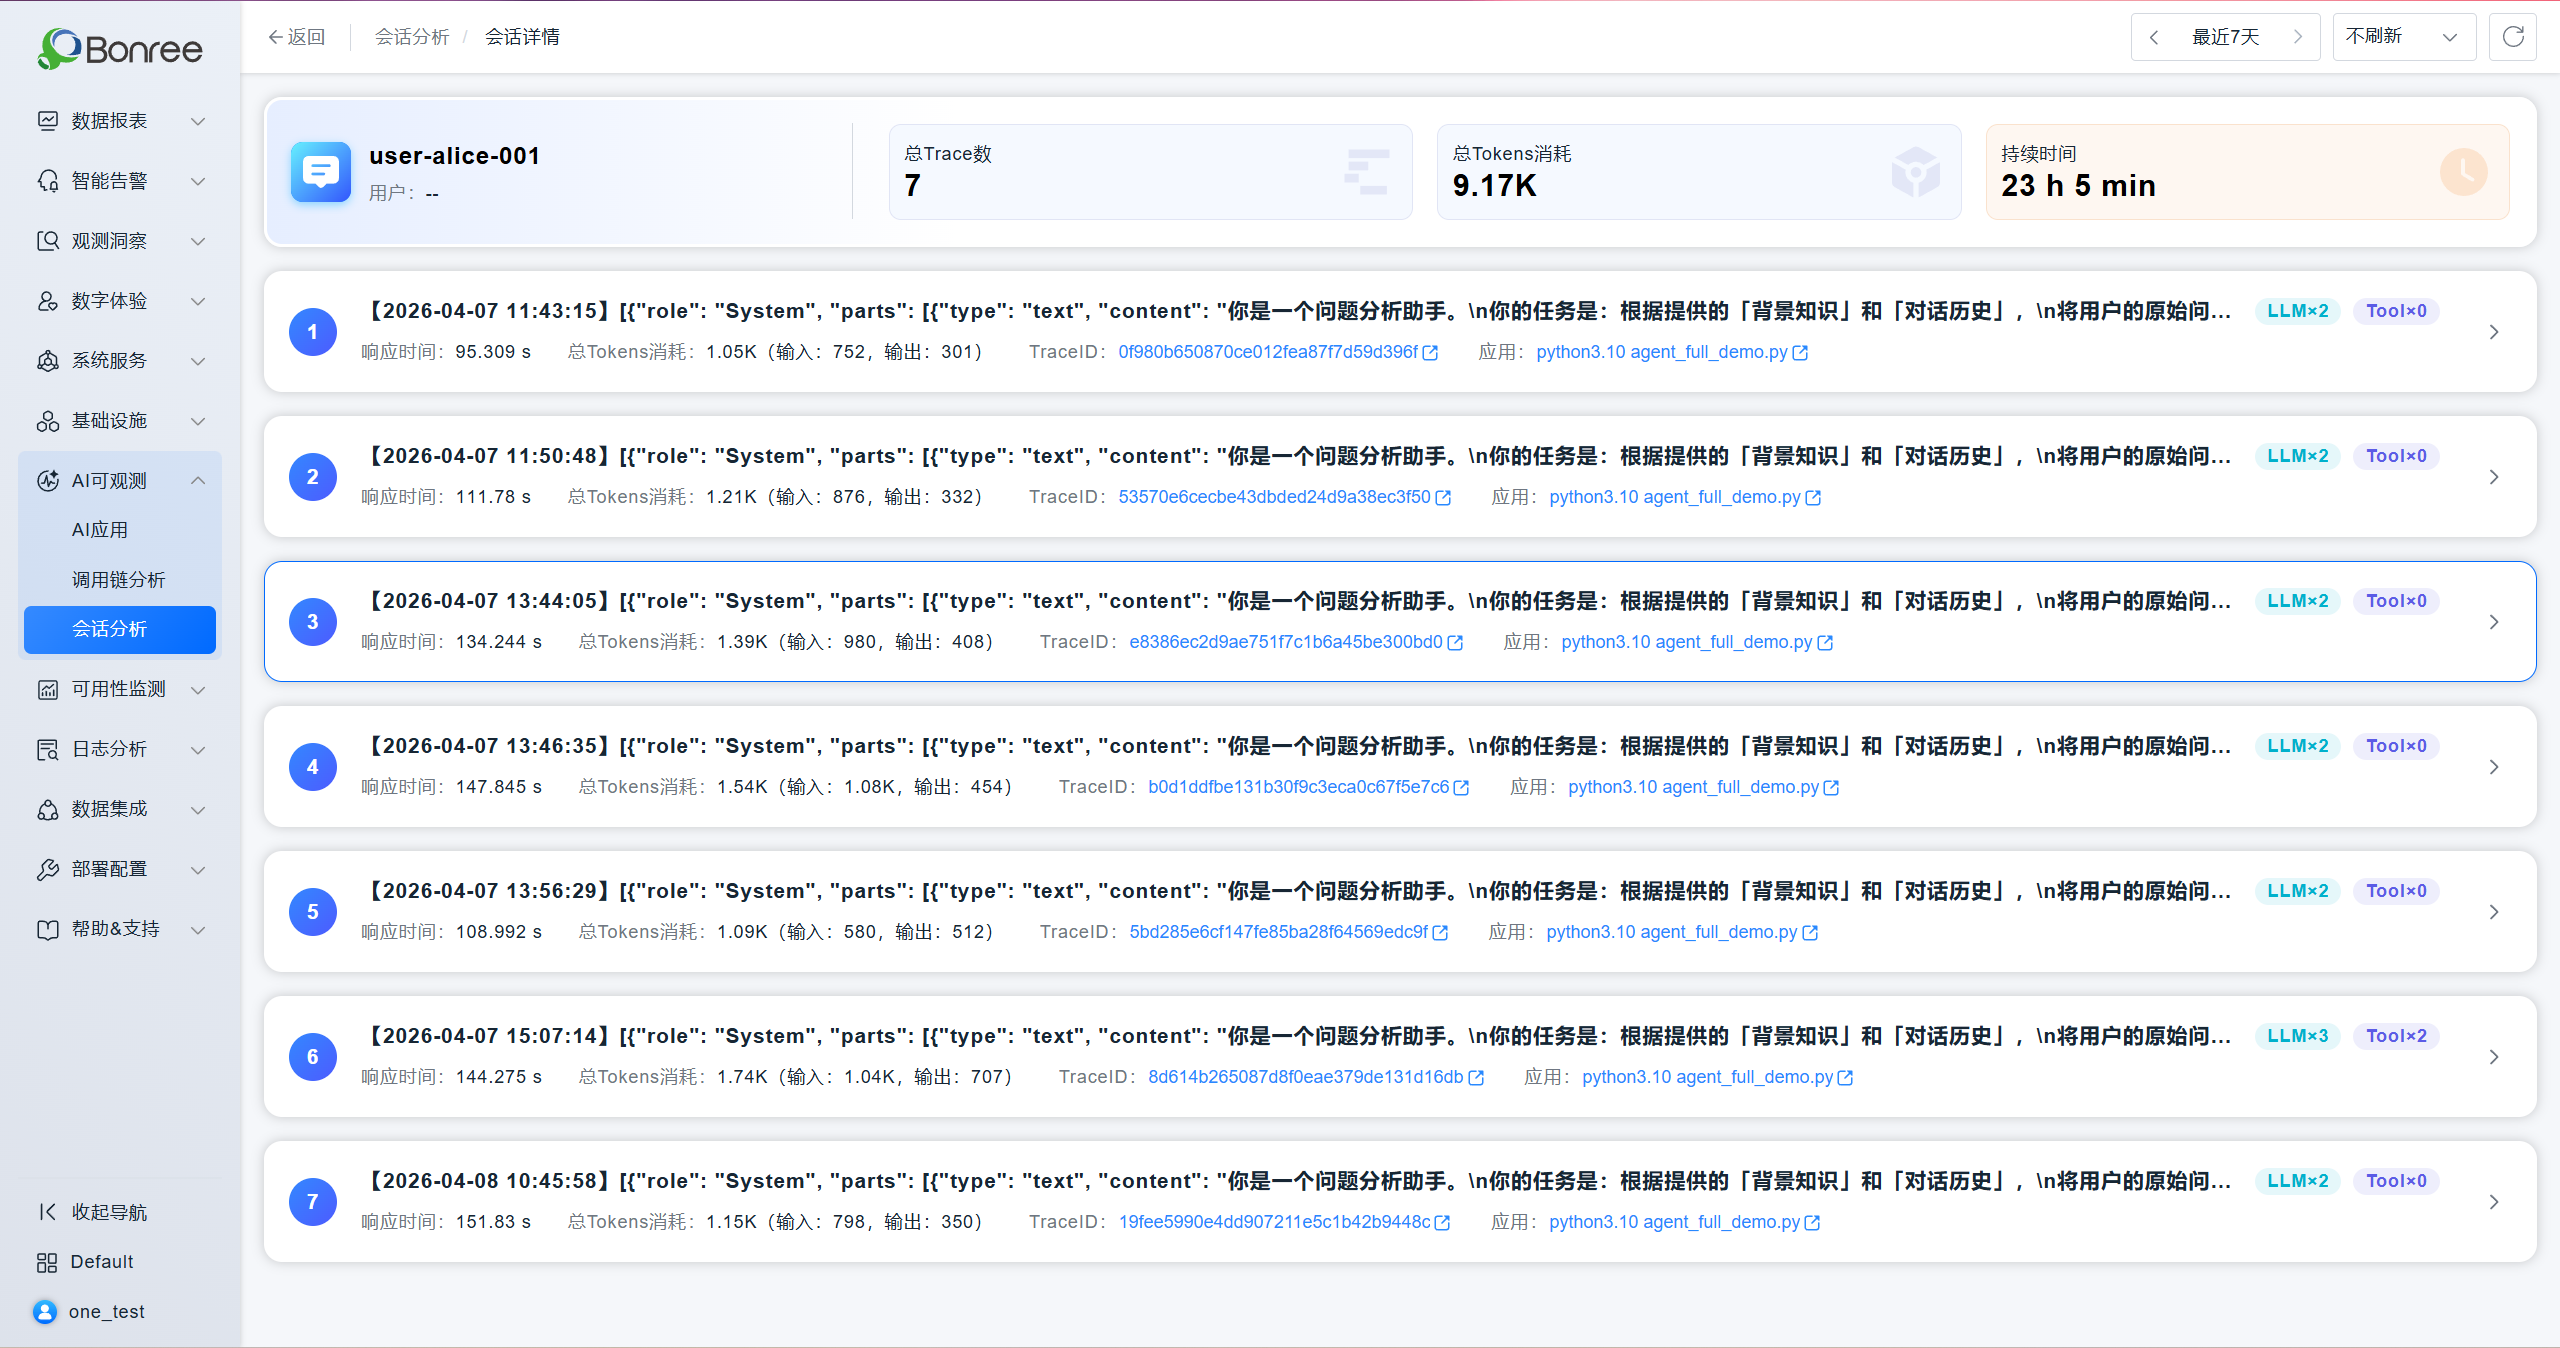
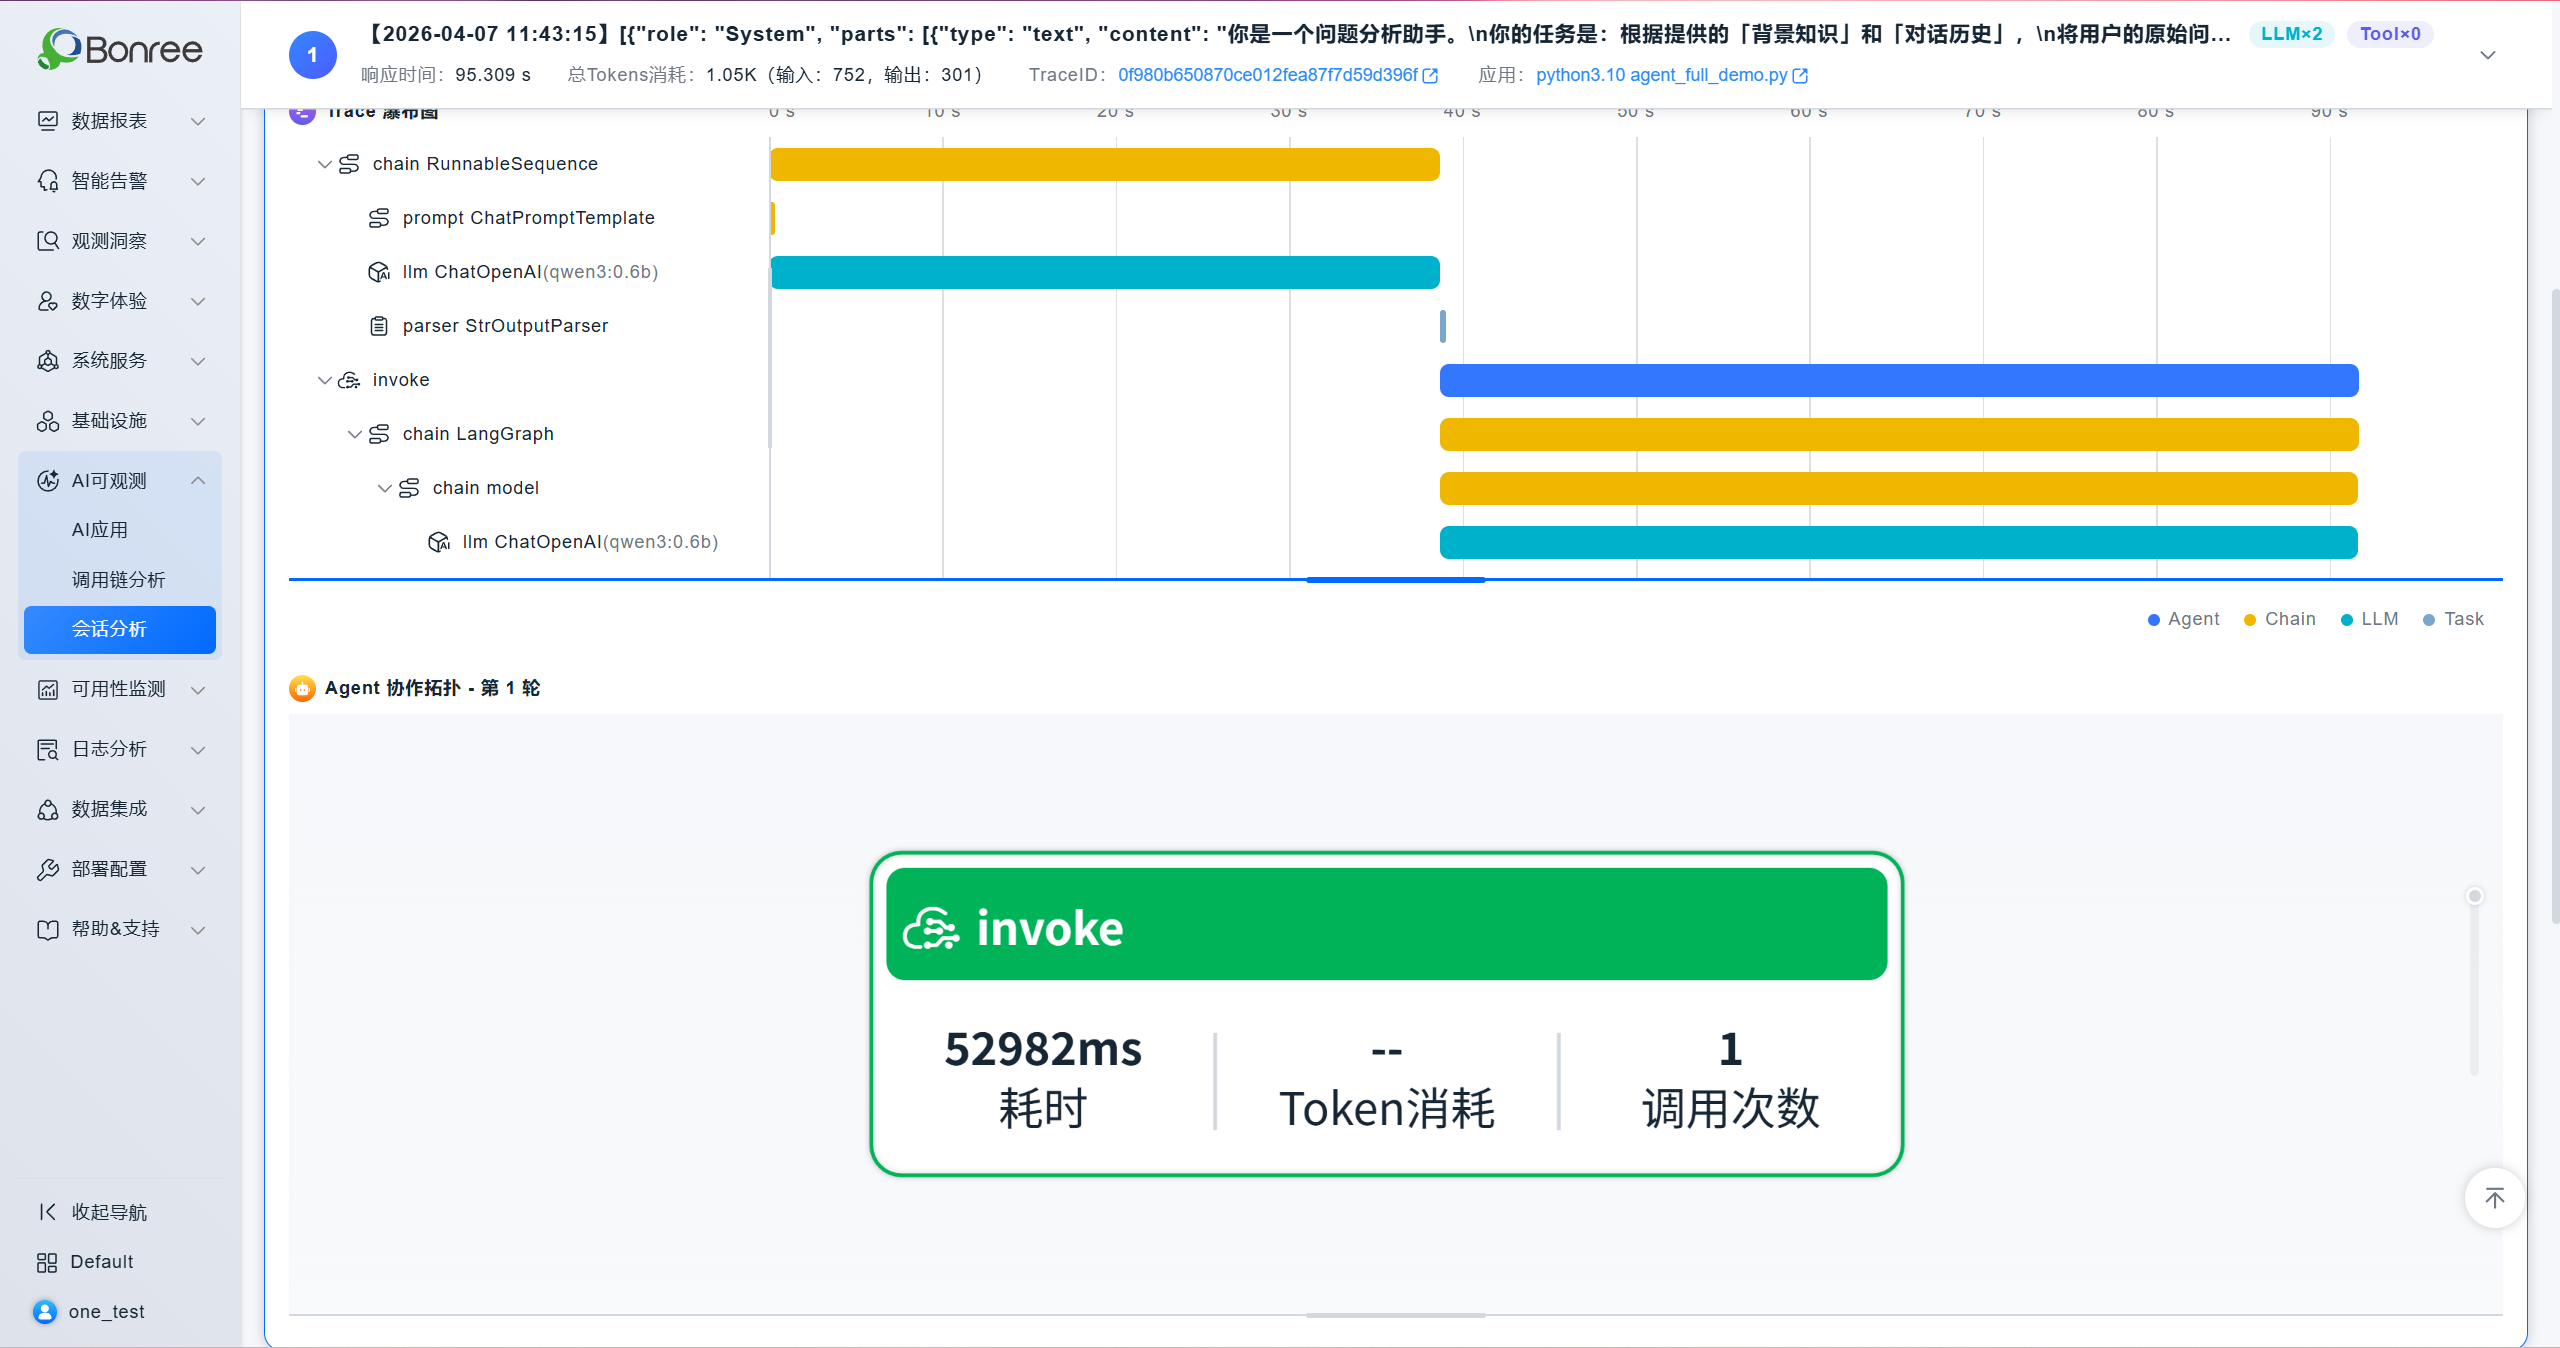
【AI Observability】
- Added the AI Observability module for monitoring AI Agent performance, providing multi-dimensional analysis across sessions, traces, metrics, models, token consumption, alerts, and more.
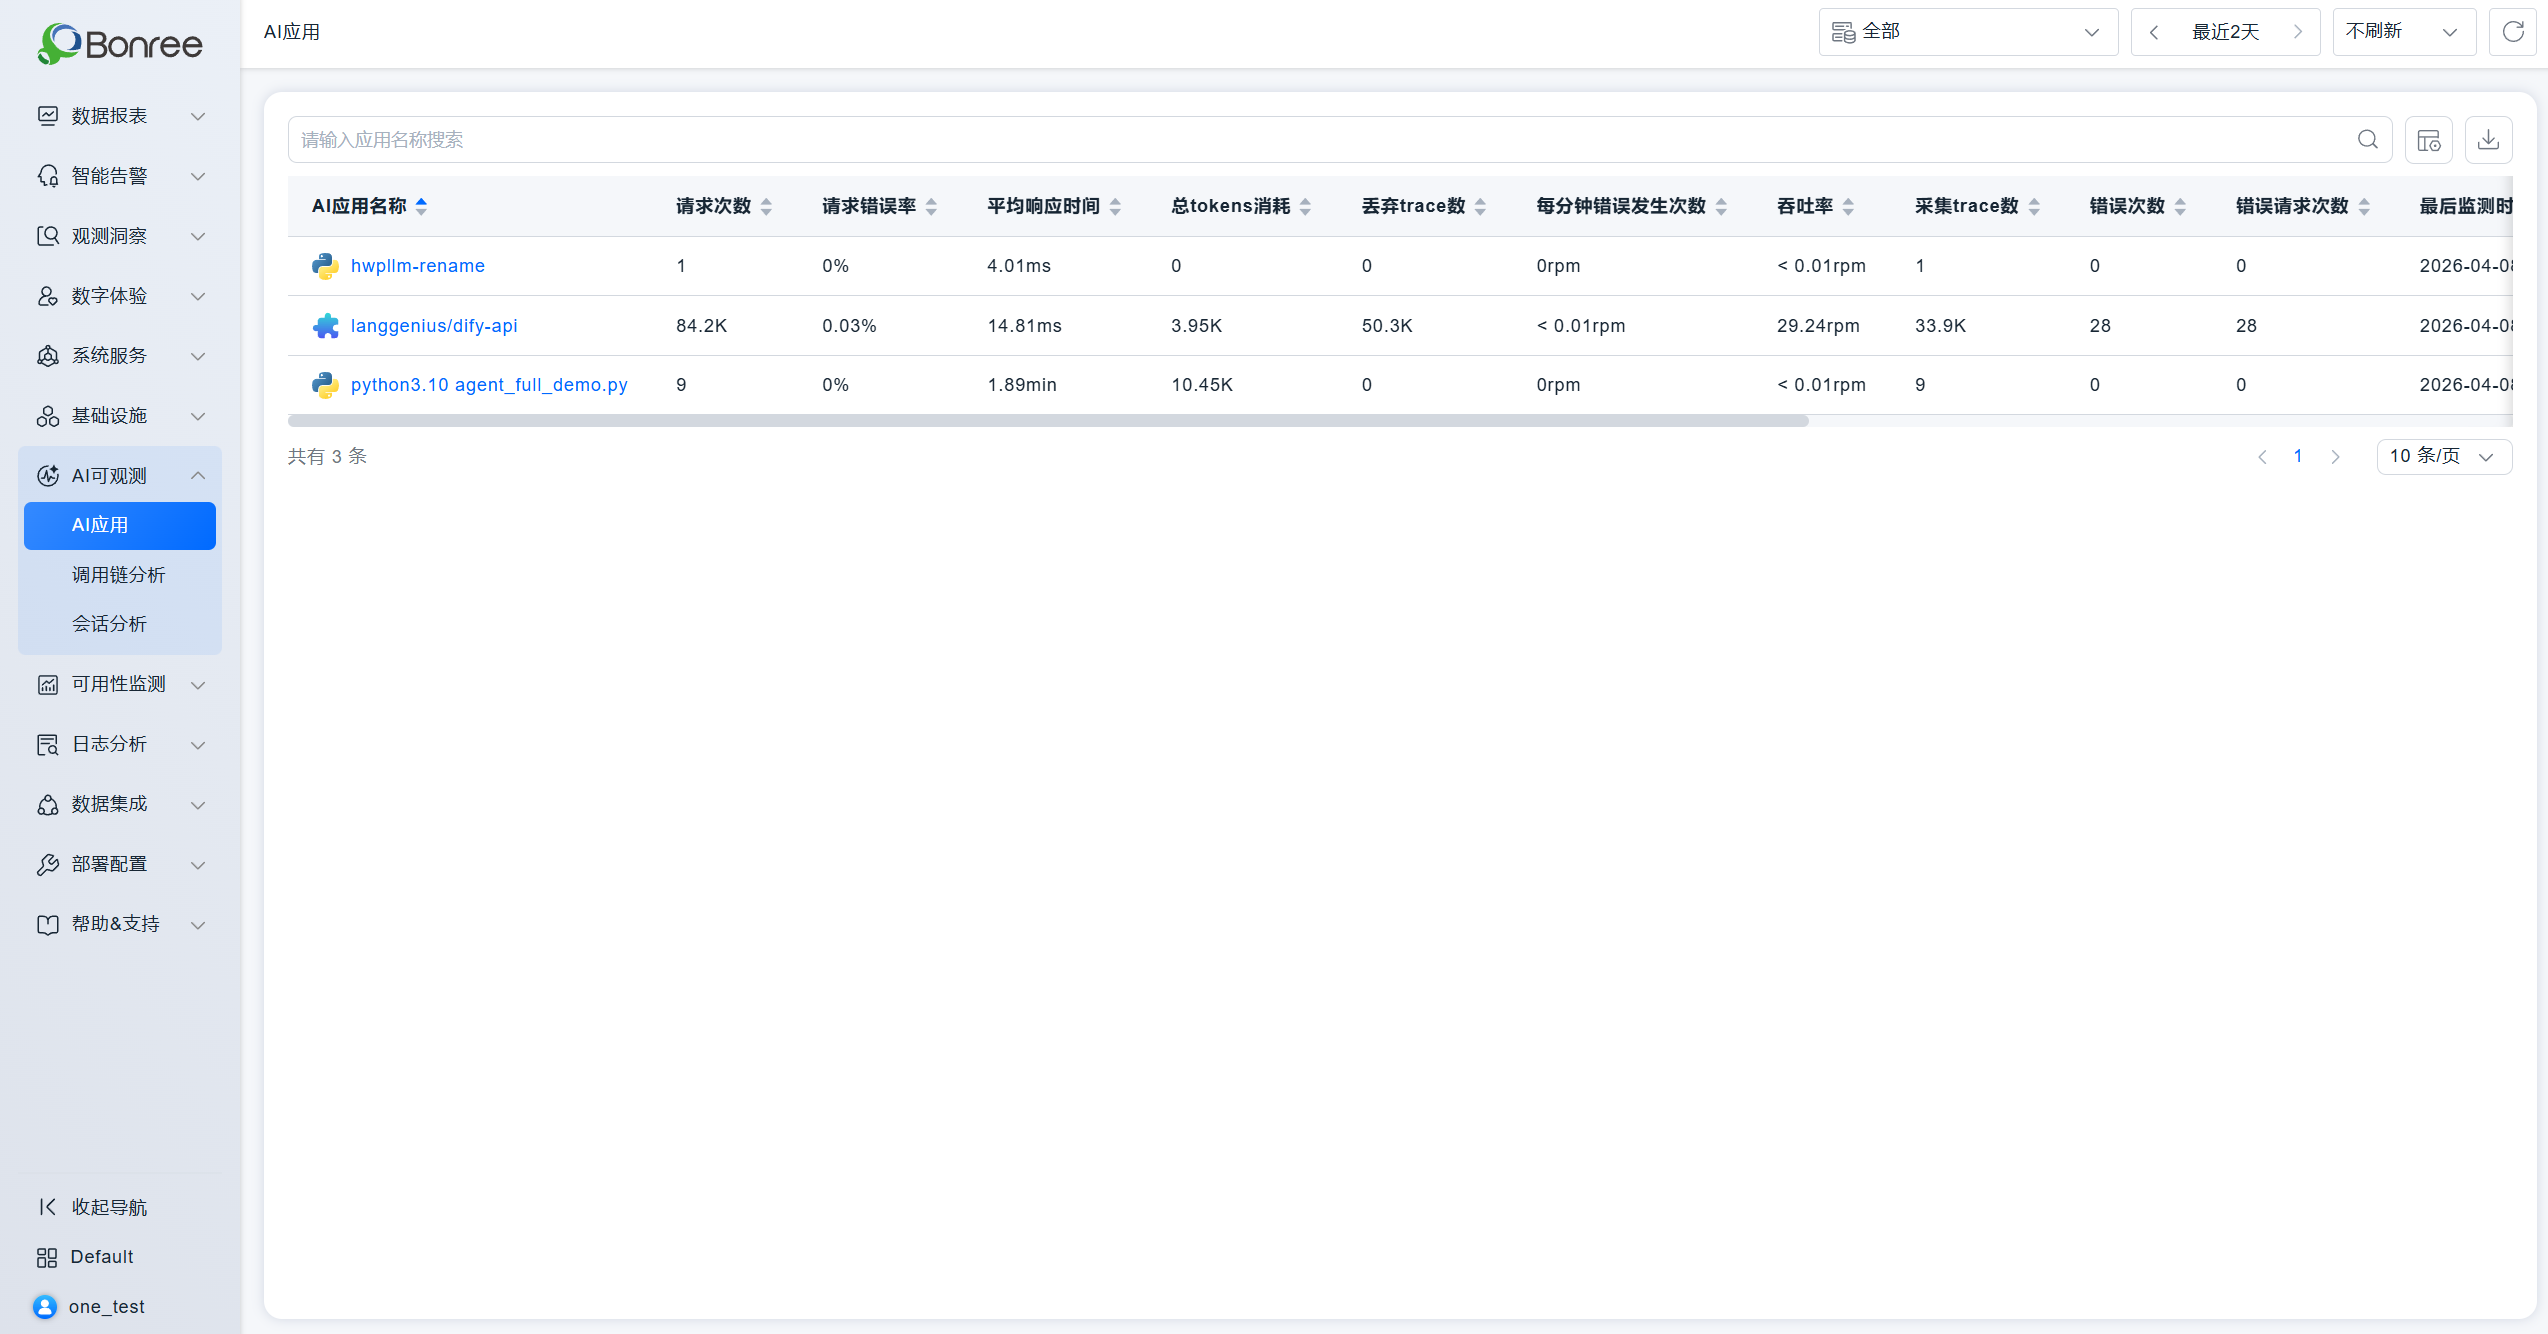
- Added the AI Application management module for multi-dimensional analysis of AI application performance.
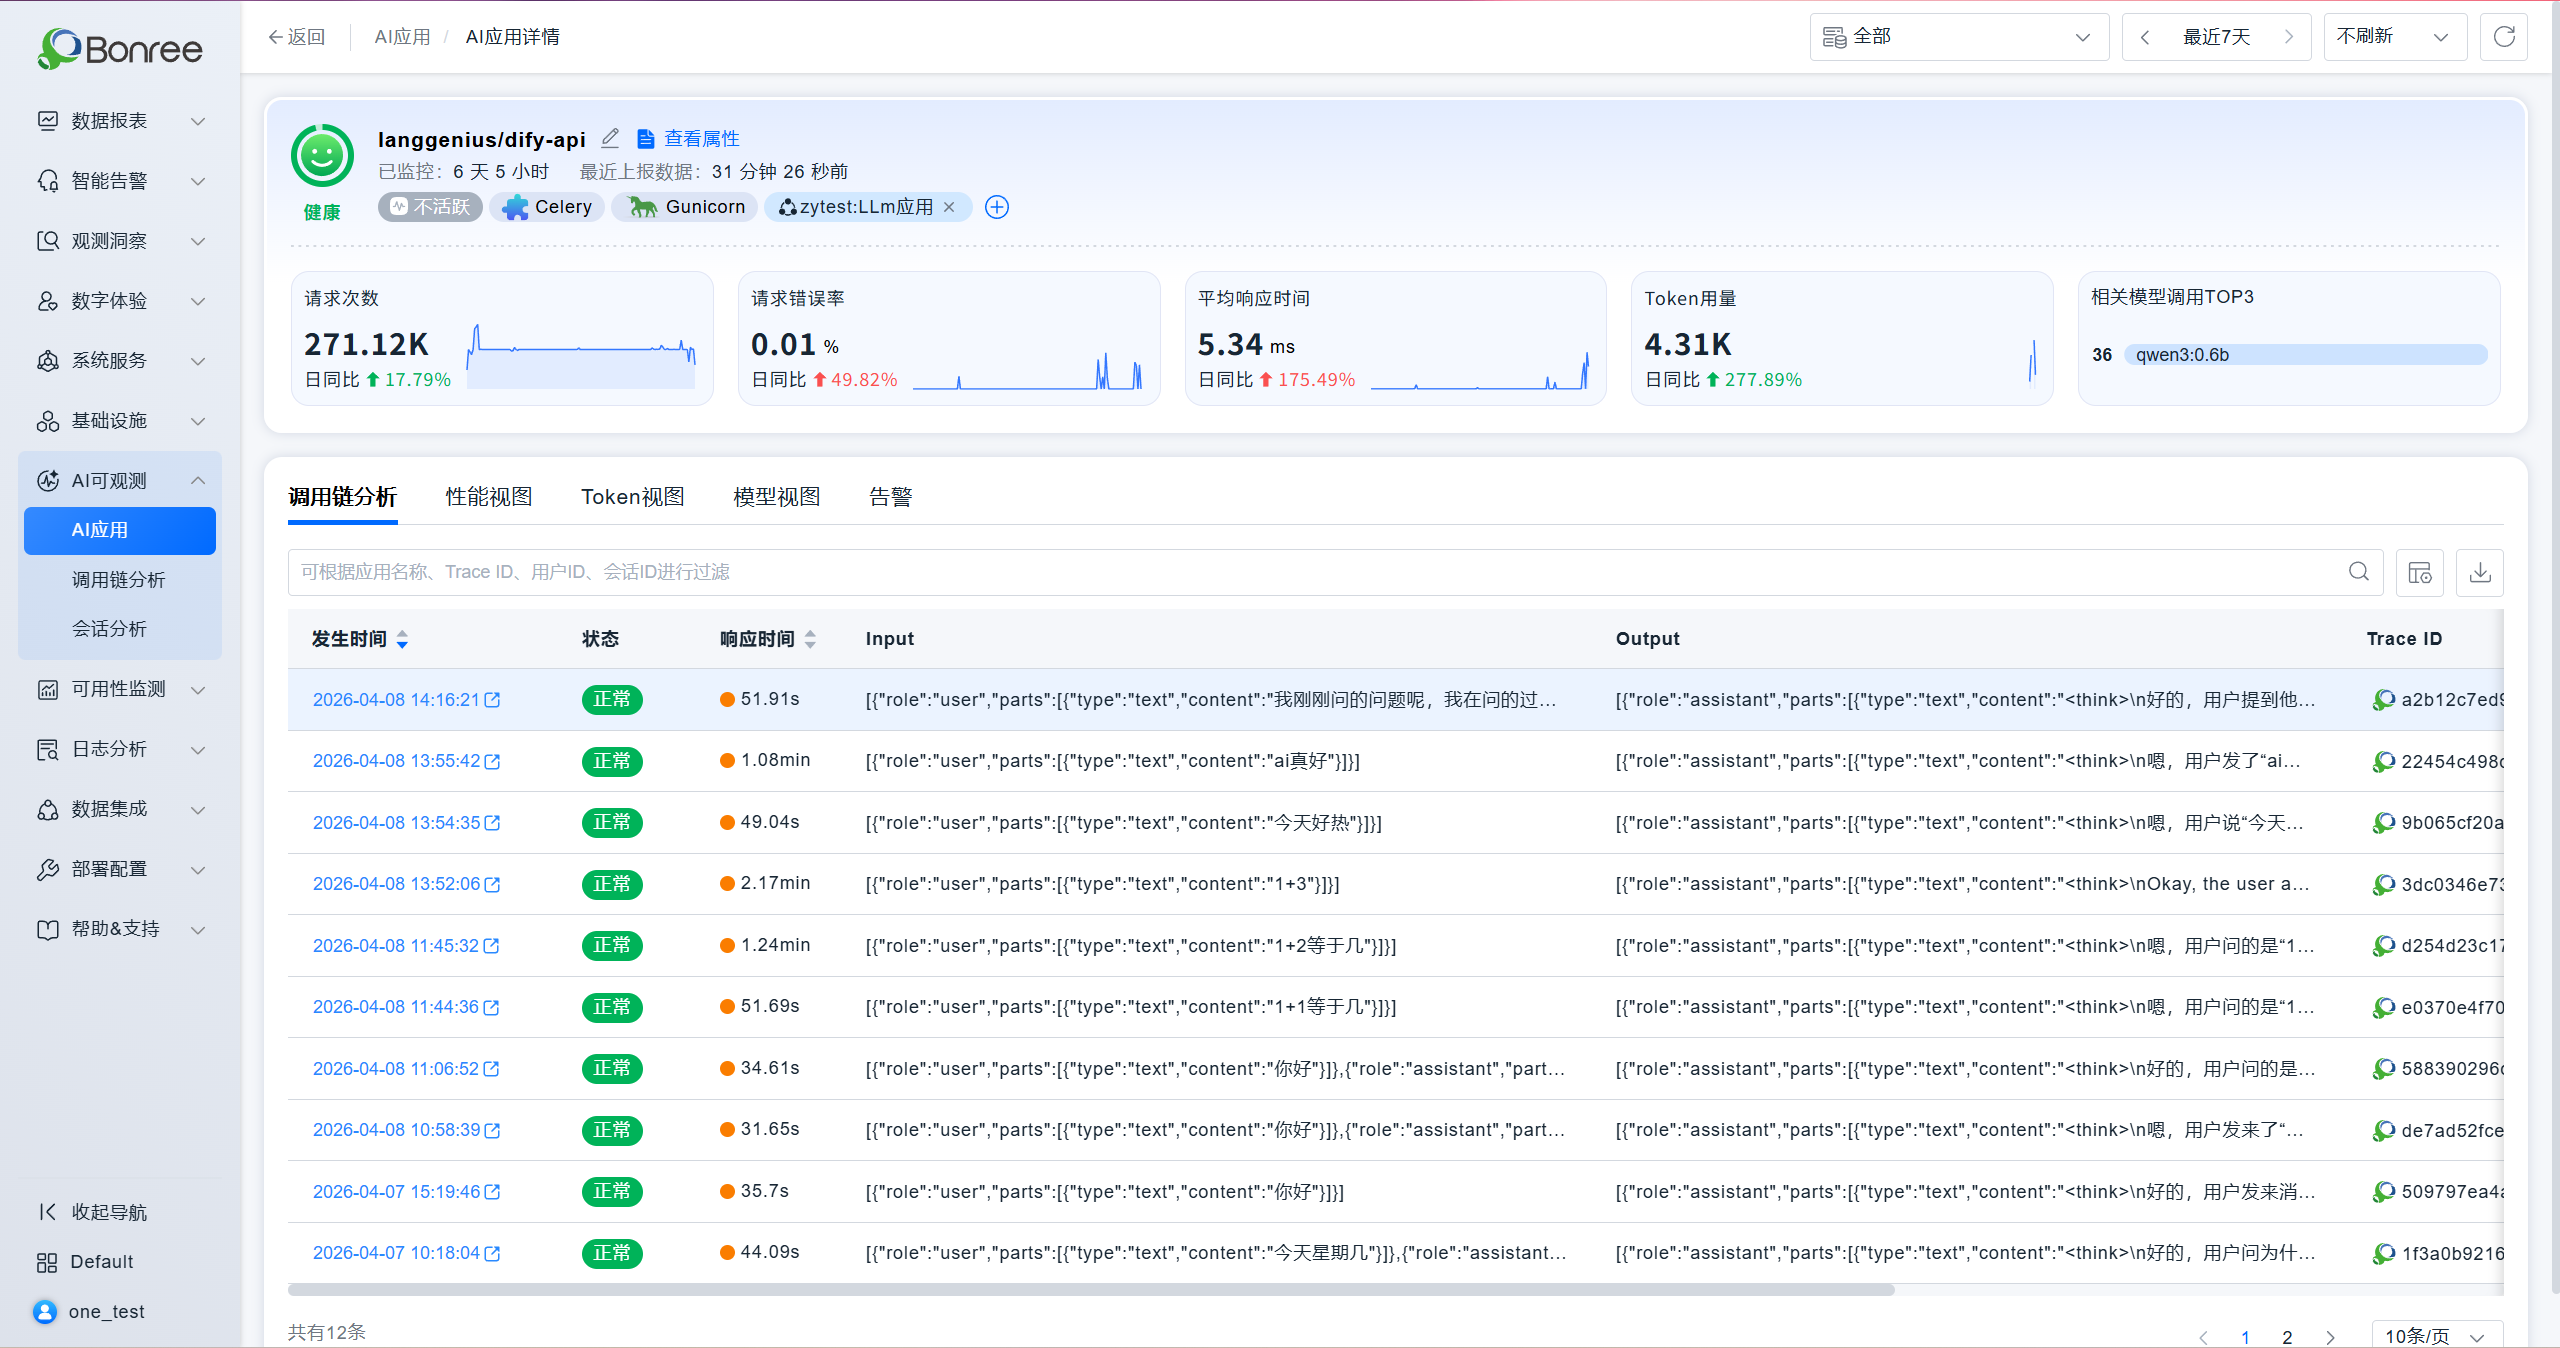
- Added the Trace Analysis module to help users analyze AI performance and token consumption within end-to-end business link scenarios.
- Added the Session Analysis module, providing detailed session analysis to support in-depth investigation of Agent collaboration workflows, model token consumption, latency, tool calls, and more.
【SmartAgent】
New Features
Runtime Data Isolation Mode (Linux / ARM)
- Added installation parameter
--enable-user-data-isolation(only supports Linux Root installation scenarios). - Application agent runtime data (logs / cache) supports user-isolated storage.
- Upgrade Note: When upgrading from an older version or non-isolation mode to isolation mode, processes with injected agents need to be restarted to ensure normal data collection.
LLM Large Model Monitoring (PythonAgent 8.7.0 / SDKAgent 5.15.0)
- PythonAgent now supports monitoring of mainstream large model frameworks:
- OpenAI 2.26.0, 2.31.0
- LangChain 1.2.10, 1.2.15
- Dify 1.4.3, 1.11.0, 1.11.2
- MCP 1.5.0, 1.27.0
- SDKAgent also supports LLM large model monitoring.
DotnetAgent 6.16.0 — TopShelf Support
-
Added TopShelf scenario support (module version: TopShelf 4.3.0).
-
Supported framework versions:
- Linux / ARM: .NET 5.0 / 6.0 / 7.0 / 8.0
- Windows: NetFramework 4.5.2 / 4.6 / 4.6.1 / 4.7 / 4.8 · .NET 5.0 / 6.0 / 7.0 / 8.0
Windows Platform Observability Enhancement (logsAgent 3.0.0)
-
Supports collecting Windows Event Logs.
-
Supports automatic log file encoding detection (UTF-8, GBK).
-
Integrated Windows version of logsAgent to complete the Windows platform observability chain.
Runtime Data Isolation Mode Support for All Agents
PHPAgent 8.6.0 · PythonAgent 8.7.0 · NginxAgent 3.9.0 · NodejsAgent 7.2.0 · SDKAgent 5.15.0 all now support runtime data isolation mode.
Enhancements
JavaAgent 9.13.0
- Optimized JFR temporary directory default to
java.io.tmpdirto avoid JFR runtime issues caused by directory deletion. - Optimized UEM HTML injection boundary scenarios (skip injection when scripts already exist, control injection based on response headers).
- Adjusted log file permissions to
640and directory permissions to750; log file naming suffix adjusted to_{pid}_{uid}.log. - Fixed known vulnerabilities in open-source component libraries.
- Optimized dubbo 2.7.0~3.3.6 async identification and latency statistics.
- Optimized jedis 4.x latency statistics.
- Optimized HBase collection count statistics.
DotnetAgent 6.16.0
- Adjusted log file permissions from
0666to0640, and directory permissions from0777to0750.
Nginx Agent Automatic Injection Version Blocking Adjustment
- Blocked versions > v1.29.3.
- Blocked versions >= v1.28.1 and < v1.29.0.
Image Update (v1.1.5)
- Prohibited specifying installation directory or runtime directory under
/tmp.
ARM Platform
- Temporarily blocked PythonAgent profiling capability on aarch64 platform (due to defects that may trigger uncaught exceptions causing application exit).
Bug Fixes
JavaAgent 9.13.0 (Linux / ARM / Windows)
| # | Issue Description | Impact Scope |
|---|---|---|
| 1 | Fixed downstream HTTP header invalidation caused by thrift header pollution | JavaAgent 8.0.0~9.12.4 (SmartAgent 6.0.0~9.12.6) |
| 2 | Fixed ejb.MessageDriven compatibility issue | JavaAgent 8.0.0~9.12.4 (SmartAgent 6.0.0~9.12.6) |
| 3 | Fixed compatibility issues with classes generated by Allatori obfuscator | JavaAgent 8.0.0~9.12.4 (SmartAgent 6.0.0~9.12.6) |
SmartAgent (Linux / ARM)
| # | Issue Description | Impact Scope |
|---|---|---|
| 4 | Fixed issue where non-root podman containers could not be injected / monitored | SmartAgent 7.5.0~9.12.* (only supported in non-isolation mode) |
| 5 | Fixed issue where probe could not correctly identify the reason for entering forbidden monitoring state when processes crashed frequently | — |
SmartAgent (Windows)
| # | Issue Description | Impact Scope |
|---|---|---|
| 6 | Fixed Windows Nodejs process group identification error | — |
【SmartGate】
New Features
- Gate Series Forwarding: Supports gate series forwarding of data, enhancing the flexibility of multi-node data links.
- Added Exporter Integration:
- Integrated DB2 (only supports x86_64 systems)
- Integrated MSSQL
Enhancements
- Monitoring Point Plugin (v1.5.0.0.04.07.01):
- Compatible with environment variable multi-key-value pair format scenarios to avoid interception exceptions.
- Added log printing for heartbeat and result reporting response parsing failures to facilitate problem troubleshooting.
ONE 3.11.0.0 Release Date: 2026/03/11
APM
New Features
- Remote interface page adjustment, support quick query of remote interfaces

- Core Link supports selection of third-party entities and technical component entities.

Enhancements
- Added name sorting function in the name column of the instance list
- When the system has no data, the card should display "No Data" instead of "Normal"
- When creating/editing a system, the shared tags dropdown list only shows shared tags under the current resource domain
- Adapt to CMDB instance ID adjustment
- Optimized exception entity statistics logic: cloned entities are no longer counted as multiple exception entities
- Expanded the selection range of starting nodes in vertical architecture to include third-party entities and technical components
- Optimized vertical architecture aggregation logic
Bug Fixes
- 103-4095 [Sinochem Information] OpenAPI: Unauthorized query of interface data under application performance tags
- 103-3675 [China Mobile Internet] After agent deployment, the displayed enable status is false (actual is true)
- [ENN Gas] Implement new pod memory usage and CPU usage metrics for newly registered pods
- System Details - Relationships - Service Metrics Display (Request Error Rate, Response Time, Throughput): Optimize the issue of missing services when there are duplicate service aliases
RUM
New Features
- Android, iOS, Web: SDK supports automatic code embedding wizard

- JS Errors, H5 Page Load: Support extraction of business module dimensions

- Added OpenAPI for network requests and page load records

Enhancements
- Interface performance optimization
- Entity Identification/Business Modules, Network Requests: Maximum creation count changed to nacos configuration, effective for all environments of all master accounts.
- Entity Identification/Business Modules: Default 10, Entity Identification/Network Requests: Default 50, when nacos configuration exceeds 100, still limited to 100. When nacos configuration is below 10, still limited to 10.
- Adapt to CMDB instance ID adjustment
- Health score calculation formula supports input of 6 decimal places

- Added alert level description in the hover information of alert icons in the terminal application and page analysis lists
- Added packaging instruction jump link for symbol files

- Entity Identification/Network Request/Domain Type added prompt: The platform will not display H5 page loads under CDN domains

- Data Collection/Terminal Applications/Collection Limits: Filter out Web from the application dropdown
- Changed "Admin resources" text to "Default resources"
- Fixed issue: When deleting a SourceMap file, other files with the same name were also deleted
ALERT
New Features
- Alert script added shell JQ toolkit
Enhancements
- Fixed abnormal issue with alert rule filtering conditions (attributes & tags)
- Fixed abnormal issue with is_no_data field in no-data state
- Fixed abnormal issue with alert notifications after manually closing alerts
- Fixed issue where no new alert was generated after an event alert was closed
- Adapted to synchronize metric name display in alerts after metric unit modification in the metrics system
Bug Fixes
- 103-3924 [ICBC] Abnormal region filtering condition in alert rules
- 103-4064 [Sheng Yin Consumer Finance] -- The host address in alert notification content displayed the host instance ID
- 103-4067 [Sheng Yin Consumer Finance] -- No notification when manually closing alerts in the alert list
- 103-4010 [CSC Operations] Alert rule - No-data异常 alert for metrics not生效
- 103-4091 [CNBM] After closing third-party接入 alerts, triggering the same alert again did not generate a new alert.
- 130-249 [alert][historical bug] Alert rule - When selecting "contains any" in tag filtering and entering specific tags, the tag data could not be selected
- 103-4294 [ENN Group] After configuring filtering conditions for event alerts, the conditions were not saved
- 103-4282 [Onewo] Alert list displays 100 rows of data without showing
ANALYSIS
New Features
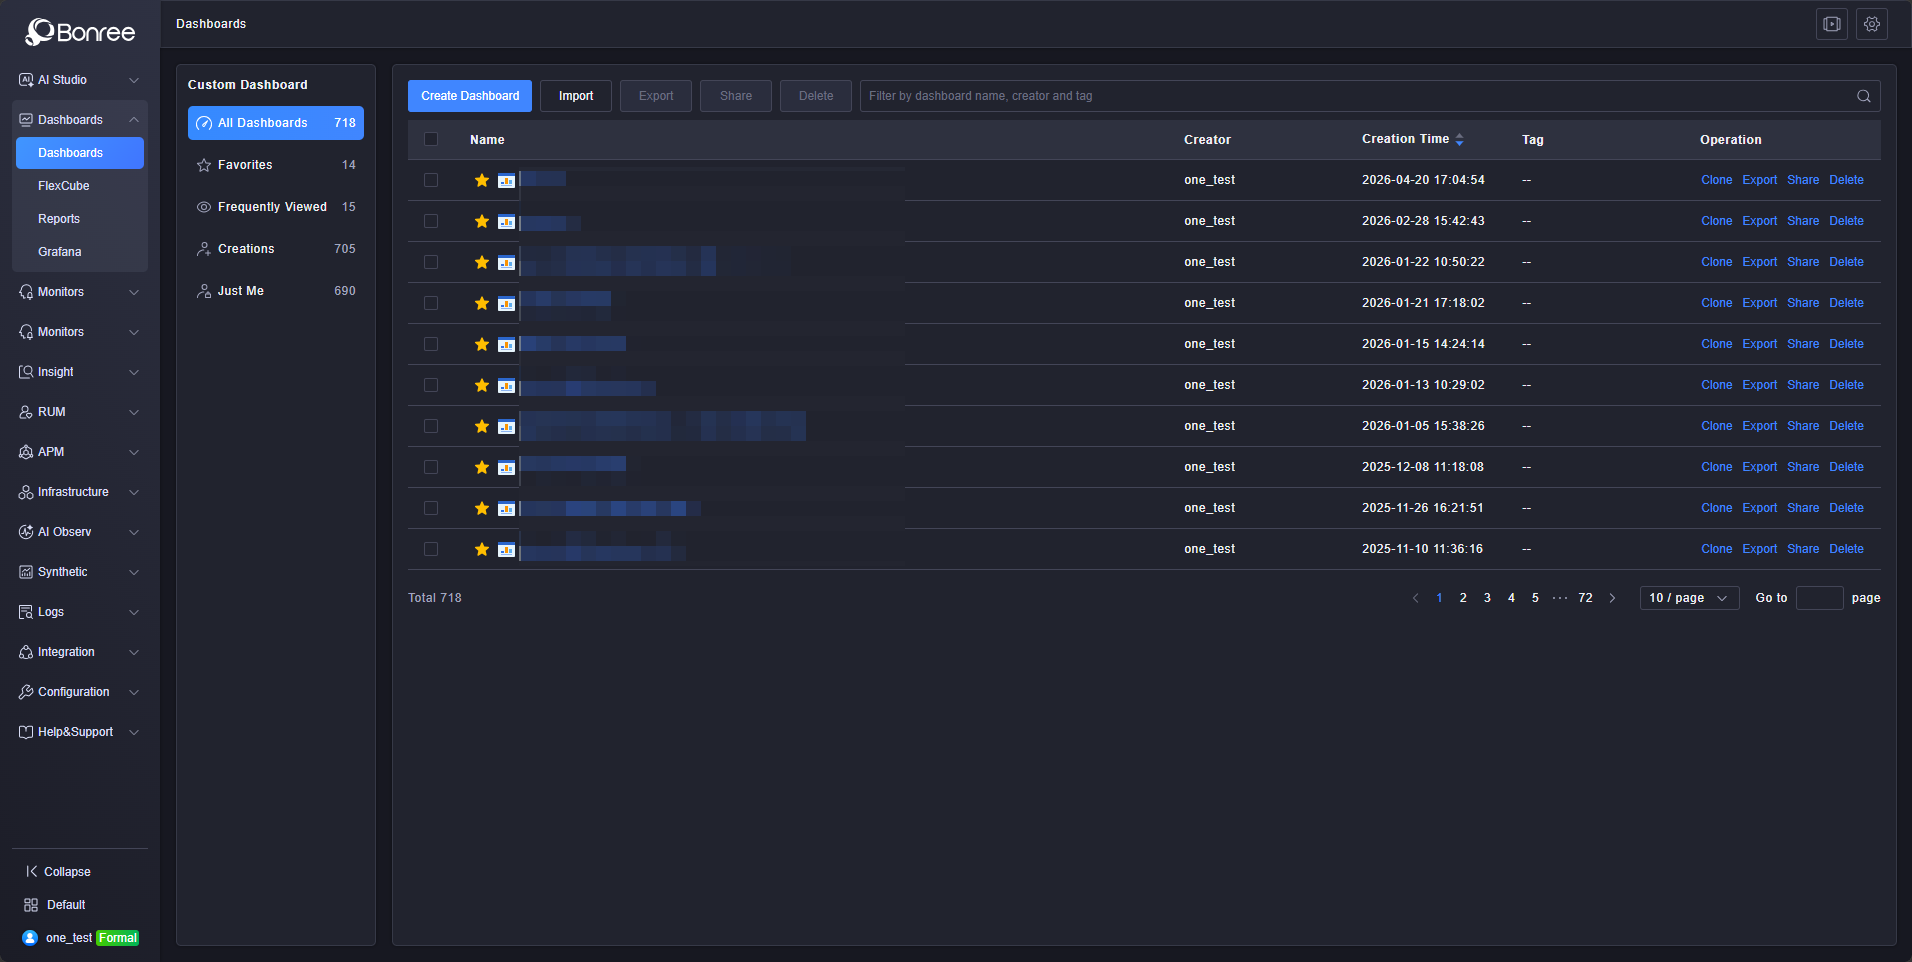
- Dashboard supports carousel playback, allowing custom addition of dashboards and automatic playback at specified frequencies

Enhancements
- Workspace application score adapts to mpass type icons
- datetime type fields participating in filtering grouping can be filtered via time components; date type fields are displayed in date format; all number type fields can have units added through custom display items
- Adapt to cmdb modifying metric types and deleting custom metrics: after modifying metric types, the dashboard will verify if historical configurations can be queried normally; when deleting custom metrics, the dashboard will verify and prompt
- Breadcrumb not displayed when Cube menu is set to other pages
- When configuring card filtering conditions in the dashboard, some field types support "is empty" and "is not empty" operators
- Metric selector supports displaying extended attributes of metrics
Bug Fixes
- 103-4266 [J&T Express] Abnormal sorting logic for heatmap in Dashboard & Cube
- 103-4344 [Hytera] -- Dashboard loading error
- 53-1555 Early warning events - Public cloud infrastructure technical component access status异常 and显示 no data
LOG
Enhancements
- Log query list supports displaying full log text without truncation
- Adapt to CMDB instance ID adaptation
- Blacklist process name changed to exe name
- Custom source path process group retrieval adds container stdout process group
- Log query supports regex search box
ETL
New Features
- Flink resource isolation
- RUM JS Errors, H5 Page Load: Support extraction of custom dimensions, assign identifiers by vendor
- Added task switch button in the ETL background management interface
- Page interaction adjustments, removal of sensitive information containing the word "Bonree"
- When sub-accounts are frozen or deleted, the tasks they created can still be viewed and managed on the platform
Enhancements
- Map type data parsed in pipelines is now stored in JSON format
- Fixed OOM issues caused by excessive data volume when fetching data via JDBC database connections, which could lead to page cards or services crashing. The limit for a single data fetch is now 10,000 records.
CMDB
Enhancements
- Custom metric meta-attributes now support editing, allowing modification of parameters such as metric type, unit, and maximum/minimum values.
- Custom metrics now support deletion. When異常 data exists, redundant data can be manually deleted without the need for scripts to clean the database.
STM
Enhancements
- If all monitoring points of a task are offline, "Execute Now" is grayed out, with hover提示 "All monitoring points bound to this task are offline, operation not possible"
- Adapt to CMDB instance ID adjustment
- English text corrections
IAM
Enhancements
- When IAM users authorize others, they can control whether to authorize only the environment resource domains they have权限 to or all environment resource domains

- Hide the left navigation in the canvas area when embedding Cube
- License for function verification of ONE modules applied via https://lic.bonree.com/trial, validity period adjusted to 7 days
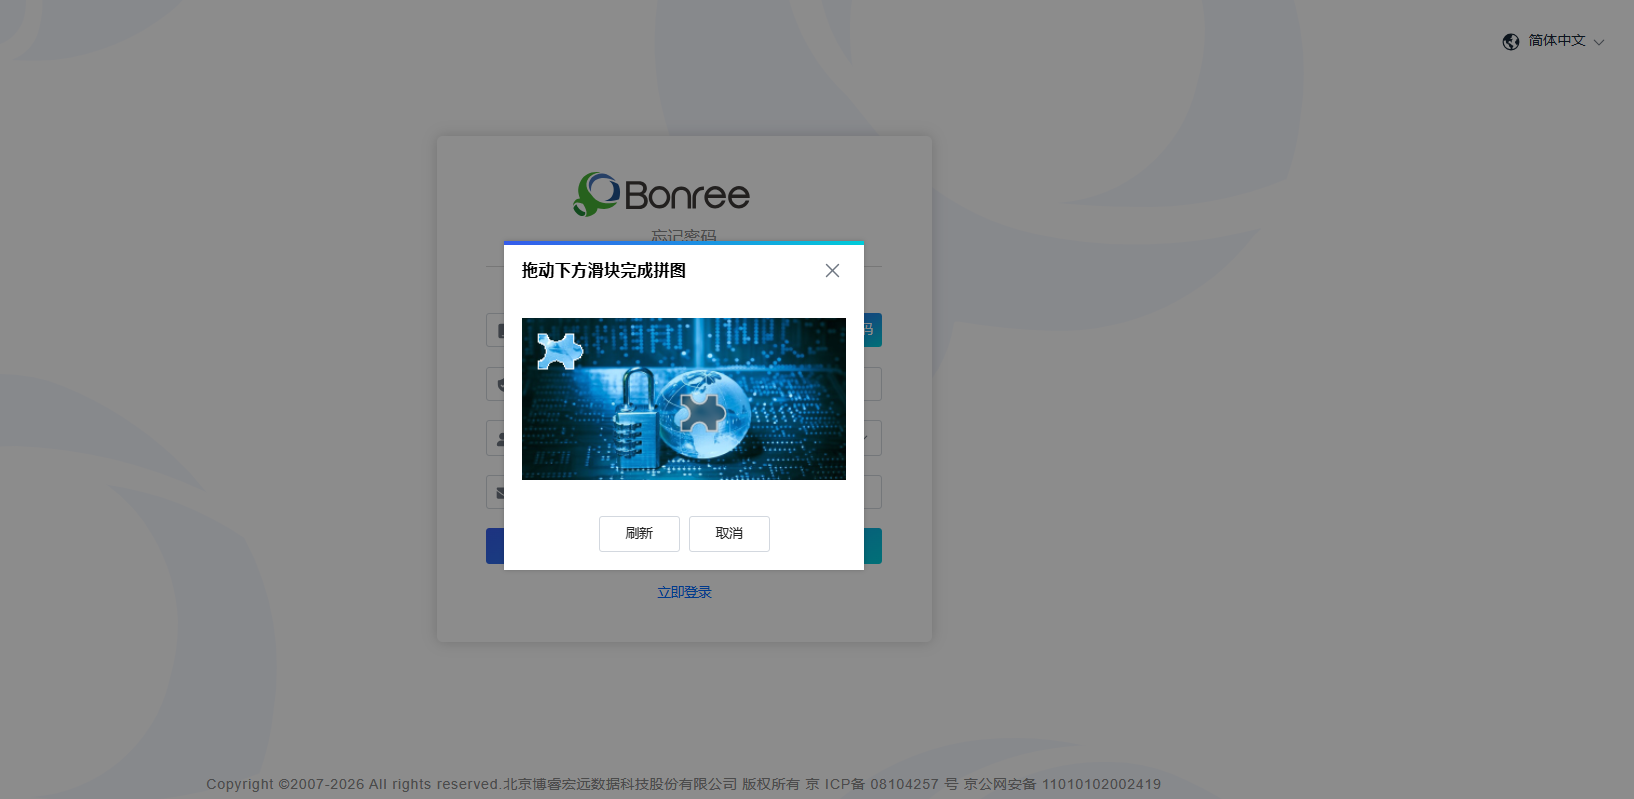
- Forgot password: captcha for获取验证码 changed to drag puzzle
- "Pilot Platform" menu made configurable, checked by default

- When the authorization button is grayed out, hover提示 the reason for graying out

- "Admin resource" text changed to: "Default resource"
- Group notifications: newly added ones displayed at the top
- Agent management route adjustment
- English text corrections
Bug Fixes
- 103-4434 [Shede] After deploying the platform and creating a master account, only the help support interface was found. The platform address uses domain mapping, no waf interception, need help troubleshooting.
SmartAgent
New Features
-
Support process collection whitelist and parent-child process metric splitting strategy:
Whitelist processes unconditionally collect metrics
Parent-child processes of whitelist processes collect metrics independently
Non-whitelist processes: child process metrics merged into parent process
Enhancements
-
JavaAgent 9.12.0 version changes:
Optimize consistency of error request and call chain error标识 in asynchronous thread scenarios;
Optimize JDK 17 adaptation, avoid Class.getGenericSignature0() exception.
-
DotnetAgent6.15.3 version changes:
Adapt to nms-ActiveMQ/AMQP interfaces (supported versions: Apache.NMS.ActiveMQ-2.2.0, .NET Core 2.0/2.1/2.2/3.0/3.1, .NET5.0/6.0/7.0/8.0; Apache.NMS.AMQP-2.4.0, .NET Core2.0/2.1/2.2/3.0/3.1, .NET5.0/6.0/7.0/8.0);
Fix GAC loading failure during installation caused by introducing third-party WebApi library.
-
Image updated to 1.1.4: --set-conf and --reset-conf configure YAML array fields with each element on a separate line;
-
Installation parameter optimization: --set-conf and --reset-conf configure YAML array fields with each element on a separate line;
-
dockerhelper infinite loop detection optimization: raise default检查阈值 to reduce false positive risk;
-
Optimize dockerhelper: check if mount target path is合法, skip if not; add reentrant injection check.
ONE 3.10.0.0 —— 2026/01/30
【APM】
New Features
- Batch Collection Rule Import/Export: The data collection module now supports batch import and export of custom collection rules for containers and processes via Excel templates, significantly improving rule configuration and management efficiency.


- Serverless Probe Automatic Dump: Supports automatic triggering of dumps for Serverless probes and saving the files to the local server.

- Host Probe Manual Upgrade: Supports immediate manual upgrade of single or multiple host probes to specified versions, making upgrade control more flexible.

Optimizations
- SQL Analysis Enhancement: In the database module, SQL execution analysis now supports more database types and provides user-friendly prompts for cases where execution plans are often empty.

- Menu Structure Streamlining: The Profiling function has been integrated into the 【Diagnostic Tools】 menu, simplifying navigation.

- Permission Tag Adaptation: The system predefines the
system_nametag. APM will automatically tag entities according to tag rules when passing through entities.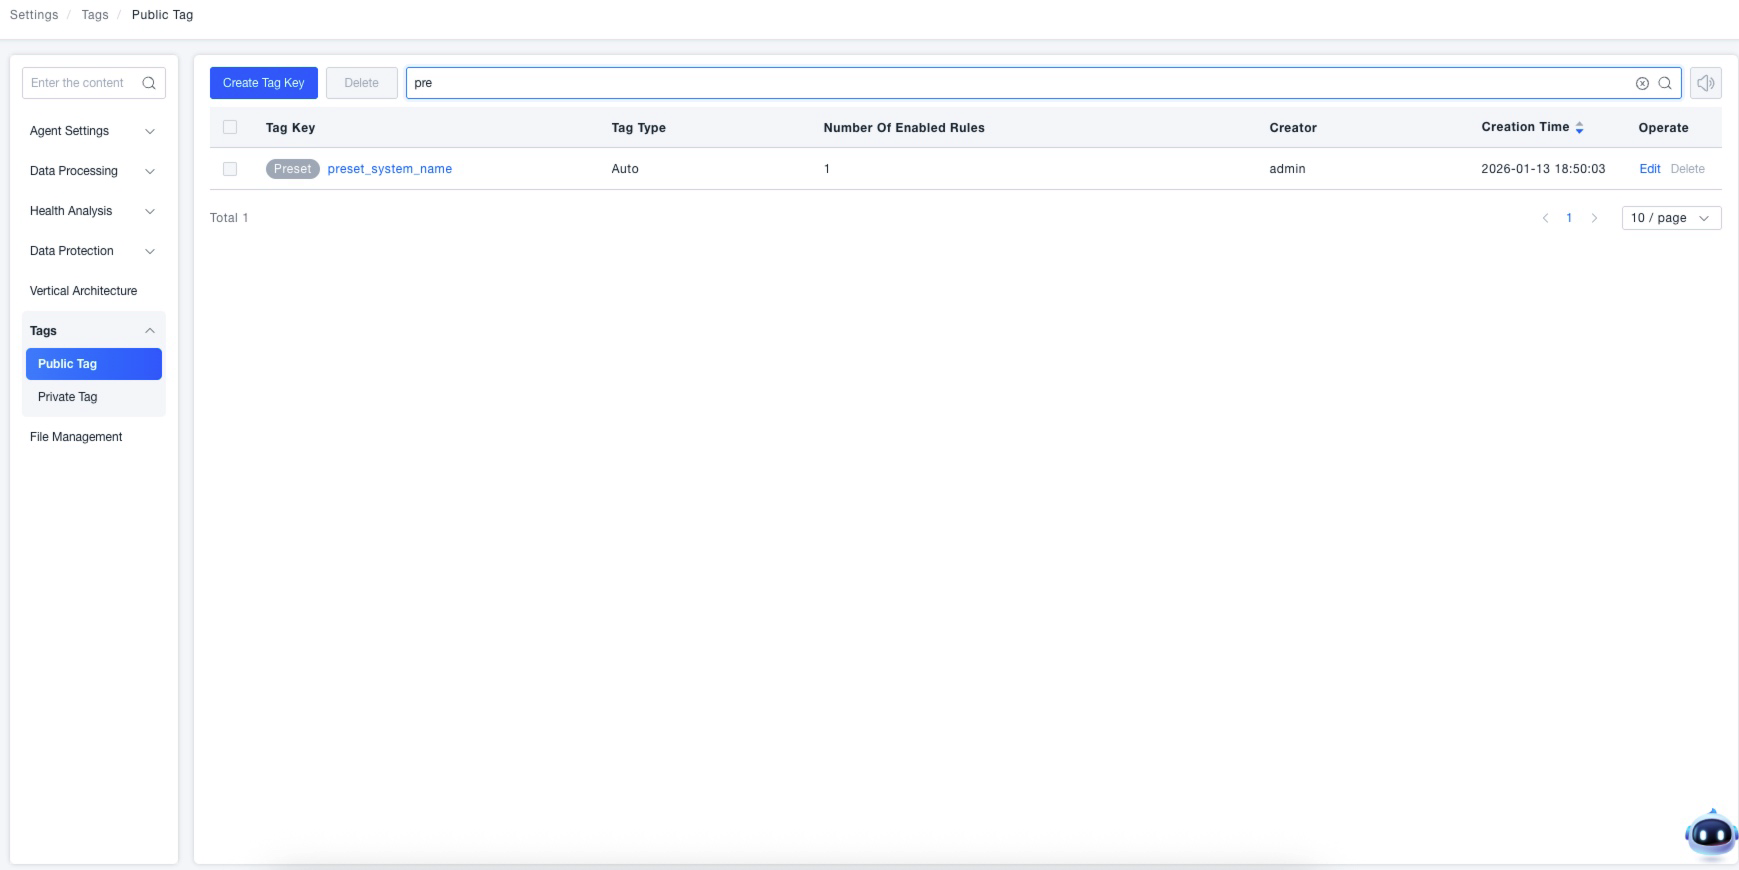
- K8S Resource Information Enhancement: Resource detail pages for Services, StatefulSets, etc., now display Kubernetes labels and annotation information.

- Disk Monitoring View Optimization: Disk monitoring metrics on the host detail page are now grouped by "Disk Partition" dimension by default for a more intuitive view. In CMDB, disk monitoring metrics have been bound to the partition model.

- Network Interface Monitoring View Optimization: Network interface monitoring metrics on the host detail page are now grouped by "Network Interface" dimension by default for clearer presentation.

- Global Topology Experience Upgrade: System filtering is optimized to cascading select boxes, and cross-system service call relationships are now displayed. Exporting supports selecting whether to include background colors.