AI Service Call Chain Analysis
Trace every AI Service invocation end-to-end. Supports Call Tree and Call Map views to reconstruct the complete call flow, with the ability to inspect each node's Input/Output, latency, attributes, and logs.
Core Capabilities
- Invocation List Overview: Aggregate all AI call records across services, showing status, response time, Trace ID, service name, endpoint, and Token consumption — with multi-dimensional filtering.
- Call Tree — Gantt Timeline: Visualize each Span's hierarchy and latency distribution as a tree with a horizontal time axis. Supports ALL and LLM filter modes.
- Node Detail Panel: Click any Span to view its Input/Output content, latency breakdown, code stack, error information, and logs for precise root cause analysis.
- Call Map — Topology View: Display the call chain as a directed graph showing service node relationships, with each node reporting average response time, request count, and error count.
Use Cases
- Root-cause a Slow Request: A call takes 2+ minutes. Open the Call Tree and use the time axis to identify that
llm ChatOpenAIaccounts for most of the latency. Click the node to inspect the Prompt and confirm an oversized System Prompt is the cause. - Analyze LLM Node Calls: Switch to LLM filter mode to hide HTTP and chain nodes, focusing exclusively on model invocations — including Token counts and Input/Output content per call.
- Understand Complex Agent Topology: Switch to Call Map to visualize the full flow from entry service through RunnableSequence, ChatOpenAI, and LangGraph, making the architecture immediately clear.
Feature Guide
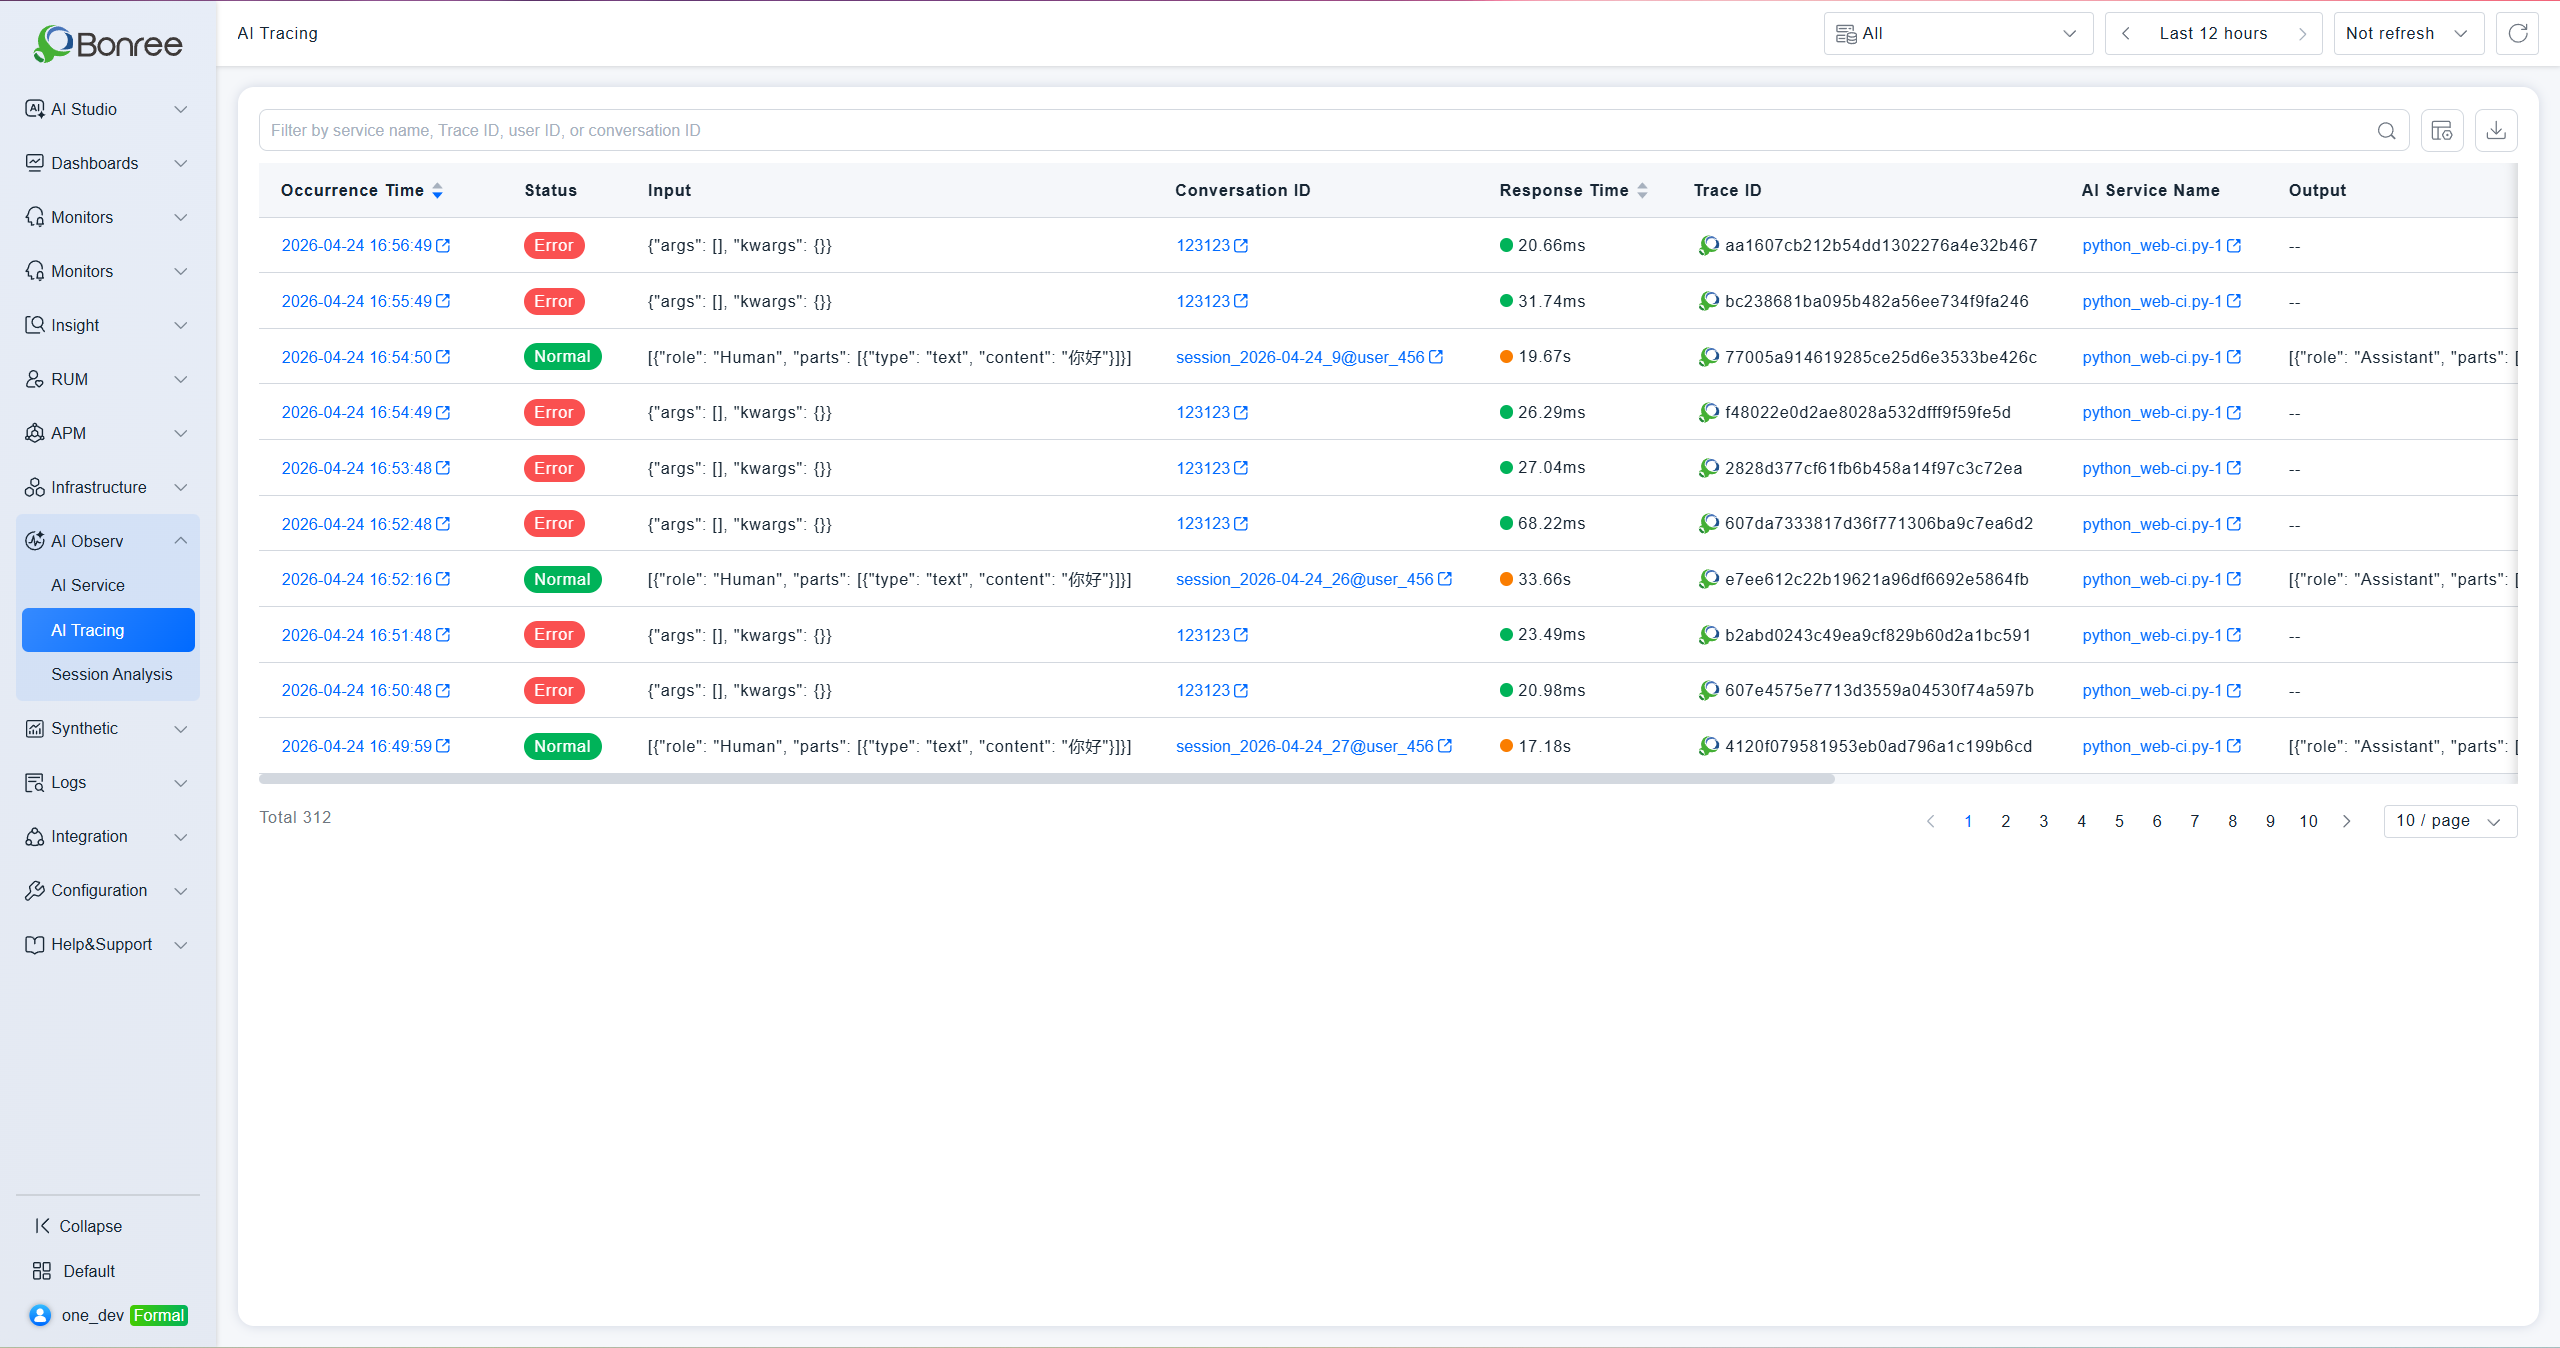
Trace List
Displays all AI call records with timestamp, status, response time, Trace ID, AI Service name, endpoint, and total Token consumption. Filter by service name, Trace ID, user ID, or session ID. Supports column customization and data export. Click a timestamp to open the corresponding call chain detail page.
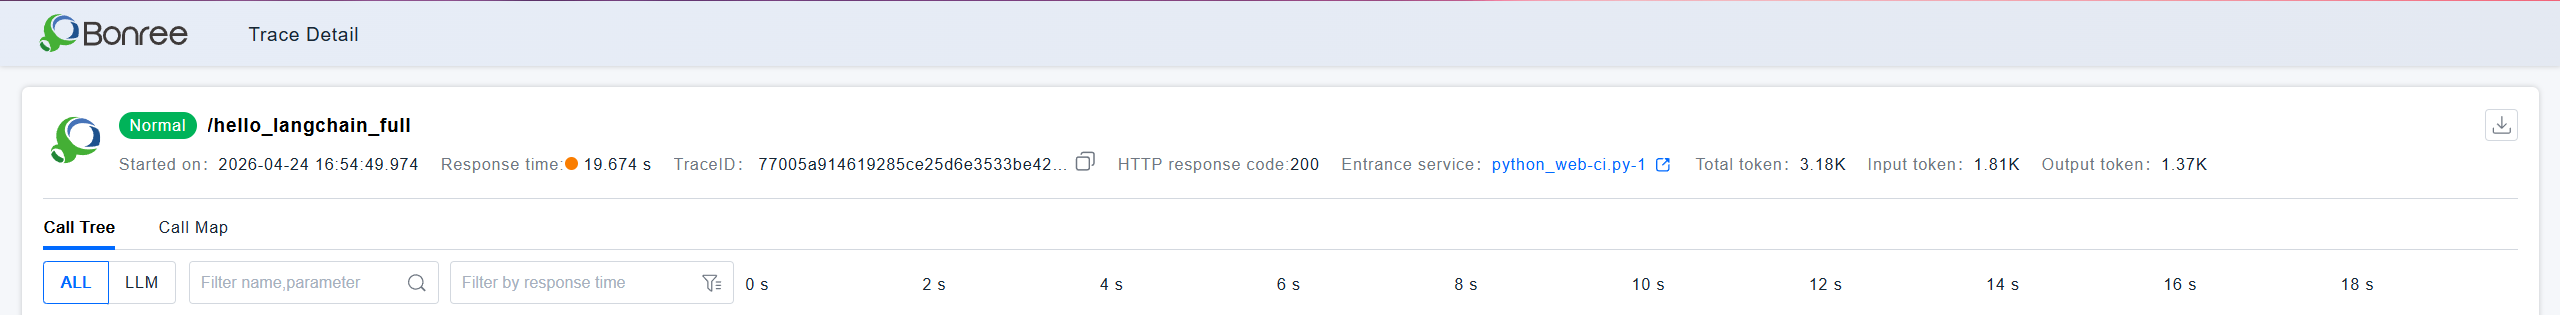
Trace Detail — Header Bar
The top of the detail page shows the endpoint name, status, start time, response time, Trace ID, HTTP status code, and entry service for that invocation. A download button is available to export the full Trace data.
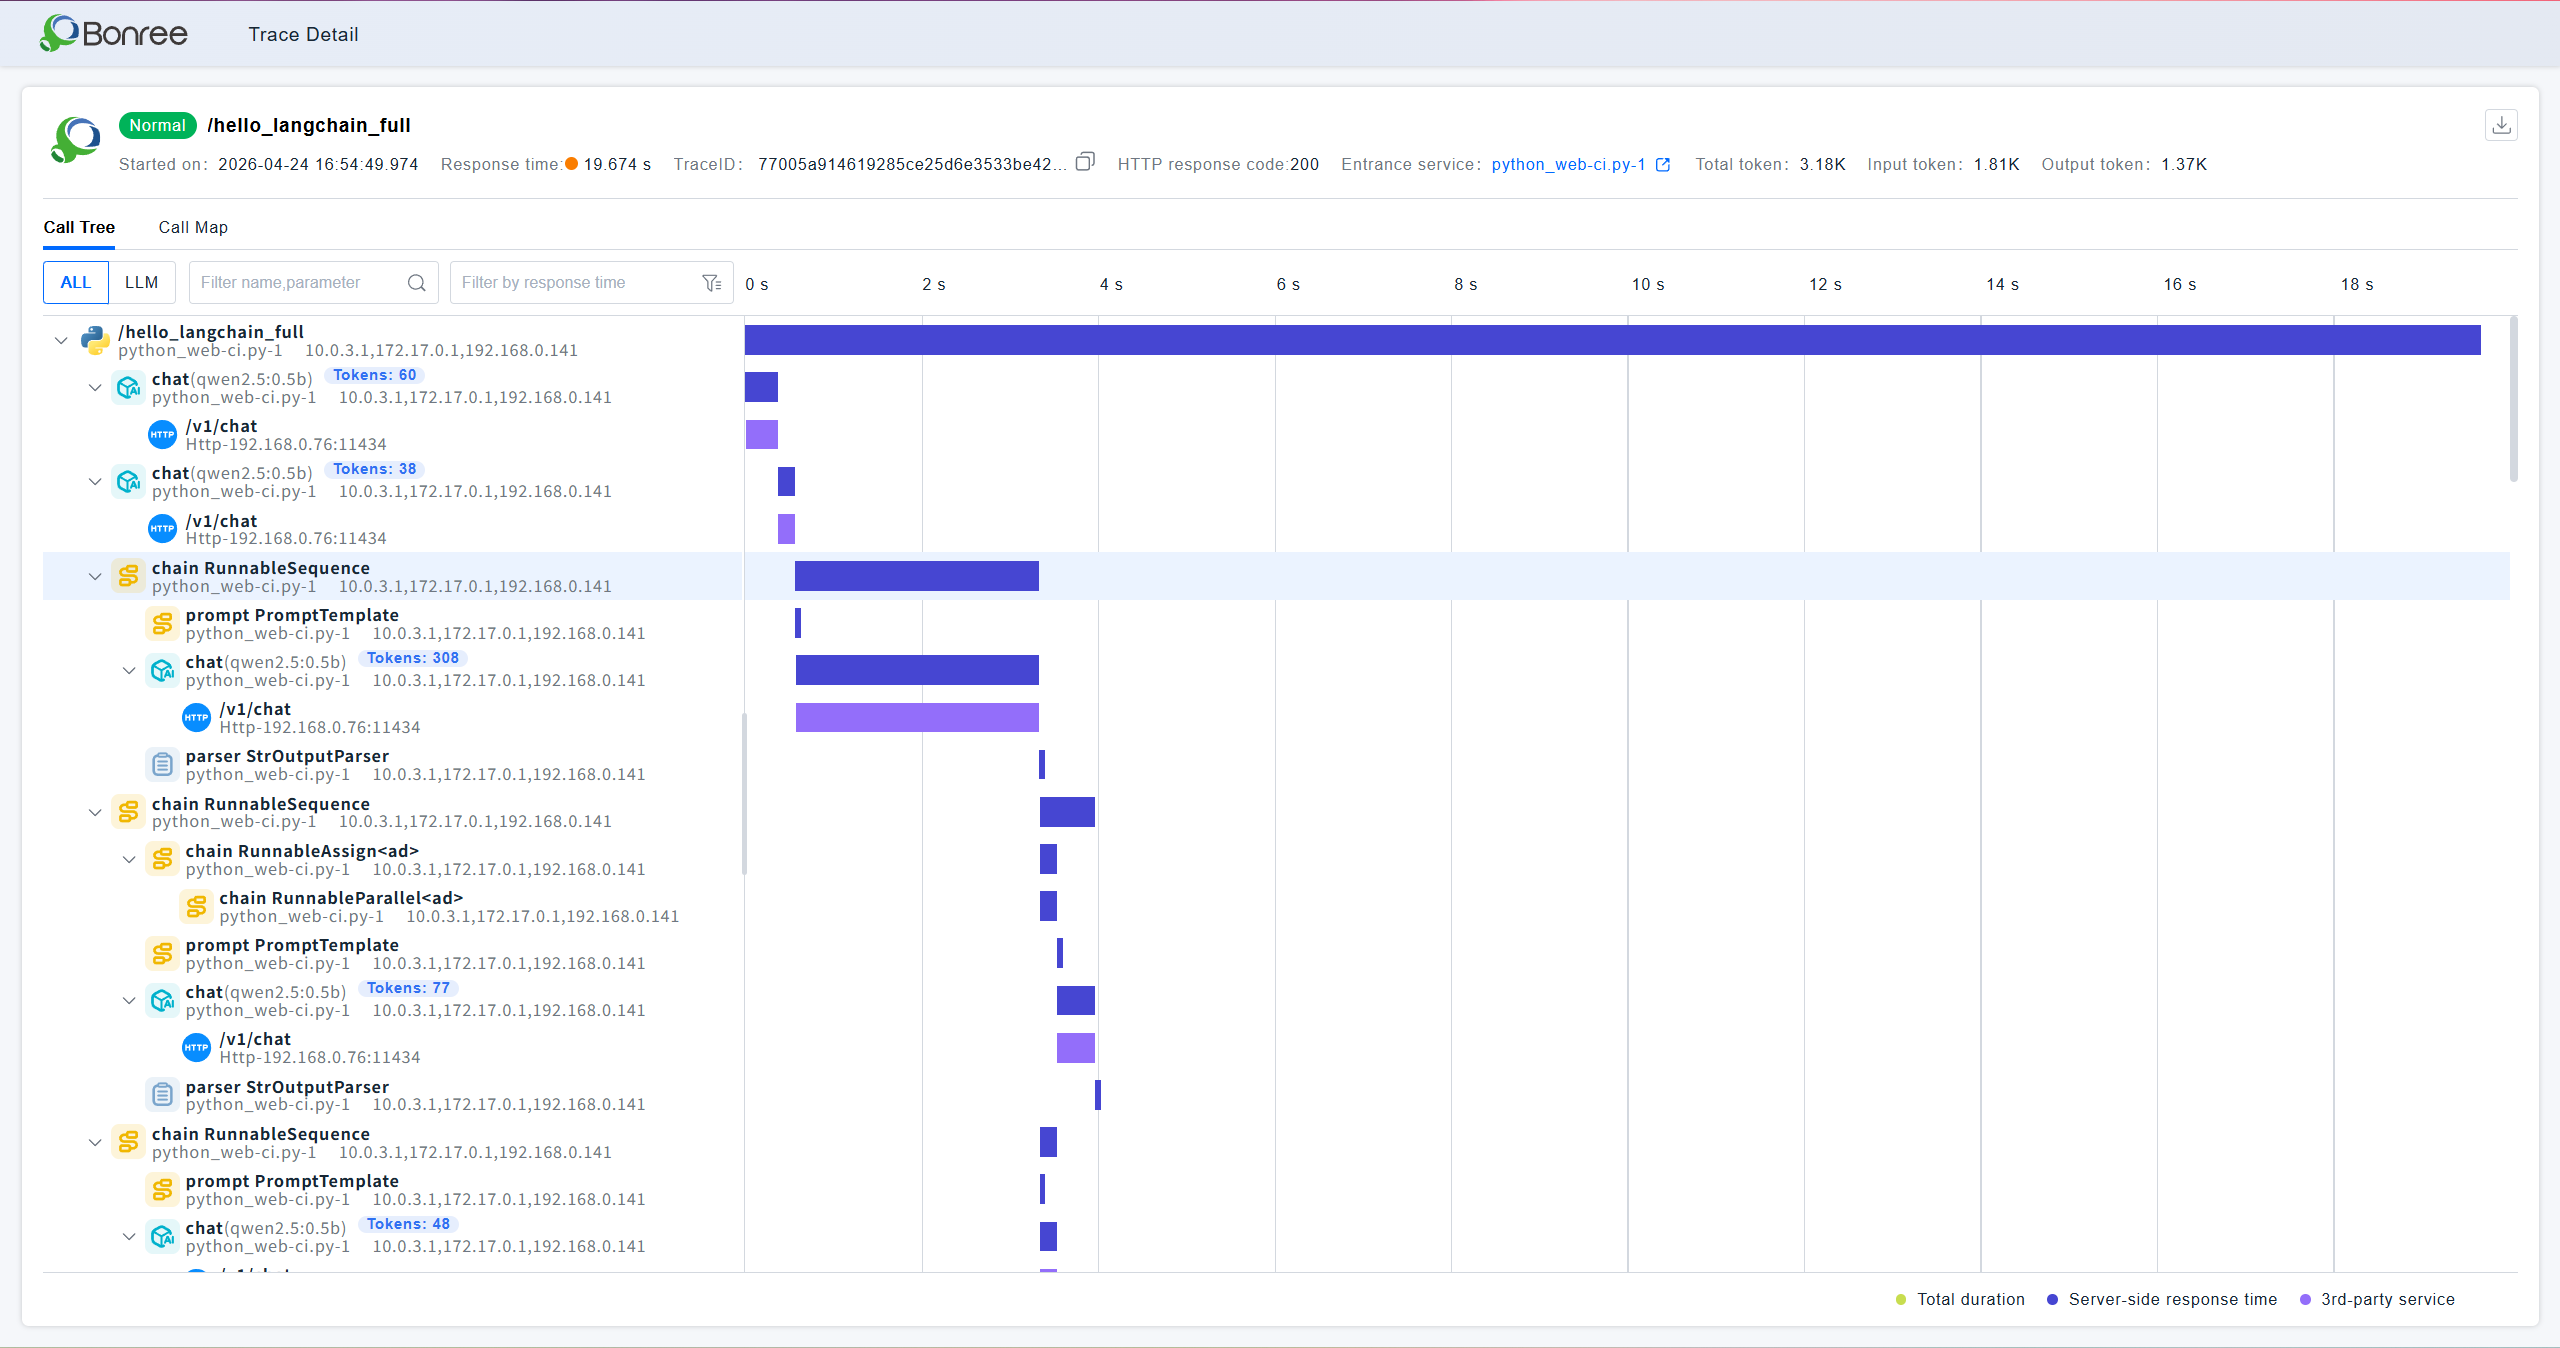
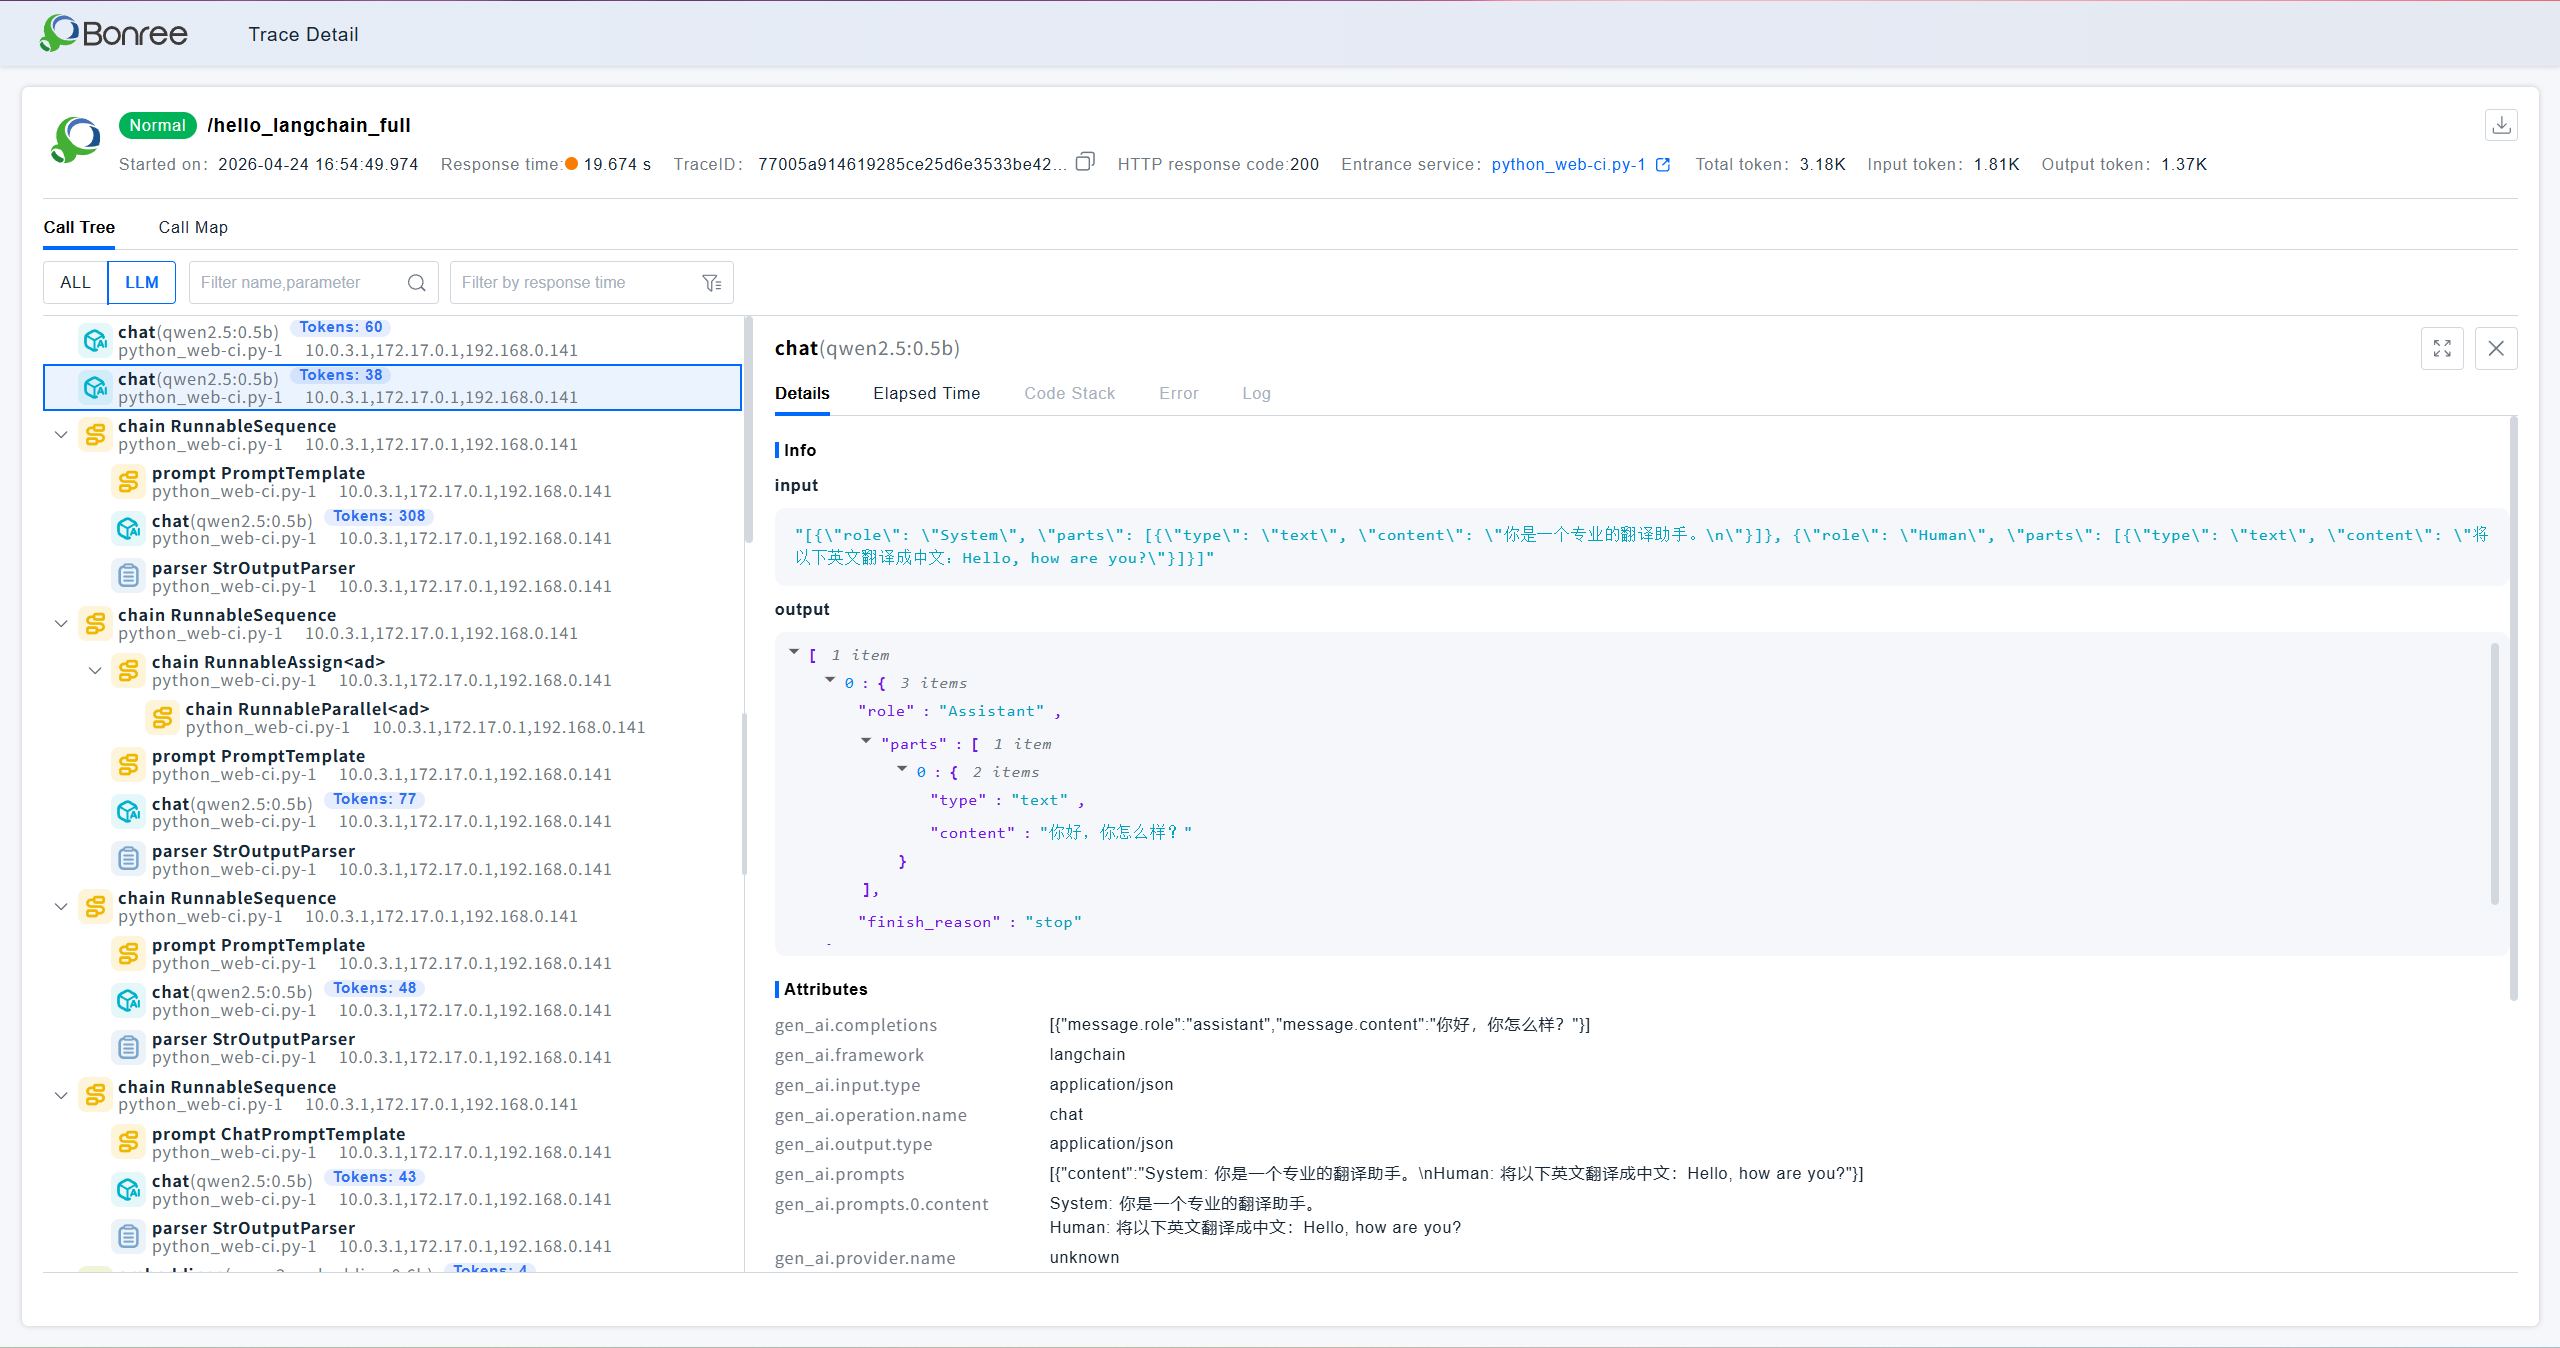
Call Tree — ALL Mode
Displays the complete call chain as a hierarchical tree with a Gantt-style time axis, including all Span types: HTTP requests, chains, prompts, llm nodes, parsers, and more. Each node shows its name, service, IP, and Token count (for llm nodes). The right-side axis visualizes start/end times and relative latency. A legend at the bottom distinguishes total duration, server response time, and third-party service time. Supports filtering by name/parameter and by response time.
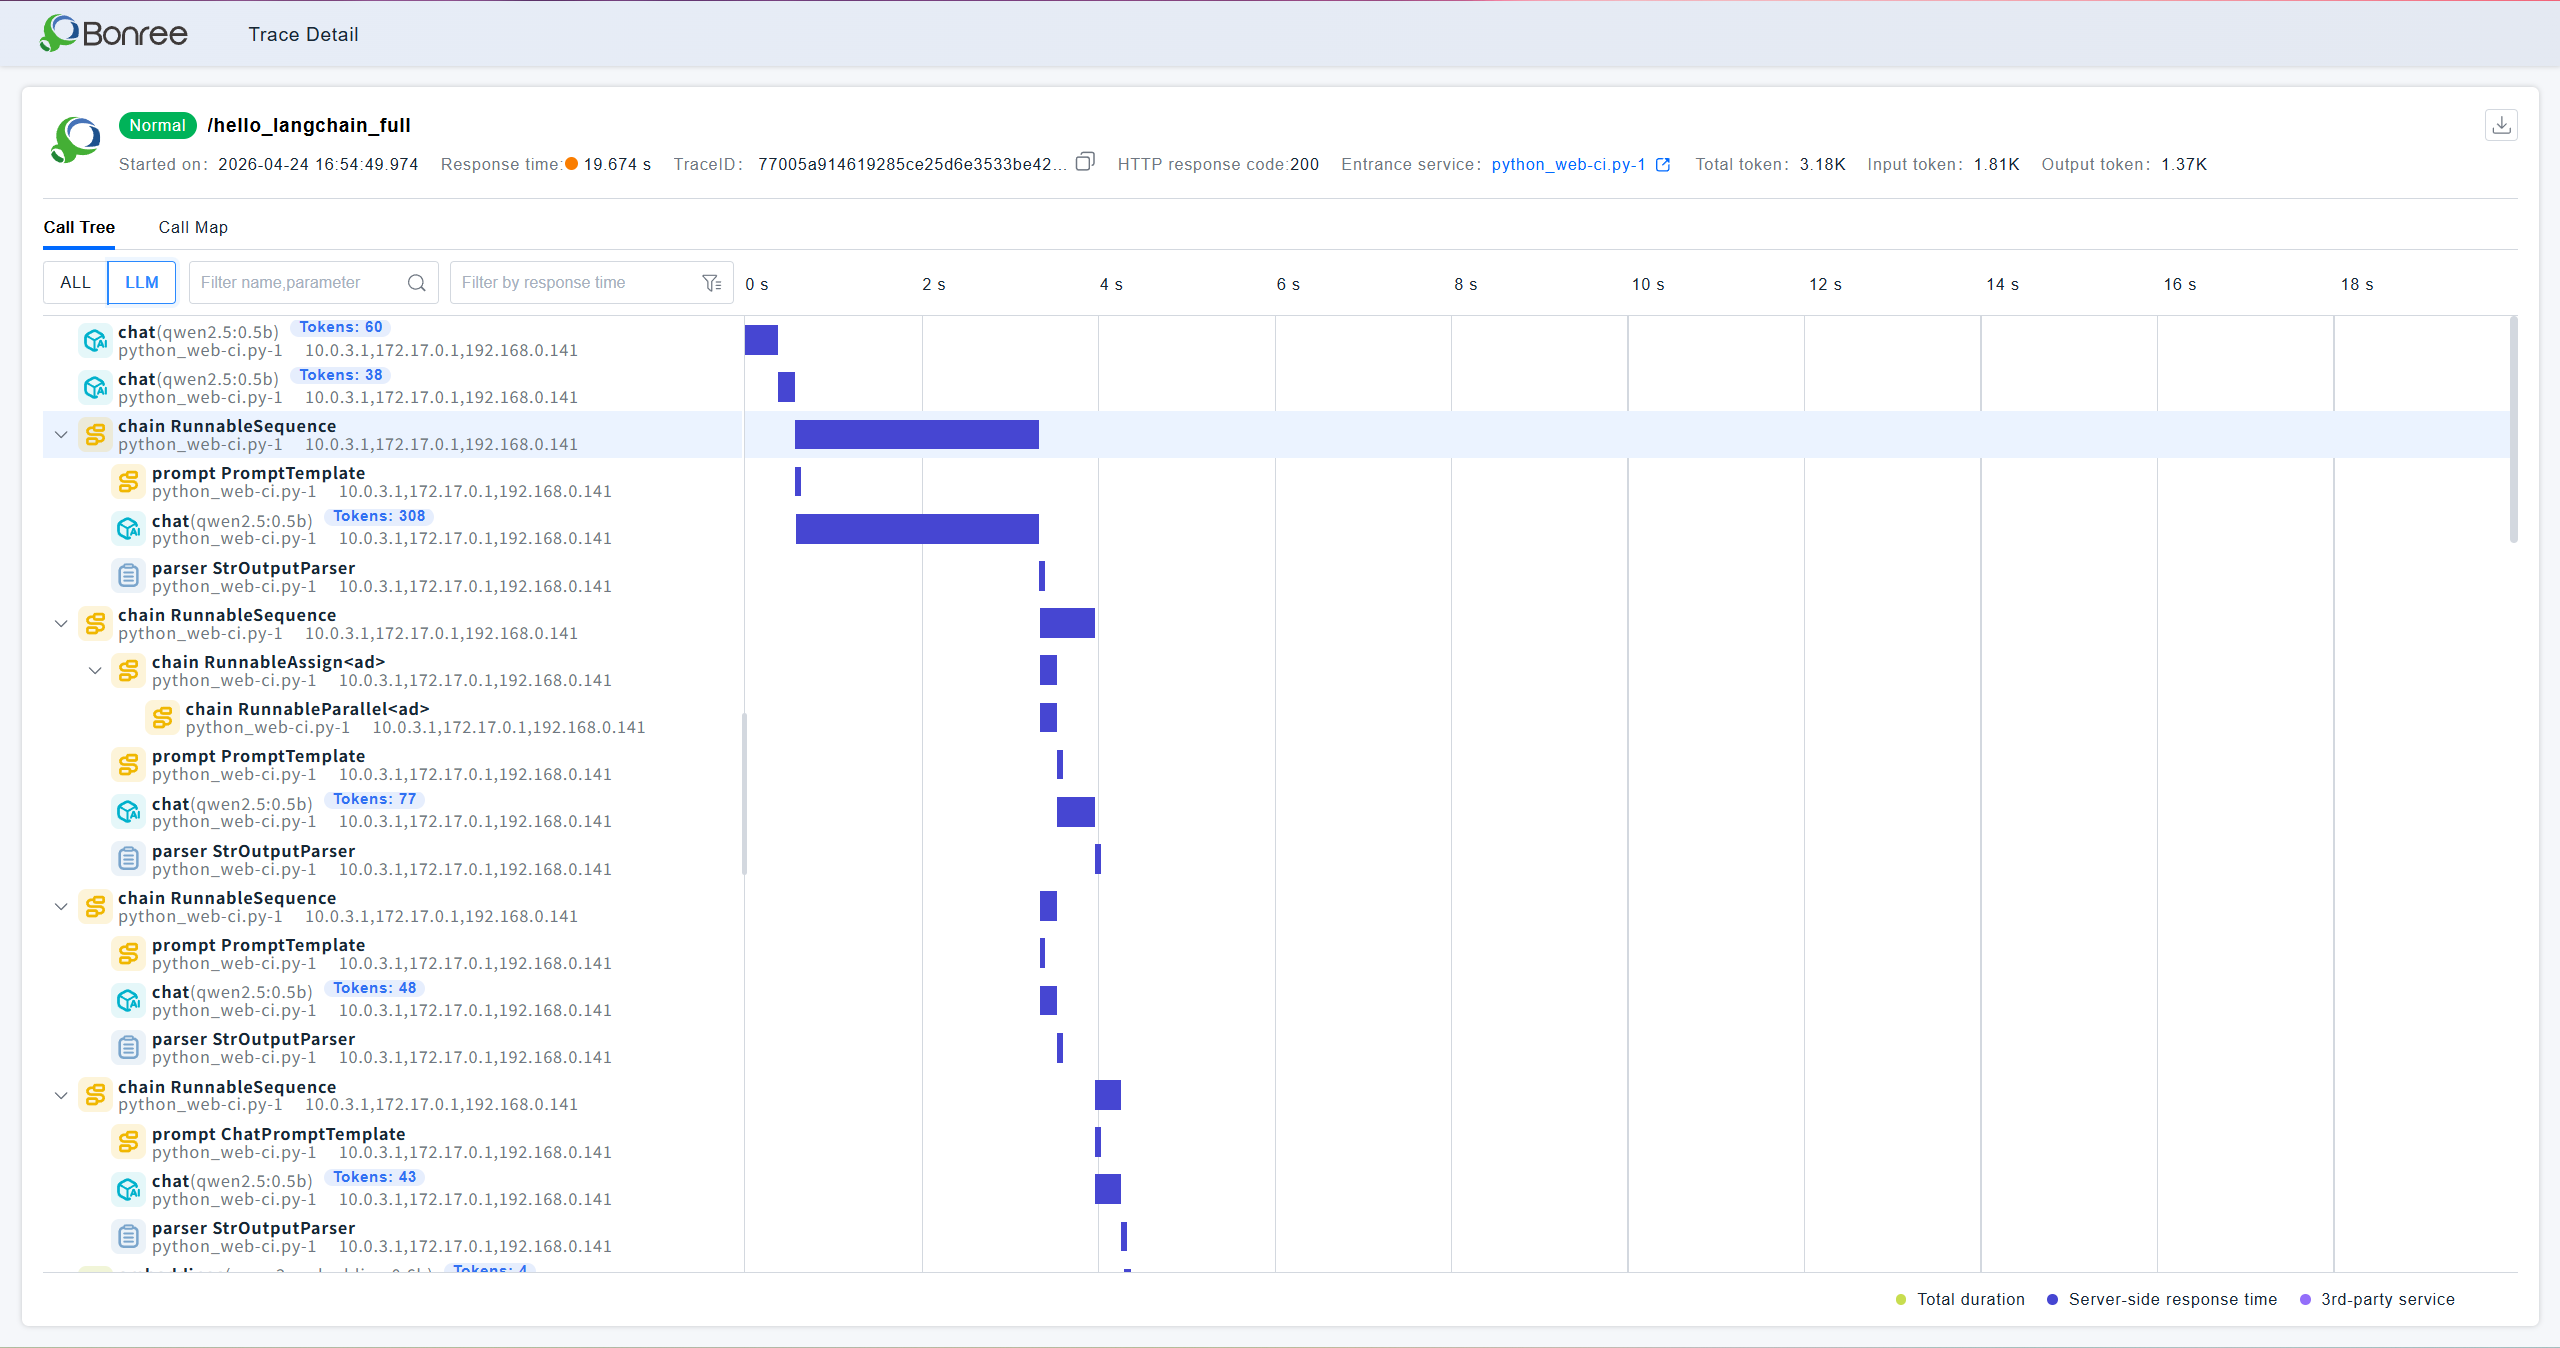
Call Tree — LLM Mode
Switching to LLM mode filters the call tree to show only AI-related nodes (chains, prompts, llm nodes), hiding infrastructure nodes such as HTTP spans. This makes it easier to focus on the model invocation layer.
Node Detail Panel
Click any node in the Call Tree to open a detail panel on the right with four sub-tabs:
- Details: Shows the node's Input, Output, and Attributes list (e.g.,
br.llm_call.id,gen_ai.framework,gen_ai.prompts.0.content). - Latency: Shows the time breakdown of internal phases within the node.
- Code Stack: Shows the code call stack that triggered this node.
- Errors / Logs: Shows any exceptions or log output generated during node execution.
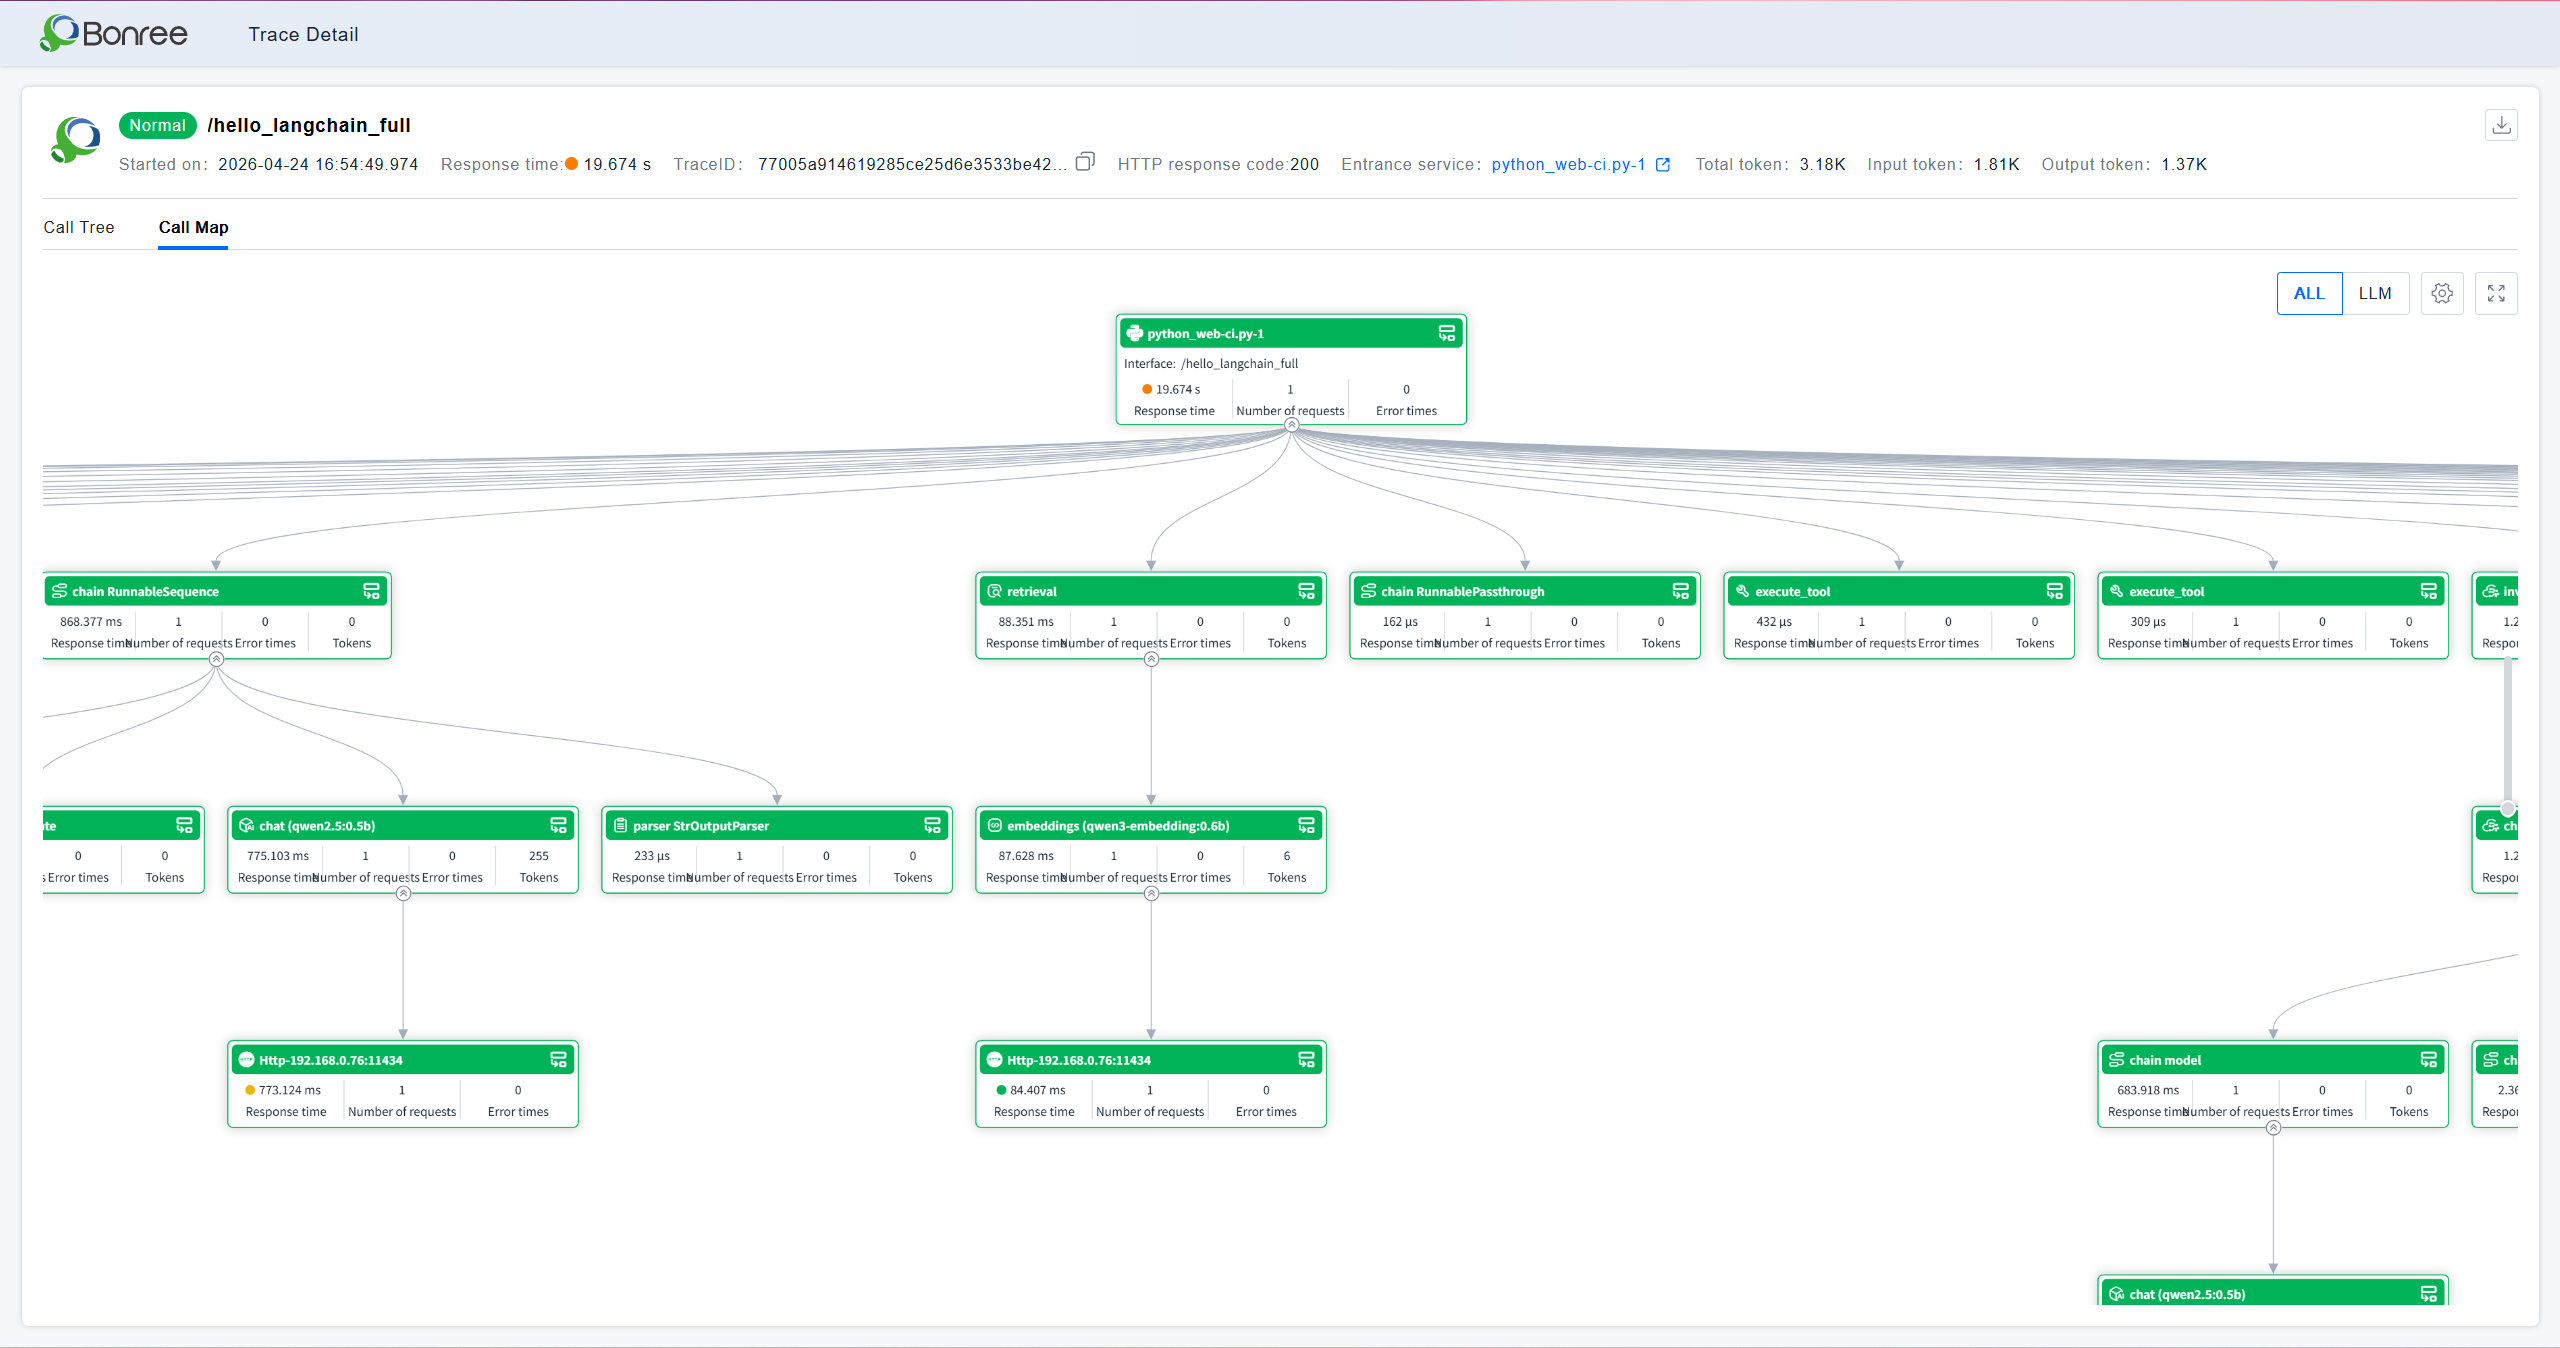
Call Map — Topology View
Switch to the Call Map tab to see the call chain as a directed topology graph. Each node card shows its index, name, average response time, request count, error count, and Token count (for llm nodes). Supports ALL / LLM filter mode toggle and full-screen view.
Notes
LLM Mode: Both Call Tree and Call Map support switching to LLM mode, which shows only model-related nodes — ideal for focused AI inference analysis.
Token Display: Token counts are shown only on
llmtype nodes. Other node types (chain, HTTP, etc.) do not display Token information.
Node Input/Output Availability: Input/Output content in the node detail panel is only populated when collection is enabled in the AI Invocation Monitoring rules. If the panel shows loading or is empty, check your collection configuration.
Trace Data Download: The download button in the top-right corner of the detail page exports the full raw Trace data, useful for offline analysis or issue reporting.
Entry Service Link: The entry service shown in the header is a clickable link that navigates to the corresponding service monitoring detail page.